Matplotlib中Artist对象属性的全面探索:使用properties()方法
参考:Matplotlib.artist.Artist.properties() in Python
Matplotlib是Python中最流行的数据可视化库之一,它提供了丰富的绘图功能和灵活的自定义选项。在Matplotlib的架构中,Artist对象扮演着核心角色,负责绘制图形的各个元素。而Artist对象的属性则决定了这些元素的外观和行为。本文将深入探讨Matplotlib中Artist对象的properties()方法,这个方法允许我们获取和操作Artist对象的所有属性,从而实现更精细的图形定制。
1. Artist对象简介
在Matplotlib中,几乎所有可见的元素都是Artist对象。这包括Figure、Axes以及线条、文本、标记等具体的绘图元素。Artist对象是Matplotlib绘图系统的基础,理解和掌握Artist对象的属性操作对于创建高质量的可视化图表至关重要。
让我们从一个简单的例子开始,创建一个基本的图形并查看其属性:
import matplotlib.pyplot as plt

fig, ax = plt.subplots()
line, = ax.plot([1, 2, 3, 4], [1, 4, 2, 3], label='how2matplotlib.com')

print(line.properties())
plt.show()
Output:
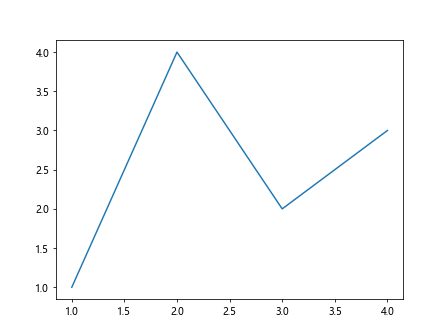
在这个例子中,我们创建了一个简单的线图,并使用properties()方法打印出Line2D对象的所有属性。这将输出一个包含所有可用属性及其当前值的字典。
2. properties()方法的作用
properties()方法是Artist类的一个重要方法,它返回一个包含所有可设置属性及其当前值的字典。这个方法的主要作用包括:
- 查看当前对象的所有可设置属性
- 获取属性的当前值
- 帮助理解和调试复杂的图形设置
- 为批量修改属性提供便利
让我们通过一个更复杂的例子来展示properties()方法的用途:
import matplotlib.pyplot as plt
import numpy as np

fig, ax = plt.subplots()

x = np.linspace(0, 10, 100)
y = np.sin(x)

line = ax.plot(x, y, label='how2matplotlib.com')[0]
ax.set_title('Sine Wave')

props = line.properties()
print("Line properties:")
for key, value in props.items():
    print(f"{key}: {value}")

plt.show()
Output:
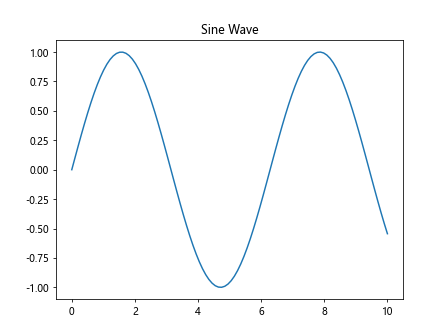
这个例子创建了一个正弦波图,并打印出Line2D对象的所有属性。通过查看这些属性,我们可以了解到线条的颜色、线型、标记等各种设置。
3. 常用Artist对象及其属性
Matplotlib中有多种类型的Artist对象,每种对象都有其特定的属性集。以下是一些常见的Artist对象及其重要属性:
3.1 Figure
Figure是最顶层的容器,包含所有的绘图元素。
import matplotlib.pyplot as plt

fig = plt.figure(figsize=(8, 6))
print("Figure properties:")
for key, value in fig.properties().items():
    print(f"{key}: {value}")

plt.text(0.5, 0.5, 'how2matplotlib.com', ha='center', va='center')
plt.show()
Output:
这个例子创建了一个Figure对象,并打印出其所有属性。Figure的重要属性包括figsize(图形大小)、dpi(分辨率)等。
3.2 Axes
Axes是实际的绘图区域,包含数据、坐标轴、标题等。
import matplotlib.pyplot as plt

fig, ax = plt.subplots()
ax.set_title('how2matplotlib.com')
ax.set_xlabel('X axis')
ax.set_ylabel('Y axis')

print("Axes properties:")
for key, value in ax.properties().items():
    print(f"{key}: {value}")

plt.show()
Output:
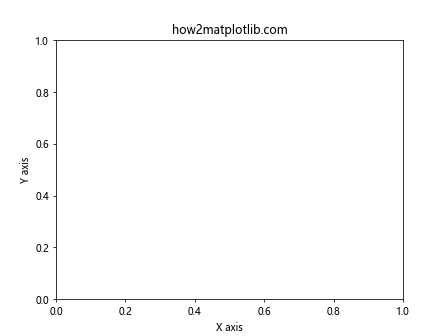
这个例子展示了Axes对象的属性。重要的Axes属性包括title(标题)、xlabel(x轴标签)、ylabel(y轴标签)等。
3.3 Line2D
Line2D对象代表在Axes上绘制的线条。
import matplotlib.pyplot as plt
import numpy as np

fig, ax = plt.subplots()

x = np.linspace(0, 10, 100)
y = np.sin(x)

line = ax.plot(x, y, label='how2matplotlib.com', color='red', linestyle='--', linewidth=2)[0]

print("Line2D properties:")
for key, value in line.properties().items():
    print(f"{key}: {value}")

plt.legend()
plt.show()
Output:
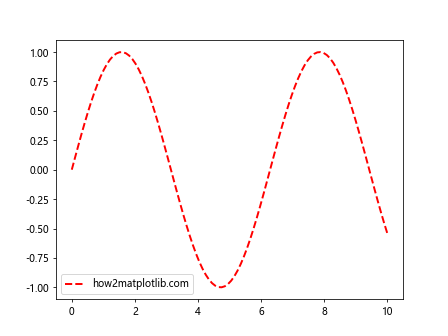
这个例子创建了一个Line2D对象并打印其属性。Line2D的重要属性包括color(颜色)、linestyle(线型)、linewidth(线宽)等。
3.4 Text
Text对象用于在图形中添加文本。
import matplotlib.pyplot as plt

fig, ax = plt.subplots()

text = ax.text(0.5, 0.5, 'how2matplotlib.com', fontsize=20, color='blue', ha='center', va='center')

print("Text properties:")
for key, value in text.properties().items():
    print(f"{key}: {value}")

plt.show()
Output:
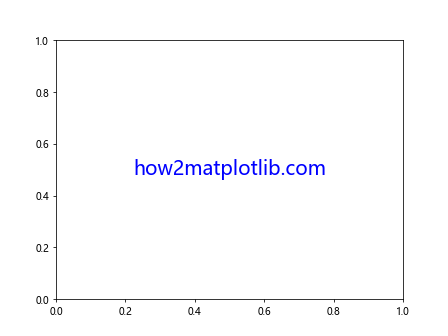
这个例子创建了一个Text对象并打印其属性。Text的重要属性包括text(文本内容)、fontsize(字体大小)、color(颜色)等。
4. 使用properties()方法进行属性查询和修改
properties()方法不仅可以用于查询属性,还可以帮助我们进行属性的批量修改。以下是一些实用的技巧:
4.1 查询特定属性
import matplotlib.pyplot as plt
import numpy as np

fig, ax = plt.subplots()

x = np.linspace(0, 10, 100)
y = np.sin(x)

line = ax.plot(x, y, label='how2matplotlib.com')[0]

print("Line color:", line.properties()['color'])
print("Line style:", line.properties()['linestyle'])

plt.show()
Output:
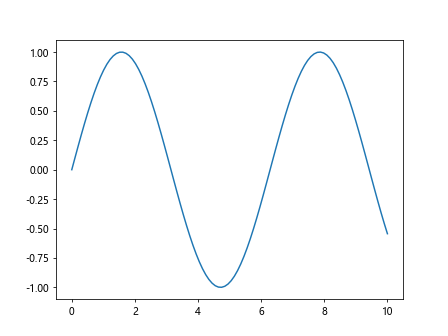
这个例子展示了如何查询Line2D对象的特定属性,如颜色和线型。
4.2 批量修改属性
import matplotlib.pyplot as plt
import numpy as np

fig, ax = plt.subplots()

x = np.linspace(0, 10, 100)
y = np.sin(x)

line = ax.plot(x, y, label='how2matplotlib.com')[0]

new_props = {
    'color': 'red',
    'linestyle': '--',
    'linewidth': 2,
    'marker': 'o',
    'markersize': 5
}

line.set(**new_props)

print("Updated Line2D properties:")
for key, value in line.properties().items():
    if key in new_props:
        print(f"{key}: {value}")

plt.legend()
plt.show()
Output:
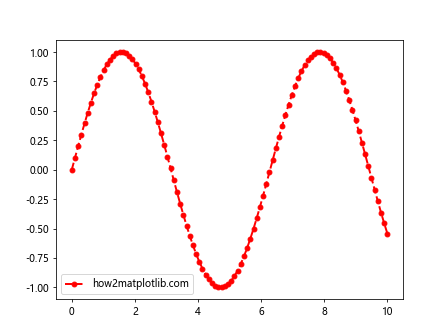
这个例子展示了如何使用properties()方法返回的字典格式来批量修改Line2D对象的属性。
4.3 动态调整属性
import matplotlib.pyplot as plt
import numpy as np

fig, ax = plt.subplots()

x = np.linspace(0, 10, 100)
y = np.sin(x)

line = ax.plot(x, y, label='how2matplotlib.com')[0]

colors = ['red', 'green', 'blue', 'purple']
styles = ['-', '--', '-.', ':']

for i in range(4):
    line.set_color(colors[i])
    line.set_linestyle(styles[i])
    plt.pause(1)
    print(f"Iteration {i+1}:")
    print(f"Color: {line.properties()['color']}")
    print(f"Line style: {line.properties()['linestyle']}")

plt.show()
Output:

这个例子展示了如何动态调整Line2D对象的属性,并使用properties()方法实时查看更改。
5. properties()方法在不同类型Artist对象中的应用
properties()方法可以应用于所有的Artist对象。让我们看看它在不同类型的Artist对象中的应用:
5.1 在散点图中应用
import matplotlib.pyplot as plt
import numpy as np

fig, ax = plt.subplots()

x = np.random.rand(50)
y = np.random.rand(50)

scatter = ax.scatter(x, y, label='how2matplotlib.com')

print("Scatter plot properties:")
for key, value in scatter.properties().items():
    print(f"{key}: {value}")

plt.legend()
plt.show()
Output:
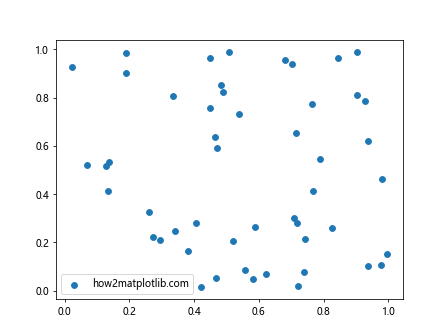
这个例子展示了如何在散点图对象上使用properties()方法。
5.2 在柱状图中应用
import matplotlib.pyplot as plt
import numpy as np

fig, ax = plt.subplots()

x = ['A', 'B', 'C', 'D']
y = [3, 7, 2, 5]

bars = ax.bar(x, y)

print("Bar plot properties:")
for key, value in bars[0].properties().items():
    print(f"{key}: {value}")

plt.title('how2matplotlib.com')
plt.show()
Output:
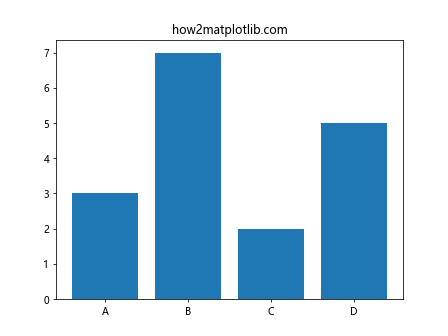
这个例子展示了如何在柱状图对象上使用properties()方法。
5.3 在等高线图中应用
import matplotlib.pyplot as plt
import numpy as np

fig, ax = plt.subplots()

x = np.linspace(-3, 3, 100)
y = np.linspace(-3, 3, 100)
X, Y = np.meshgrid(x, y)
Z = np.sin(X) * np.cos(Y)

contour = ax.contour(X, Y, Z)

print("Contour plot properties:")
for key, value in contour.properties().items():
    print(f"{key}: {value}")

plt.title('how2matplotlib.com')
plt.show()
Output:
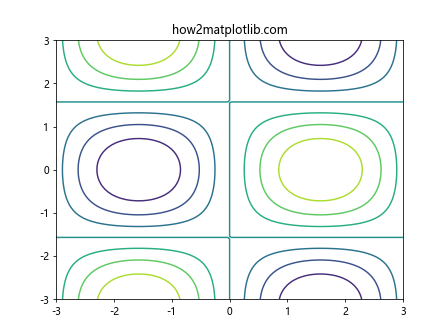
这个例子展示了如何在等高线图对象上使用properties()方法。
6. properties()方法在自定义图形中的应用
properties()方法在创建自定义图形时特别有用,它可以帮助我们精确控制图形的各个方面。
6.1 创建自定义标记
import matplotlib.pyplot as plt
import numpy as np

class CustomMarker(plt.Line2D):
    def __init__(self, x, y, marker='o', size=10, color='b'):
        super().__init__([x], [y], marker=marker, markersize=size, color=color)

fig, ax = plt.subplots()

custom_marker = CustomMarker(0.5, 0.5, marker='*', size=20, color='r')
ax.add_line(custom_marker)

print("Custom marker properties:")
for key, value in custom_marker.properties().items():
    print(f"{key}: {value}")

ax.set_xlim(0, 1)
ax.set_ylim(0, 1)
ax.text(0.5, 0.3, 'how2matplotlib.com', ha='center')
plt.show()
Output:
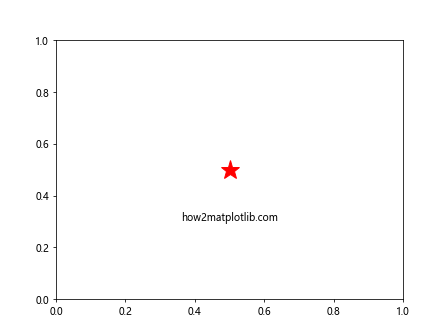
这个例子展示了如何创建一个自定义标记,并使用properties()方法查看其属性。
6.2 创建自定义图例
import matplotlib.pyplot as plt
import matplotlib.patches as mpatches

fig, ax = plt.subplots()

custom_patch = mpatches.Circle((0.5, 0.5), 0.1, facecolor='red', edgecolor='black')
ax.add_patch(custom_patch)

legend = ax.legend([custom_patch], ['Custom Legend'])

print("Legend properties:")
for key, value in legend.properties().items():
    print(f"{key}: {value}")

ax.text(0.5, 0.8, 'how2matplotlib.com', ha='center')
plt.show()
Output:

这个例子展示了如何创建一个自定义图例,并使用properties()方法查看其属性。
7. properties()方法在动画中的应用
properties()方法在创建动画时也非常有用,它可以帮助我们动态更新图形的属性。
import matplotlib.pyplot as plt
import matplotlib.animation as animation
import numpy as np

fig, ax = plt.subplots()

x = np.linspace(0, 2*np.pi, 100)
line, = ax.plot(x, np.sin(x))

def animate(i):
    line.set_ydata(np.sin(x + i/10))
    print(f"Frame {i}: Linestyle = {line.properties()['linestyle']}")
    return line,

def init():
    line.set_ydata(np.sin(x))
    return line,

ani = animation.FuncAnimation(fig, animate, frames=100, init_func=init, interval=50, blit=True)

ax.text(np.pi, 0, 'how2matplotlib.com', ha='center')
plt.show()
Output:
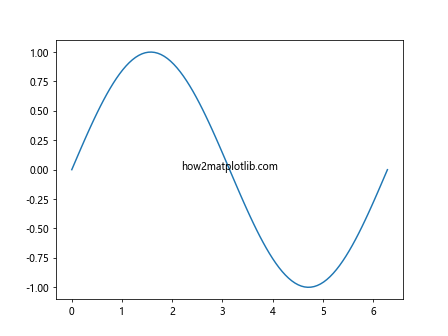
这个例子创建了一个简单的正弦波动画,并在每一帧打印出线条的线型属性。
8. properties()方法在图形保存和导出中的应用
properties()方法在保存和导出图形时也很有用,它可以帮助我们确保图形的属性符合预期。
import matplotlib.pyplot as plt
import numpy as np

fig, ax = plt.subplots()

x = np.linspace(0, 10, 100)
y = np.sin(x)

line = ax.plot(x, y, label='how2matplotlib.com')[0]

print("Before saving:")
print(f"Figure size: {fig.properties()['figwidth']}x{fig.properties()['figheight']}")
print(f"DPI: {fig.properties()['dpi']}")

fig.savefig('sine_wave.png', dpi=300)

print("\nAfter saving:")
print(f"Figure size: {fig.properties()['figwidth']}x{fig.properties()['figheight']}")
print(f"DPI: {fig.properties()['dpi']}")

plt.show()
Output:
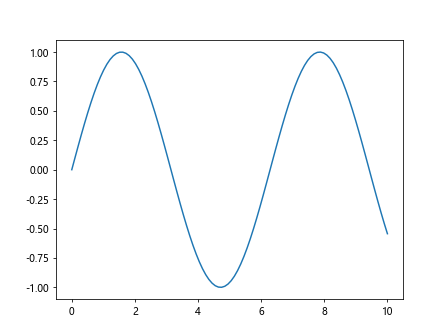
这个例子展示了如何在保存图形前后使用properties()方法检查图形的属性。
9. properties()方法在调试和错误处理中的应用
properties()方法在调试Matplotlib代码和处理错误时非常有用。它可以帮助我们快速查看对象的当前状态,找出潜在的问题。
import matplotlib.pyplot as plt
import numpy as np

fig, ax = plt.subplots()

try:
    x = np.linspace(0, 10, 100)
    y = np.sin(x)
    line = ax.plot(x, y, color='invalid_color')[0]
except ValueError as e:
    print(f"Error: {e}")
    print("\nCurrent line properties:")
    for key, value in line.properties().items():
        print(f"{key}: {value}")

ax.text(5, 0, 'how2matplotlib.com', ha='center')
plt.show()
在这个例子中,我们故意使用了一个无效的颜色值。通过捕获异常并打印line对象的属性,我们可以快速定位问题所在。
10. properties()方法与其他Matplotlib功能的结合使用
properties()方法可以与Matplotlib的其他功能结合使用,以实现更复杂的图形定制和控制。
10.1 与样式表结合使用
import matplotlib.pyplot as plt
import numpy as np

plt.style.use('seaborn')

fig, ax = plt.subplots()

x = np.linspace(0, 10, 100)
y = np.sin(x)

line = ax.plot(x, y, label='how2matplotlib.com')[0]

print("Line properties with seaborn style:")
for key, value in line.properties().items():
    print(f"{key}: {value}")

plt.legend()
plt.show()
这个例子展示了如何使用seaborn样式,并通过properties()方法查看样式对线条属性的影响。
10.2 与颜色映射结合使用
import matplotlib.pyplot as plt
import numpy as np

fig, ax = plt.subplots()

x = np.linspace(0, 10, 100)
y = np.sin(x)

cmap = plt.get_cmap('viridis')
line = ax.plot(x, y, color=cmap(0.5), label='how2matplotlib.com')[0]

print("Line properties with colormap:")
for key, value in line.properties().items():
    print(f"{key}: {value}")

plt.legend()
plt.show()
Output:
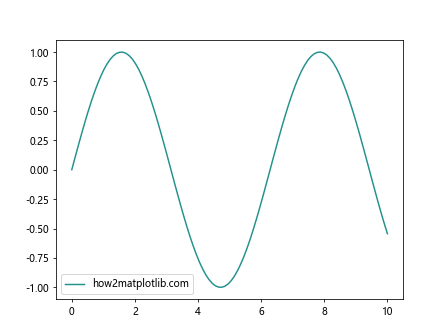
这个例子展示了如何使用颜色映射来设置线条颜色,并通过properties()方法查看结果。
11. properties()方法在高级可视化技术中的应用
properties()方法在创建高级可视化效果时也非常有用,它可以帮助我们精确控制复杂图形的各个组成部分。
11.1 在3D图形中的应用
import matplotlib.pyplot as plt
import numpy as np
from mpl_toolkits.mplot3d import Axes3D

fig = plt.figure()
ax = fig.add_subplot(111, projection='3d')

x = np.linspace(-5, 5, 100)
y = np.linspace(-5, 5, 100)
X, Y = np.meshgrid(x, y)
Z = np.sin(np.sqrt(X**2 + Y**2))

surface = ax.plot_surface(X, Y, Z, cmap='viridis')

print("3D surface properties:")
for key, value in surface.properties().items():
    print(f"{key}: {value}")

ax.text(0, 0, 0, 'how2matplotlib.com', ha='center')
plt.show()
Output:
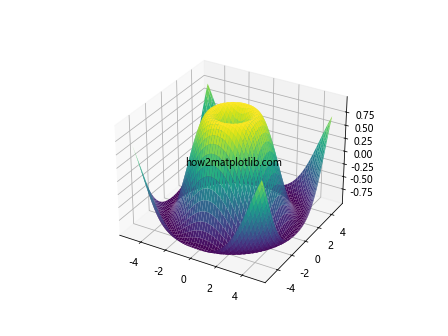
这个例子展示了如何在3D图形中使用properties()方法查看表面图的属性。
11.2 在极坐标图中的应用
import matplotlib.pyplot as plt
import numpy as np

fig, ax = plt.subplots(subplot_kw=dict(projection='polar'))

r = np.linspace(0, 1, 100)
theta = 2 * np.pi * r

line = ax.plot(theta, r)[0]

print("Polar plot line properties:")
for key, value in line.properties().items():
    print(f"{key}: {value}")

ax.text(0, 0.5, 'how2matplotlib.com', ha='center')
plt.show()
Output:
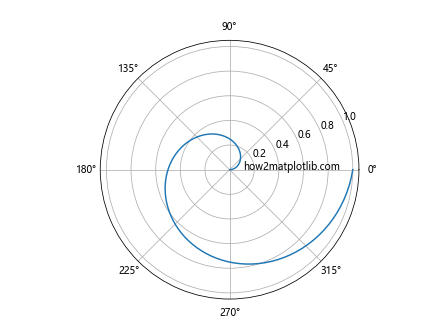
这个例子展示了如何在极坐标图中使用properties()方法查看线条的属性。
12. properties()方法在图形交互中的应用
properties()方法在创建交互式图形时也很有用,它可以帮助我们动态更新图形的属性。
import matplotlib.pyplot as plt
import numpy as np
from matplotlib.widgets import Slider

fig, ax = plt.subplots()
plt.subplots_adjust(bottom=0.25)

t = np.linspace(0, 1, 1000)
a0 = 5
f0 = 3
s = a0 * np.sin(2 * np.pi * f0 * t)

line, = plt.plot(t, s, lw=2)

ax_freq = plt.axes([0.25, 0.1, 0.65, 0.03])
freq_slider = Slider(ax_freq, 'Freq', 0.1, 30.0, valinit=f0)

def update(val):
    f = freq_slider.val
    line.set_ydata(a0 * np.sin(2 * np.pi * f * t))
    fig.canvas.draw_idle()
    print("Updated line properties:")
    print(f"Color: {line.properties()['color']}")
    print(f"Linewidth: {line.properties()['linewidth']}")

freq_slider.on_changed(update)

ax.text(0.5, 0, 'how2matplotlib.com', ha='center')
plt.show()
Output:
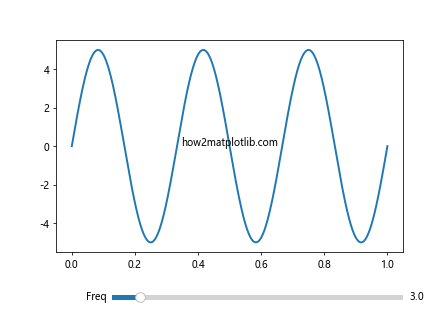
这个例子创建了一个带有滑块的交互式正弦波图形。每次滑块值改变时,我们都会更新图形并打印出线条的一些属性。
13. properties()方法在自定义Artist对象中的应用
如果你创建了自定义的Artist对象,你也可以实现properties()方法来提供对象属性的访问。
import matplotlib.pyplot as plt
import matplotlib.patches as mpatches

class CustomRectangle(mpatches.Rectangle):
    def __init__(self, *args, **kwargs):
        super().__init__(*args, **kwargs)
        self._custom_property = None

    @property
    def custom_property(self):
        return self._custom_property

    @custom_property.setter
    def custom_property(self, value):
        self._custom_property = value

    def properties(self):
        props = super().properties()
        props['custom_property'] = self._custom_property
        return props

fig, ax = plt.subplots()

custom_rect = CustomRectangle((0.2, 0.2), 0.6, 0.6, facecolor='red')
custom_rect.custom_property = 'how2matplotlib.com'

ax.add_patch(custom_rect)

print("Custom rectangle properties:")
for key, value in custom_rect.properties().items():
    print(f"{key}: {value}")

plt.show()
Output:
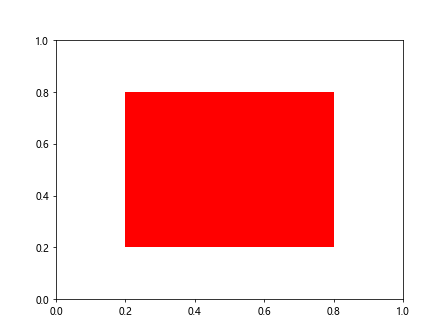
这个例子展示了如何创建一个自定义的Rectangle对象,并为其添加一个自定义属性。通过重写properties()方法,我们可以在属性字典中包含这个自定义属性。
14. 总结
Matplotlib的Artist.properties()方法是一个强大而灵活的工具,它允许我们查询和操作图形元素的所有属性。通过本文的探讨,我们了解了如何在各种场景下使用properties()方法,包括基本图形创建、自定义图形、动画、调试等。
properties()方法的主要优点包括:
- 提供了一种统一的方式来访问和修改Artist对象的属性。
- 便于调试和错误处理,可以快速查看对象的当前状态。
- 支持批量属性修改,提高了代码的效率和可读性。
- 在创建复杂的自定义图形时,提供了精确控制的能力。
然而,使用properties()方法时也需要注意一些潜在的陷阱:
- 返回的属性字典可能包含大量信息,需要谨慎处理以避免性能问题。
- 某些属性可能是只读的,直接修改可能会导致错误。
- 在处理大型数据集或复杂图形时,频繁调用properties()可能会影响性能。
总的来说,Matplotlib的Artist.properties()方法是一个强大的工具,能够帮助我们更好地理解和控制图形的各个方面。通过合理使用这个方法,我们可以创建更精确、更灵活的数据可视化效果,同时也能更有效地调试和优化我们的Matplotlib代码。
 极客教程
极客教程