Matplotlib中的Artist.remove_callback()方法:移除回调函数的完整指南
参考:Matplotlib.artist.Artist.remove_callback() in Python
Matplotlib是Python中最流行的数据可视化库之一,它提供了丰富的绘图功能和灵活的自定义选项。在Matplotlib的架构中,Artist对象扮演着重要的角色,它们是构建可视化图形的基本单元。本文将深入探讨Matplotlib中Artist类的一个重要方法:remove_callback()。我们将详细介绍这个方法的用途、使用方法以及在实际应用中的各种场景。
1. Artist对象简介
在深入了解remove_callback()方法之前,我们需要先简要了解Artist对象在Matplotlib中的角色。Artist是Matplotlib中所有可视元素的基类,包括图形、轴、线条、文本等。每个Artist对象都可以添加回调函数,这些回调函数在特定事件发生时被触发。
以下是一个简单的示例,展示了如何创建一个基本的Artist对象:
import matplotlib.pyplot as plt
from matplotlib.artist import Artist

fig, ax = plt.subplots()
artist = Artist()
ax.add_artist(artist)
plt.title("How to use Artist in Matplotlib - how2matplotlib.com")
plt.show()
Output:
在这个例子中,我们创建了一个空的Artist对象并将其添加到坐标轴中。虽然这个Artist没有可见的内容,但它展示了Artist对象的基本用法。
2. 回调函数的概念
回调函数是一种在特定事件发生时自动执行的函数。在Matplotlib中,我们可以为Artist对象添加回调函数,以响应诸如属性更改、绘图更新等事件。
下面是一个添加回调函数的简单示例:
import matplotlib.pyplot as plt
from matplotlib.artist import Artist

def my_callback(artist):
    print("Callback triggered for artist:", artist)

fig, ax = plt.subplots()
line, = ax.plot([1, 2, 3, 4], [1, 4, 2, 3], label="Data from how2matplotlib.com")
cid = line.add_callback(my_callback)

plt.title("Adding a callback to a Line2D artist - how2matplotlib.com")
plt.legend()
plt.show()
Output:
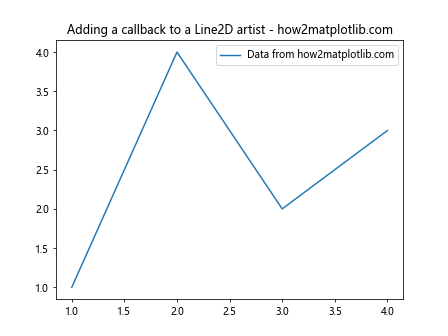
在这个例子中,我们为Line2D对象添加了一个简单的回调函数。每当线条的属性发生变化时,这个回调函数就会被触发。
3. remove_callback()方法的作用
remove_callback()方法是Artist类的一个重要方法,它用于移除之前添加到Artist对象的回调函数。当我们不再需要某个回调函数时,可以使用这个方法将其移除,以避免不必要的函数调用和潜在的性能问题。
以下是remove_callback()方法的基本语法:
Artist.remove_callback(oid)
其中,oid是添加回调函数时返回的回调ID。
4. 使用remove_callback()的基本示例
让我们通过一个简单的例子来演示如何使用remove_callback()方法:
import matplotlib.pyplot as plt
from matplotlib.artist import Artist

def callback1(artist):
    print("Callback 1 triggered for artist:", artist)

def callback2(artist):
    print("Callback 2 triggered for artist:", artist)

fig, ax = plt.subplots()
line, = ax.plot([1, 2, 3, 4], [1, 4, 2, 3], label="Data from how2matplotlib.com")

cid1 = line.add_callback(callback1)
cid2 = line.add_callback(callback2)

# 移除第一个回调函数
line.remove_callback(cid1)

plt.title("Removing a callback from a Line2D artist - how2matplotlib.com")
plt.legend()
plt.show()
Output:
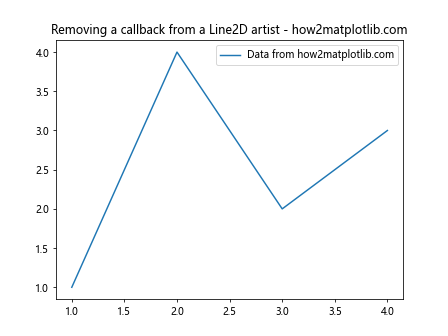
在这个例子中,我们首先添加了两个回调函数,然后使用remove_callback()方法移除了第一个回调函数。这样,只有第二个回调函数会在线条属性变化时被触发。
5. 回调函数的应用场景
回调函数在Matplotlib中有多种应用场景,下面我们将探讨几个常见的用例:
5.1 属性变化监控
回调函数可以用来监控Artist对象的属性变化。例如,我们可以在线条的颜色发生变化时触发一个回调函数:
import matplotlib.pyplot as plt

def color_change_callback(artist):
    print(f"Line color changed to: {artist.get_color()}")

fig, ax = plt.subplots()
line, = ax.plot([1, 2, 3, 4], [1, 4, 2, 3], color='blue', label="Data from how2matplotlib.com")

cid = line.add_callback(color_change_callback)

# 改变线条颜色
line.set_color('red')

plt.title("Monitoring color changes with callbacks - how2matplotlib.com")
plt.legend()
plt.show()

# 移除回调函数
line.remove_callback(cid)
Output:
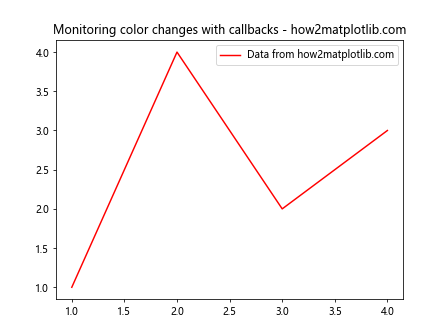
在这个例子中,我们添加了一个回调函数来监控线条颜色的变化。当我们调用set_color()方法时,回调函数会被触发并打印新的颜色。最后,我们使用remove_callback()方法移除了这个回调函数。
5.2 动态更新图表
回调函数也可以用于动态更新图表。例如,我们可以创建一个实时更新的折线图:
import matplotlib.pyplot as plt
import numpy as np

fig, ax = plt.subplots()
line, = ax.plot([], [], label="Real-time data from how2matplotlib.com")
ax.set_xlim(0, 100)
ax.set_ylim(-1, 1)

data = []

def update_line(artist):
    data.append(np.random.randn())
    line.set_data(range(len(data)), data)
    ax.relim()
    ax.autoscale_view()
    fig.canvas.draw()

cid = line.add_callback(update_line)

plt.title("Real-time data plotting with callbacks - how2matplotlib.com")
plt.legend()

# 模拟实时数据更新
for _ in range(100):
    plt.pause(0.1)

# 移除回调函数
line.remove_callback(cid)

plt.show()
Output:
在这个例子中,我们使用回调函数来实时更新折线图。每次回调函数被触发时,都会添加一个新的数据点并重新绘制图表。最后,我们使用remove_callback()方法停止更新。
6. 多个回调函数的管理
在复杂的应用中,我们可能需要为一个Artist对象添加多个回调函数。这时,有效地管理这些回调函数就变得非常重要。以下是一个管理多个回调函数的示例:
import matplotlib.pyplot as plt

def callback1(artist):
    print("Callback 1: Line color is", artist.get_color())

def callback2(artist):
    print("Callback 2: Line style is", artist.get_linestyle())

def callback3(artist):
    print("Callback 3: Line width is", artist.get_linewidth())

fig, ax = plt.subplots()
line, = ax.plot([1, 2, 3, 4], [1, 4, 2, 3], color='blue', linestyle='--', linewidth=2, label="Data from how2matplotlib.com")

callbacks = []
callbacks.append(line.add_callback(callback1))
callbacks.append(line.add_callback(callback2))
callbacks.append(line.add_callback(callback3))

# 触发所有回调函数
line.set_color('red')
line.set_linestyle(':')
line.set_linewidth(3)

# 移除所有回调函数
for cid in callbacks:
    line.remove_callback(cid)

plt.title("Managing multiple callbacks - how2matplotlib.com")
plt.legend()
plt.show()
Output:
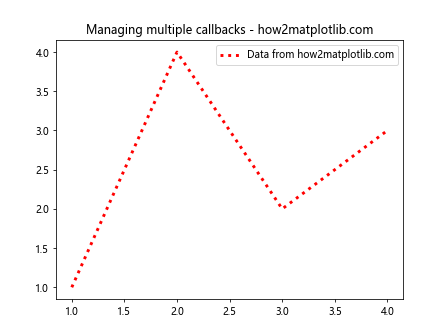
在这个例子中,我们为一个线条对象添加了三个不同的回调函数,分别监控颜色、线型和线宽的变化。我们将所有回调ID存储在一个列表中,这样可以方便地管理和移除这些回调函数。
7. 回调函数的性能考虑
虽然回调函数是一个强大的工具,但过度使用可能会影响性能。每次触发回调函数都会带来一定的计算开销,特别是在处理大量数据或频繁更新的情况下。因此,合理使用remove_callback()方法来移除不再需要的回调函数是很重要的。
以下是一个展示如何在适当的时候移除回调函数的例子:
import matplotlib.pyplot as plt
import numpy as np

fig, ax = plt.subplots()
line, = ax.plot([], [], label="Data from how2matplotlib.com")
ax.set_xlim(0, 100)
ax.set_ylim(-1, 1)

data = []

def update_line(artist):
    data.append(np.random.randn())
    line.set_data(range(len(data)), data)
    ax.relim()
    ax.autoscale_view()
    fig.canvas.draw()

    # 当数据点达到100个时,移除回调函数
    if len(data) >= 100:
        line.remove_callback(cid)
        print("Callback removed after 100 data points")

cid = line.add_callback(update_line)

plt.title("Removing callback after certain condition - how2matplotlib.com")
plt.legend()

for _ in range(150):
    plt.pause(0.1)

plt.show()
Output:

在这个例子中,我们设置了一个条件:当数据点达到100个时,自动移除回调函数。这样可以避免在不需要更新的情况下继续触发回调函数,从而提高性能。
8. 错误处理和调试
在使用remove_callback()方法时,可能会遇到一些常见的错误。了解这些错误并知道如何处理它们是很重要的。以下是一些常见错误及其处理方法:
8.1 无效的回调ID
如果尝试移除一个不存在的回调函数,Matplotlib不会抛出异常,但也不会执行任何操作。为了避免这种情况,我们可以在移除回调函数之前先检查它是否存在:
import matplotlib.pyplot as plt

def my_callback(artist):
    print("Callback triggered")

fig, ax = plt.subplots()
line, = ax.plot([1, 2, 3, 4], [1, 4, 2, 3], label="Data from how2matplotlib.com")

cid = line.add_callback(my_callback)

# 检查回调函数是否存在
if cid in line.callbacks:
    line.remove_callback(cid)
    print("Callback removed successfully")
else:
    print("Callback not found")

plt.title("Handling invalid callback IDs - how2matplotlib.com")
plt.legend()
plt.show()
这个例子展示了如何在移除回调函数之前检查它是否存在,从而避免潜在的错误。
8.2 重复移除回调函数
重复移除同一个回调函数不会导致错误,但这可能表明代码逻辑存在问题。我们可以使用一个标志来跟踪回调函数的状态:
import matplotlib.pyplot as plt

def my_callback(artist):
    print("Callback triggered")

fig, ax = plt.subplots()
line, = ax.plot([1, 2, 3, 4], [1, 4, 2, 3], label="Data from how2matplotlib.com")

cid = line.add_callback(my_callback)
callback_active = True

def remove_callback_safely():
    global callback_active
    if callback_active:
        line.remove_callback(cid)
        callback_active = False
        print("Callback removed")
    else:
        print("Callback already removed")

# 第一次移除
remove_callback_safely()

# 尝试再次移除
remove_callback_safely()

plt.title("Avoiding duplicate callback removal - how2matplotlib.com")
plt.legend()
plt.show()
Output:
这个例子使用了一个全局标志来跟踪回调函数的状态,避免重复移除同一个回调函数。
9. 高级应用:自定义Artist类
在某些情况下,我们可能需要创建自定义的Artist类,并为其实现回调功能。以下是一个简单的例子,展示如何创建一个自定义Artist类并实现回调机制:
import matplotlib.pyplot as plt
from matplotlib.artist import Artist

class MyCustomArtist(Artist):
    def __init__(self):
        super().__init__()
        self.x = 0
        self.y = 0

    def set_position(self, x, y):
        self.x = x
        self.y = y
        self.stale = True  # 标记Artist需要重绘
        self.pchanged()  # 触发回调函数

    def draw(self, renderer):
        # 简单地在给定位置绘制一个点
        renderer.draw_marker(self.x, self.y, 'o')

fig, ax = plt.subplots()
custom_artist = MyCustomArtist()
ax.add_artist(custom_artist)

def position_callback(artist):
    print(f"Position changed to ({artist.x}, {artist.y})")

cid = custom_artist.add_callback(position_callback)

custom_artist.set_position(0.5, 0.5)
custom_artist.set_position(0.7, 0.3)

# 移除回调函数
custom_artist.remove_callback(cid)

plt.title("Custom Artist with callbacks - how2matplotlib.com")
plt.xlim(0, 1)
plt.ylim(0, 1)
plt.show()
在这个例子中,我们创建了一个自定义的Artist类MyCustomArtist,它可以在画布上绘制一个点。我们为这个类实现了set_position方法,每次位置改变时都会触发回调函数。这展示了如何在自定义Artist类中集成回调机制。
10. 与其他Matplotlib功能的集成
remove_callback()方法可以与Matplotlib的其他功能无缝集成,以创建更复杂和交互性更强的可视化。以下是一些集成的例子:
10.1 与动画功能集成
我们可以将回调函数与Matplotlib的动画功能结合使用,创建动态的可视化效果:
import matplotlib.pyplot as plt
import matplotlib.animation as animation
import numpy as np

fig, ax = plt.subplots()
line, = ax.plot([], [], label="Animated data from how2matplotlib.com")
ax.set_xlim(0, 100)
ax.set_ylim(-1, 1)

data = []

def update(frame):
    data.append(np.random.randn())
    line.set_data(range(len(data)), data)
    return line,

def animation_callback(artist):
    if len(data) >= 100:
        anim.event_source.stop()
        artist.remove_callback(cid)
        print("Animation stopped and callback removed")

cid = line.add_callback(animation_callback)

anim = animation.FuncAnimation(fig, update, frames=200, interval=50, blit=True)

plt.title("Animation with callback - how2matplotlib.com")
plt.legend()
plt.show()
Output:
在这个例子中,我们使用animation.FuncAnimation创建了一个动画,并添加了一个回调函数来在特定条件下停止动画并移除自身。
10.2 与事件处理系统集成
Matplotlib的事件处理系统也可以与回调函数结合使用,创建交互式的可视化:
import matplotlib.pyplot as plt

fig, ax = plt.subplots()
line, = ax.plot([1, 2, 3, 4], [1, 4, 2, 3], label="Interactive data from how2matplotlib.com")

def on_click(event):
    if event.inaxes == ax:
        line.set_ydata([y + 0.1 for y in line.get_ydata()])
        fig.canvas.draw()

def click_callback(artist):
    print("Line data updated")

cid = line.add_callback(click_callback)

fig.canvas.mpl_connect('button_press_event', on_click)

plt.title("Interactive plot with callbacks - how2matplotlib.com")
plt.legend()
plt.show()

# 在适当的时候移除回调函数
line.remove_callback(cid)
Output:
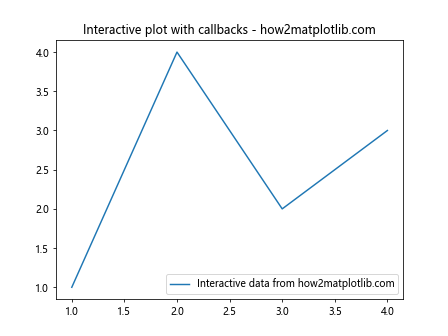
这个例子展示了如何将鼠标点击事件与回调函数结合使用。每次点击图表时,线条数据都会更新,并触发回调函数。
11. 性能优化技巧
在使用回调函数时,特别是在处理大量数据或频繁更新的情况下,性能可能会成为一个问题。以下是一些优化建议:
11.1 使用防抖动(Debouncing)
当回调函数可能被频繁触发时,可以使用防抖动技术来限制回调函数的执行频率:
import matplotlib.pyplot as plt
from functools import wraps
from time import time

def debounce(wait):
    def decorator(fn):
        last_called = [0]
        @wraps(fn)
        def debounced(*args, **kwargs):
            now = time()
            if now - last_called[0] >= wait:
                last_called[0] = now
                return fn(*args, **kwargs)
        return debounced
    return decorator

fig, ax = plt.subplots()
line, = ax.plot([1, 2, 3, 4], [1, 4, 2, 3], label="Data from how2matplotlib.com")

@debounce(0.5)  # 500ms的防抖动
def update_callback(artist):
    print("Callback executed")

cid = line.add_callback(update_callback)

# 模拟频繁更新
for _ in range(10):
    line.set_ydata([y + 0.1 for y in line.get_ydata()])
    plt.pause(0.1)

line.remove_callback(cid)

plt.title("Debounced callbacks for performance - how2matplotlib.com")
plt.legend()
plt.show()
Output:
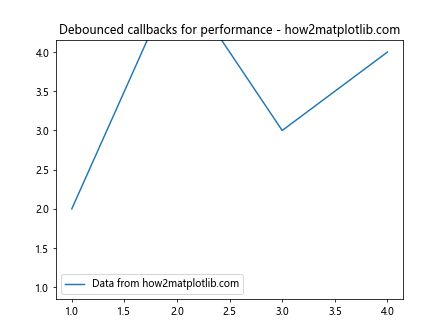
这个例子使用了一个简单的防抖动装饰器,确保回调函数在短时间内只执行一次,从而提高性能。
11.2 批量更新
对于需要频繁更新的图表,可以考虑批量更新而不是每次变化都触发回调:
import matplotlib.pyplot as plt
import numpy as np

fig, ax = plt.subplots()
line, = ax.plot([], [], label="Batch updated data from how2matplotlib.com")
ax.set_xlim(0, 100)
ax.set_ylim(-1, 1)

data = []
update_interval = 10

def batch_update(artist):
    global data
    new_data = np.random.randn(update_interval)
    data.extend(new_data)
    line.set_data(range(len(data)), data)
    ax.relim()
    ax.autoscale_view()
    fig.canvas.draw()

cid = line.add_callback(batch_update)

for _ in range(10):
    plt.pause(1)
    batch_update(line)

line.remove_callback(cid)

plt.title("Batch updates for improved performance - how2matplotlib.com")
plt.legend()
plt.show()
这个例子展示了如何使用批量更新来减少回调函数的触发次数,从而提高性能。
12. 最佳实践和注意事项
在使用remove_callback()方法和处理回调函数时,以下是一些最佳实践和注意事项:
- 始终保存回调ID:当添加回调函数时,务必保存返回的回调ID,以便后续可以正确移除回调函数。
-
及时移除不需要的回调:当不再需要某个回调函数时,立即使用
remove_callback()方法将其移除,以避免不必要的函数调用和潜在的内存泄漏。 -
避免在回调函数中执行耗时操作:回调函数应该尽可能简单和快速,避免在其中执行复杂的计算或I/O操作。
-
使用适当的错误处理:在移除回调函数时,考虑添加错误处理机制,以应对可能的异常情况。
-
注意回调函数的作用域:确保回调函数在需要的时候仍然可访问,特别是在使用闭包或类方法作为回调时。
-
考虑使用弱引用:在某些情况下,使用弱引用可以避免循环引用问题,特别是在长时间运行的应用中。
-
定期审查和清理:在复杂的应用中,定期审查和清理不再需要的回调函数可以帮助维护代码的整洁性和效率。
结论
Matplotlib的Artist.remove_callback()方法是一个强大而灵活的工具,它允许我们动态地管理Artist对象的回调函数。通过本文的详细介绍和丰富的示例,我们深入探讨了这个方法的使用方式、应用场景以及与其他Matplotlib功能的集成。从基本用法到高级应用,从性能优化到最佳实践,我们全面覆盖了remove_callback()方法的各个方面。
掌握remove_callback()方法不仅可以帮助我们创建更加动态和交互性的可视化,还能确保我们的Matplotlib应用保持高效和可维护。通过合理地添加和移除回调函数,我们可以构建出既灵活又高效的数据可视化解决方案。
在实际应用中,请记住根据具体需求和场景选择适当的回调管理策略,并始终关注性能和代码质量。随着对Matplotlib的深入理解和使用,你将能够创建出更加复杂和精细的可视化效果,充分发挥这个强大库的潜力。
 极客教程
极客教程