Matplotlib中的Artist.add_callback()方法:动态交互绘图的关键
参考:Matplotlib.artist.Artist.add_callback() in Python
Matplotlib是Python中最流行的数据可视化库之一,它提供了丰富的绘图功能和灵活的自定义选项。在Matplotlib的架构中,Artist是一个重要的概念,它代表了图形中的各种可视元素。而Artist类的add_callback()方法则为我们提供了一种强大的机制,使得我们可以在运行时动态地响应Artist属性的变化,从而实现交互式的图形绘制和更新。本文将深入探讨Artist.add_callback()方法的使用,并通过多个示例来展示其在实际应用中的潜力。
1. Artist.add_callback()方法简介
Artist.add_callback()方法是Matplotlib库中Artist类的一个重要方法。它允许我们为Artist对象添加回调函数,这些回调函数会在Artist的特定属性发生变化时被自动调用。这为我们创建动态和交互式的图形提供了强大的支持。
1.1 方法签名
Artist.add_callback(func)
其中,func是一个回调函数,它应该接受两个参数:artist对象本身和一个描述变化的事件对象。
1.2 基本用法示例
让我们从一个简单的例子开始,了解add_callback()方法的基本用法:
import matplotlib.pyplot as plt

def on_change(artist, event):
    print(f"Artist {artist} changed: {event}")

fig, ax = plt.subplots()
line, = ax.plot([1, 2, 3], [1, 2, 3], label='how2matplotlib.com')
line.add_callback(on_change)

line.set_color('red')
plt.show()
Output:
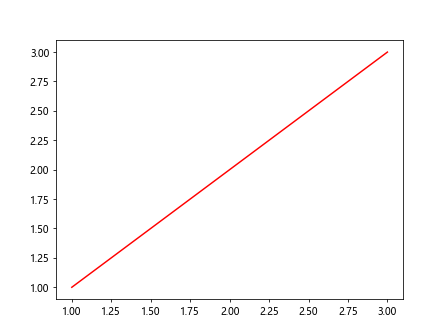
在这个例子中,我们创建了一个简单的线图,并为线条对象添加了一个回调函数。当我们改变线条的颜色时,回调函数会被触发,打印出变化的信息。
2. 回调函数的设计
设计好的回调函数是使用add_callback()方法的关键。回调函数应该能够适当地处理Artist对象的变化,并执行相应的操作。
2.1 回调函数参数
回调函数通常接受两个参数:
- artist:发生变化的Artist对象
- event:描述变化的事件对象
2.2 回调函数示例
以下是一个更复杂的回调函数示例:
import matplotlib.pyplot as plt
import numpy as np

def update_plot(artist, event):
    if event.startswith('set_'):
        attribute = event[4:]
        value = getattr(artist, f'get_{attribute}')()
        print(f"how2matplotlib.com - {attribute} changed to {value}")
        if attribute == 'data':
            x, y = value
            artist.axes.set_xlim(np.min(x), np.max(x))
            artist.axes.set_ylim(np.min(y), np.max(y))
            artist.figure.canvas.draw_idle()

fig, ax = plt.subplots()
line, = ax.plot([1, 2, 3], [1, 2, 3], label='how2matplotlib.com')
line.add_callback(update_plot)

line.set_data([0, 1, 2, 3, 4], [0, 1, 4, 9, 16])
plt.show()
Output:
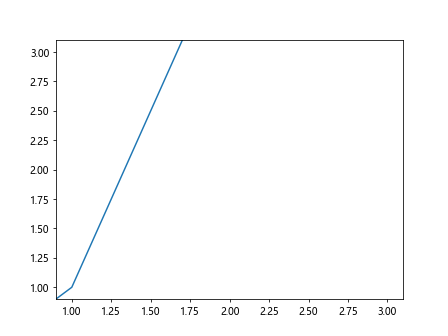
这个例子中的回调函数不仅打印了变化的信息,还根据数据的变化自动调整了坐标轴的范围。
3. 监控多个属性
add_callback()方法的一个强大特性是它可以监控Artist对象的多个属性。我们可以为不同的属性添加不同的回调函数,或者使用同一个回调函数来处理多个属性的变化。
3.1 为多个属性添加回调
import matplotlib.pyplot as plt

def on_color_change(artist, event):
    print(f"how2matplotlib.com - Color changed to {artist.get_color()}")

def on_linewidth_change(artist, event):
    print(f"how2matplotlib.com - Line width changed to {artist.get_linewidth()}")

fig, ax = plt.subplots()
line, = ax.plot([1, 2, 3], [1, 2, 3], label='how2matplotlib.com')

line.add_callback(on_color_change)
line.add_callback(on_linewidth_change)

line.set_color('red')
line.set_linewidth(2)
plt.show()
Output:
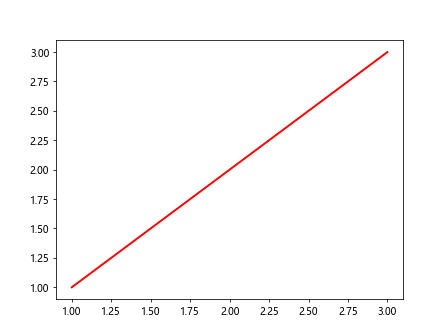
在这个例子中,我们为线条的颜色和线宽分别添加了回调函数。
3.2 使用通用回调函数
import matplotlib.pyplot as plt

def on_any_change(artist, event):
    if event.startswith('set_'):
        attribute = event[4:]
        value = getattr(artist, f'get_{attribute}')()
        print(f"how2matplotlib.com - {attribute} changed to {value}")

fig, ax = plt.subplots()
line, = ax.plot([1, 2, 3], [1, 2, 3], label='how2matplotlib.com')

line.add_callback(on_any_change)

line.set_color('red')
line.set_linewidth(2)
line.set_linestyle('--')
plt.show()
Output:
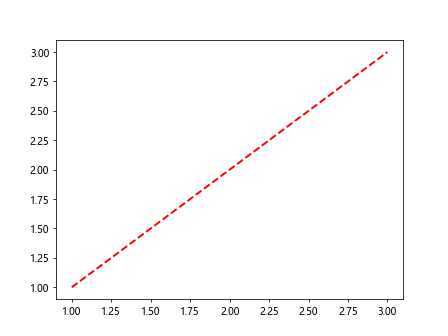
这个例子使用了一个通用的回调函数来处理多种属性的变化。
4. 动态更新图形
add_callback()方法的一个重要应用是实现图形的动态更新。通过在回调函数中修改Artist对象的属性,我们可以创建随时间变化或响应用户输入的动态图形。
4.1 随时间变化的动画
import matplotlib.pyplot as plt
import numpy as np
from matplotlib.animation import FuncAnimation

def update(frame):
    x = np.linspace(0, 2*np.pi, 100)
    y = np.sin(x + frame/10)
    line.set_data(x, y)
    return line,

def on_data_change(artist, event):
    if event == 'set_data':
        x, y = artist.get_data()
        artist.axes.set_ylim(np.min(y)-0.1, np.max(y)+0.1)
        print(f"how2matplotlib.com - Data updated, new y-range: {artist.axes.get_ylim()}")

fig, ax = plt.subplots()
line, = ax.plot([], [], label='how2matplotlib.com')
line.add_callback(on_data_change)

ax.set_xlim(0, 2*np.pi)
ax.set_ylim(-1.1, 1.1)

ani = FuncAnimation(fig, update, frames=200, interval=50, blit=True)
plt.show()
这个例子创建了一个随时间变化的正弦波动画,并使用回调函数动态调整y轴的范围。
4.2 响应用户输入的交互式图形
import matplotlib.pyplot as plt
from matplotlib.widgets import Slider

def update(val):
    freq = slider.val
    t = np.linspace(0, 1, 1000)
    y = np.sin(2 * np.pi * freq * t)
    line.set_data(t, y)
    fig.canvas.draw_idle()

def on_data_change(artist, event):
    if event == 'set_data':
        _, y = artist.get_data()
        artist.axes.set_ylim(np.min(y)-0.1, np.max(y)+0.1)
        print(f"how2matplotlib.com - Y-axis range updated: {artist.axes.get_ylim()}")

fig, (ax, ax_slider) = plt.subplots(2, 1, figsize=(8, 6), height_ratios=[3, 1])
t = np.linspace(0, 1, 1000)
line, = ax.plot(t, np.sin(2*np.pi*t), label='how2matplotlib.com')
line.add_callback(on_data_change)

ax.set_xlim(0, 1)
ax.set_ylim(-1.1, 1.1)

slider = Slider(ax_slider, 'Frequency', 0.1, 10.0, valinit=1)
slider.on_changed(update)

plt.show()
这个例子创建了一个带有滑动条的交互式图形,用户可以通过滑动条调整正弦波的频率,而回调函数会自动调整y轴的范围。
5. 处理复杂的Artist对象
到目前为止,我们主要关注了简单的线条对象。但是,add_callback()方法可以应用于任何Artist对象,包括更复杂的对象如散点图、柱状图等。
5.1 散点图的动态更新
import matplotlib.pyplot as plt
import numpy as np

def update_scatter(artist, event):
    if event == 'set_offsets':
        offsets = artist.get_offsets()
        x, y = offsets[:, 0], offsets[:, 1]
        artist.axes.set_xlim(np.min(x)-1, np.max(x)+1)
        artist.axes.set_ylim(np.min(y)-1, np.max(y)+1)
        print(f"how2matplotlib.com - Scatter plot updated, new ranges: x={artist.axes.get_xlim()}, y={artist.axes.get_ylim()}")

fig, ax = plt.subplots()
scatter = ax.scatter([], [], label='how2matplotlib.com')
scatter.add_callback(update_scatter)

for i in range(5):
    new_data = np.random.rand(20, 2) * 10
    scatter.set_offsets(new_data)
    plt.pause(1)

plt.show()
Output:
这个例子展示了如何使用add_callback()方法来动态更新散点图,并自动调整坐标轴的范围。
5.2 柱状图的动态更新
import matplotlib.pyplot as plt
import numpy as np

def update_bar(artist, event):
    if event == 'set_height':
        heights = [rect.get_height() for rect in artist]
        artist[0].axes.set_ylim(0, max(heights) * 1.1)
        print(f"how2matplotlib.com - Bar heights updated, new y-range: {artist[0].axes.get_ylim()}")

fig, ax = plt.subplots()
x = np.arange(5)
heights = np.random.rand(5) * 10
bars = ax.bar(x, heights, label='how2matplotlib.com')

for bar in bars:
    bar.add_callback(update_bar)

for i in range(5):
    new_heights = np.random.rand(5) * 10
    for bar, h in zip(bars, new_heights):
        bar.set_height(h)
    plt.pause(1)

plt.show()
Output:
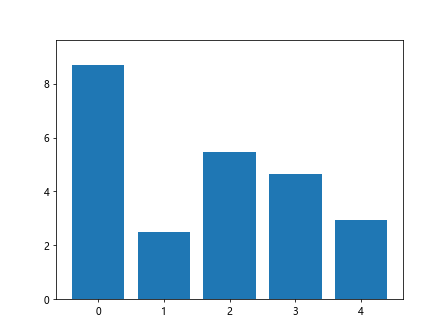
这个例子展示了如何使用add_callback()方法来动态更新柱状图,并自动调整y轴的范围。
6. 结合其他Matplotlib功能
add_callback()方法可以与Matplotlib的其他功能结合使用,以创建更复杂和强大的可视化效果。
6.1 结合颜色映射
import matplotlib.pyplot as plt
import numpy as np

def update_colormap(artist, event):
    if event == 'set_array':
        array = artist.get_array()
        artist.set_clim(np.min(array), np.max(array))
        print(f"how2matplotlib.com - Colormap updated, new range: {artist.get_clim()}")

fig, ax = plt.subplots()
x, y = np.meshgrid(np.linspace(-2, 2, 100), np.linspace(-2, 2, 100))
z = np.sin(x) * np.cos(y)

im = ax.imshow(z, cmap='viridis', label='how2matplotlib.com')
im.add_callback(update_colormap)

plt.colorbar(im)

for i in range(5):
    new_z = np.sin(x + i/2) * np.cos(y + i/2)
    im.set_array(new_z)
    plt.pause(1)

plt.show()
Output:
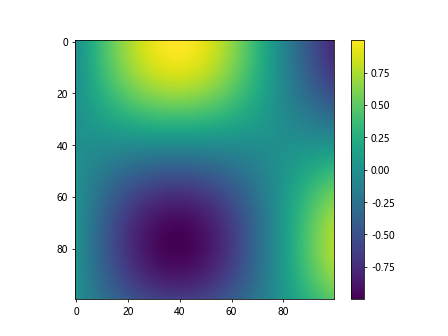
这个例子展示了如何使用add_callback()方法来动态更新颜色映射,并自动调整颜色范围。
6.2 结合3D图形
import matplotlib.pyplot as plt
from mpl_toolkits.mplot3d import Axes3D
import numpy as np

def update_surface(artist, event):
    if event == 'set_array':
        array = artist.get_array()
        artist.set_clim(np.min(array), np.max(array))
        z = artist.get_array().reshape(artist._A.shape)
        artist.axes.set_zlim(np.min(z), np.max(z))
        print(f"how2matplotlib.com - Surface updated, new z-range: {artist.axes.get_zlim()}")

fig = plt.figure()
ax = fig.add_subplot(111, projection='3d')

x = y = np.linspace(-3, 3, 100)
X, Y = np.meshgrid(x, y)
Z = np.sin(np.sqrt(X**2 + Y**2))

surf = ax.plot_surface(X, Y, Z, cmap='viridis', label='how2matplotlib.com')
surf.add_callback(update_surface)

for i in range(5):
    new_Z = np.sin(np.sqrt(X**2 + Y**2) + i/2)
    surf.set_array(new_Z.ravel())
    plt.pause(1)

plt.show()
Output:
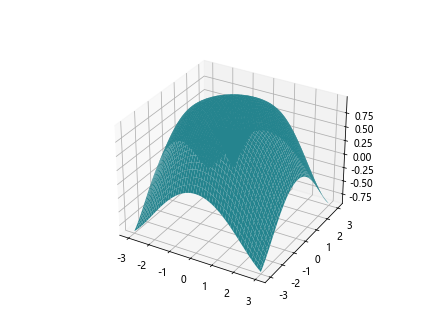
这个例子展示了如何使用add_callback()方法来动态更新3D表面图,并自动调整z轴和颜色范围。
7. 性能考虑
虽然add_callback()方法提供了强大的功能,但在使用时也需要考虑性能问题。频繁调用回调函数可能会影响程序的性能,特别是在处理大量数据或复杂图形时。
7.1 优化回调函数
import matplotlib.pyplot as plt
import numpy as np
import time

def optimized_callback(artist, event):
    if event == 'set_data':
        x, y = artist.get_data()
        if len(x) > 1000:  # 只在数据量大时更新
            artist.axes.set_xlim(np.min(x), np.max(x))
            artist.axes.set_ylim(np.min(y), np.max(y))
            print(f"how2matplotlib.com - Axes limits updated for large dataset")

fig, ax = plt.subplots()
line, = ax.plot([], [], label='how2matplotlib.com')
line.add_callback(optimized_callback)

for i in range(10):
    x = np.linspace(0, 10, 100 * (i + 1))
    y = np.sin(x) * np.exp(-x/10)
    start_time = time.time()
    line.set_data(x, y)
    end_time = time.time()
    print(f"Update time: {end_time - start_time:.4f} seconds")
    plt.pause(0.1)

plt.show()
Output:
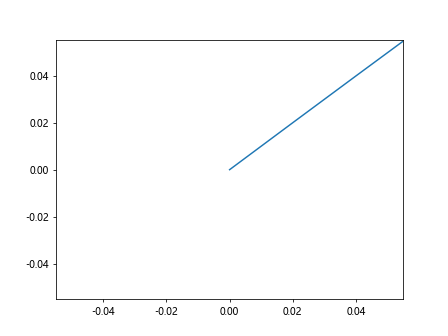
这个例子展示了如何优化回调函数,只在处理大量数据时执行耗时操作。
7.2 使用防抖动技术
import matplotlib.pyplot as plt
import numpy as np
from functools import wraps
import time

def debounce(wait):
    def decorator(fn):
        last_called = [0]
        @wraps(fn)
        def debounced(*args, **kwargs):
            now = time.time()
            if now - last_called[0] >= wait:
                last_called[0] = now
                return fn(*args, **kwargs)
        return debounced
    return decorator

@debounce(0.5)
def update_plot(artist, event):
    if event == 'set_data':
        x, y = artist.get_data()
        artist.axes.set_xlim(np.min(x), np.max(x))
        artist.axes.set_ylim(np.min(y), np.max(y))
        print(f"how2matplotlib.com - Plot updated")

fig, ax = plt.subplots()
line, = ax.plot([], [], label='how2matplotlib.com')
line.add_callback(update_plot)

for i in range(20):
    x = np.linspace(0, 10, 100)
    y = np.sin(x + i/5) * np.exp(-x/10)
    line.set_data(x, y)
    plt.pause(0.1)

plt.show()
Output:
这个例子使用了防抖动技术来限制回调函数的调用频率,避免过于频繁的更新。
8. 错误处理和调试
在使用add_callback()方法时,适当的错误处理和调试技巧可以帮助我们更好地管理回调函数。
8.1 异常处理
import matplotlib.pyplot as plt
import numpy as np

def safe_callback(artist, event):
    try:
        if event == 'set_data':
            x, y = artist.get_data()
            artist.axes.set_xlim(np.min(x), np.max(x))
            artist.axes.set_ylim(np.min(y), np.max(y))
            print(f"how2matplotlib.com - Plot updated successfully")
    except Exception as e:
        print(f"how2matplotlib.com - Error in callback: {str(e)}")

fig, ax = plt.subplots()
line, = ax.plot([], [], label='how2matplotlib.com')
line.add_callback(safe_callback)

# 正常更新
line.set_data([1, 2, 3], [1, 2, 3])

# 触发错误
line.set_data([1, 2, 3], [1, 2])  # 不匹配的数据长度

plt.show()
这个例子展示了如何在回调函数中使用异常处理来捕获和报告错误。
8.2 调试技巧
import matplotlib.pyplot as plt
import numpy as np
import logging

logging.basicConfig(level=logging.DEBUG)
logger = logging.getLogger('matplotlib_callback')

def debug_callback(artist, event):
    logger.debug(f"how2matplotlib.com - Callback triggered for event: {event}")
    if event == 'set_data':
        x, y = artist.get_data()
        logger.info(f"how2matplotlib.com - New data: x={x[:5]}..., y={y[:5]}...")
        artist.axes.set_xlim(np.min(x), np.max(x))
        artist.axes.set_ylim(np.min(y), np.max(y))
        logger.info(f"how2matplotlib.com - New limits: xlim={artist.axes.get_xlim()}, ylim={artist.axes.get_ylim()}")

fig, ax = plt.subplots()
line, = ax.plot([], [], label='how2matplotlib.com')
line.add_callback(debug_callback)

for i in range(5):
    x = np.linspace(0, 10, 100)
    y = np.sin(x + i/2)
    line.set_data(x, y)
    plt.pause(0.5)

plt.show()
这个例子展示了如何使用日志记录来调试回调函数,跟踪事件触发和数据更新。
9. 高级应用
add_callback()方法的灵活性使其可以应用于各种高级场景。
9.1 多图联动
import matplotlib.pyplot as plt
import numpy as np

def update_other_plot(artist, event, other_artist):
    if event == 'set_data':
        x, y = artist.get_data()
        other_artist.set_data(x, np.cumsum(y))
        other_artist.axes.relim()
        other_artist.axes.autoscale_view()
        print(f"how2matplotlib.com - Secondary plot updated")

fig, (ax1, ax2) = plt.subplots(2, 1, figsize=(8, 8))
line1, = ax1.plot([], [], label='Original - how2matplotlib.com')
line2, = ax2.plot([], [], label='Cumulative - how2matplotlib.com')

line1.add_callback(lambda artist, event: update_other_plot(artist, event, line2))

for i in range(5):
    x = np.linspace(0, 10, 100)
    y = np.sin(x + i/2)
    line1.set_data(x, y)
    ax1.relim()
    ax1.autoscale_view()
    plt.pause(0.5)

plt.show()
Output:
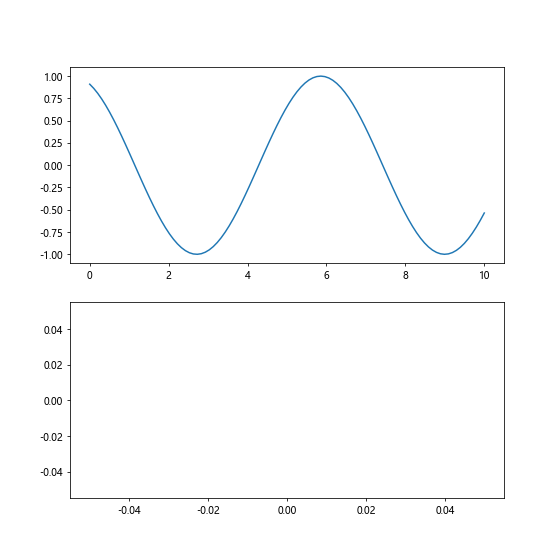
这个例子展示了如何使用add_callback()方法来实现多个图表之间的联动更新。
9.2 自定义交互
import matplotlib.pyplot as plt
import numpy as np
from matplotlib.widgets import Button

def update_plot(event):
    x = np.linspace(0, 10, 100)
    y = np.sin(x * np.random.rand())
    line.set_data(x, y)
    ax.relim()
    ax.autoscale_view()
    fig.canvas.draw_idle()

def on_data_change(artist, event):
    if event == 'set_data':
        print(f"how2matplotlib.com - Plot data updated")

fig, ax = plt.subplots()
line, = ax.plot([], [], label='how2matplotlib.com')
line.add_callback(on_data_change)

ax_button = plt.axes([0.81, 0.05, 0.1, 0.075])
button = Button(ax_button, 'Update')
button.on_clicked(update_plot)

plt.show()
Output:
这个例子展示了如何结合使用add_callback()方法和自定义交互控件(如按钮)来创建交互式图表。
10. 总结
Matplotlib的Artist.add_callback()方法为创建动态和交互式图表提供了强大的工具。通过本文的详细介绍和多个示例,我们探索了该方法的各种应用场景,从基本用法到高级技巧。这些包括:
- 基本的回调函数设计和使用
- 监控多个属性的变化
- 创建动态更新的图形和动画
- 处理复杂的Artist对象,如散点图和柱状图
- 结合其他Matplotlib功能,如颜色映射和3D图形
- 性能优化技巧
- 错误处理和调试方法
- 高级应用,如多图联动和自定义交互
通过掌握add_callback()方法,开发者可以创建更加灵活和响应式的数据可视化应用。这不仅能够提升用户体验,还能够帮助我们更好地理解和分析动态变化的数据。
在实际应用中,合理使用add_callback()方法可以大大增强Matplotlib图表的交互性和动态性。然而,也要注意平衡功能和性能,确保在实现复杂交互的同时保持良好的运行效率。随着对该方法的深入理解和熟练应用,我们可以充分发挥Matplotlib的潜力,创造出更加丰富和有意义的数据可视化作品。
 极客教程
极客教程