Matplotlib中的Artist.axes属性:深入理解和应用
参考:Matplotlib.artist.Artist.axes in Python
Matplotlib是Python中最流行的数据可视化库之一,它提供了丰富的绘图功能和灵活的自定义选项。在Matplotlib的架构中,Artist类是一个核心概念,它是所有可视化元素的基类。而Artist.axes属性则是连接Artist对象和其所属Axes对象的重要纽带。本文将深入探讨Matplotlib中的Artist.axes属性,包括其定义、用途、应用场景以及相关的实践技巧。
1. Artist.axes属性概述
Artist.axes属性是Matplotlib中Artist类的一个重要属性。它返回包含该Artist对象的Axes实例。通过这个属性,我们可以访问和操作与特定Artist对象相关联的Axes对象。
让我们从一个简单的例子开始:
import matplotlib.pyplot as plt

fig, ax = plt.subplots()
line, = ax.plot([1, 2, 3, 4], [1, 4, 2, 3], label='Data from how2matplotlib.com')

print(line.axes)
plt.show()
Output:
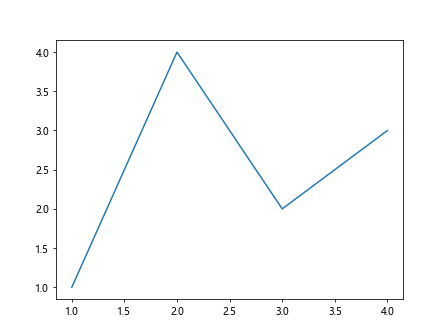
在这个例子中,我们创建了一个简单的线图。line对象是一个Line2D实例,它继承自Artist类。通过line.axes,我们可以访问包含这条线的Axes对象。
2. Artist.axes属性的作用
Artist.axes属性的主要作用包括:
- 获取Artist对象所属的Axes实例
- 在不直接引用Axes对象的情况下修改Axes的属性
- 在自定义Artist类时确定其所属的Axes
让我们通过一个例子来说明这些作用:
import matplotlib.pyplot as plt

fig, ax = plt.subplots()
scatter = ax.scatter([1, 2, 3, 4], [1, 4, 2, 3], label='Scatter from how2matplotlib.com')

# 获取scatter对象所属的Axes实例
axes = scatter.axes

# 修改Axes的标题
axes.set_title('Data from how2matplotlib.com')

# 修改Axes的x轴标签
axes.set_xlabel('X-axis')

plt.show()
Output:
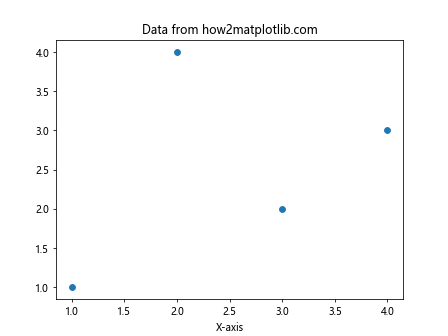
在这个例子中,我们通过scatter对象的axes属性获取了Axes实例,然后使用这个实例来修改图表的标题和x轴标签。
3. Artist.axes属性在自定义Artist中的应用
当我们创建自定义的Artist类时,Artist.axes属性变得尤为重要。它允许我们的自定义Artist与Matplotlib的绘图系统进行正确的交互。
下面是一个自定义Artist的例子:
import matplotlib.pyplot as plt
from matplotlib.artist import Artist

class MyCustomArtist(Artist):
    def __init__(self, axes, *args, **kwargs):
        super().__init__()
        self.axes = axes
        self._x = 0
        self._y = 0

    def draw(self, renderer):
        # 在(self._x, self._y)位置绘制一个点
        self.axes.plot(self._x, self._y, 'ro')

fig, ax = plt.subplots()
custom_artist = MyCustomArtist(ax)
custom_artist._x = 0.5
custom_artist._y = 0.5
ax.add_artist(custom_artist)

plt.title('Custom Artist Demo - how2matplotlib.com')
plt.show()
Output:
在这个例子中,我们创建了一个自定义的Artist类,它在指定的位置绘制一个红点。通过设置self.axes,我们确保了自定义Artist知道它属于哪个Axes对象。
4. 使用Artist.axes进行坐标转换
Artist.axes属性还可以用于坐标转换。Matplotlib支持多种坐标系统,如数据坐标、Axes坐标、图形坐标等。通过axes属性,我们可以方便地进行这些坐标系统之间的转换。
import matplotlib.pyplot as plt
import numpy as np

fig, ax = plt.subplots()
line, = ax.plot(np.random.rand(10), np.random.rand(10), 'o', label='Data from how2matplotlib.com')

# 获取数据坐标系中的点
data_point = (0.5, 0.5)

# 将数据坐标转换为Axes坐标
axes_point = line.axes.transData.transform(data_point)

# 将Axes坐标转换为图形坐标
fig_point = fig.transFigure.inverted().transform(axes_point)

print(f"Data point: {data_point}")
print(f"Axes point: {axes_point}")
print(f"Figure point: {fig_point}")

plt.show()
Output:
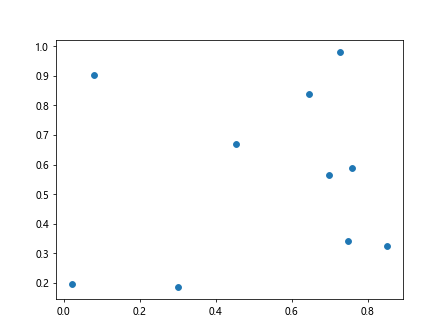
在这个例子中,我们演示了如何使用Artist.axes属性进行不同坐标系统之间的转换。这在需要精确定位图形元素时非常有用。
5. Artist.axes与多子图
当我们使用多个子图时,Artist.axes属性可以帮助我们确定特定的Artist对象属于哪个子图。这在处理复杂的图形布局时特别有用。
import matplotlib.pyplot as plt
import numpy as np

fig, (ax1, ax2) = plt.subplots(1, 2, figsize=(10, 5))

line1, = ax1.plot(np.random.rand(10), label='Data 1 from how2matplotlib.com')
line2, = ax2.plot(np.random.rand(10), label='Data 2 from how2matplotlib.com')

print(f"line1 belongs to axes: {line1.axes}")
print(f"line2 belongs to axes: {line2.axes}")

ax1.set_title('Subplot 1')
ax2.set_title('Subplot 2')

plt.tight_layout()
plt.show()
Output:
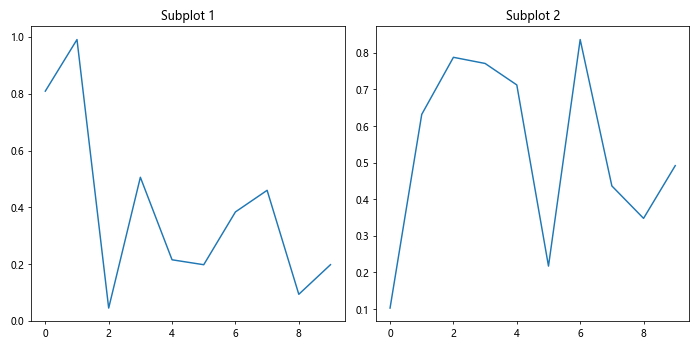
在这个例子中,我们创建了两个子图,并在每个子图中绘制了一条线。通过Artist.axes属性,我们可以确定每条线属于哪个子图。
6. 使用Artist.axes修改图形属性
Artist.axes属性不仅可以用于获取信息,还可以用于修改图形的各种属性。这包括坐标轴范围、标签、刻度等。
import matplotlib.pyplot as plt
import numpy as np

fig, ax = plt.subplots()
line, = ax.plot(np.random.rand(10), np.random.rand(10), 'o-', label='Data from how2matplotlib.com')

# 使用line.axes修改图形属性
line.axes.set_xlim(0, 1)
line.axes.set_ylim(0, 1)
line.axes.set_title('Modified Plot - how2matplotlib.com')
line.axes.set_xlabel('X-axis')
line.axes.set_ylabel('Y-axis')

# 添加网格线
line.axes.grid(True)

plt.show()
Output:
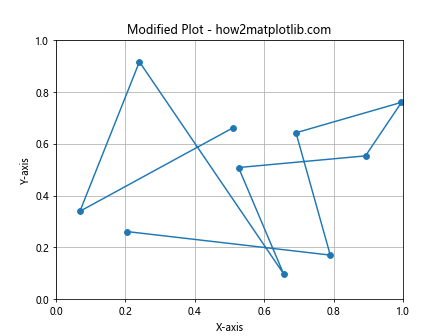
在这个例子中,我们通过line.axes属性修改了x轴和y轴的范围、设置了标题和轴标签,并添加了网格线。
7. Artist.axes与图例
Artist.axes属性在处理图例时也很有用。我们可以使用它来添加或修改图例。
import matplotlib.pyplot as plt
import numpy as np

fig, ax = plt.subplots()
line1, = ax.plot(np.random.rand(10), label='Data 1 from how2matplotlib.com')
line2, = ax.plot(np.random.rand(10), label='Data 2 from how2matplotlib.com')

# 使用line1.axes添加图例
line1.axes.legend()

# 修改图例位置
line1.axes.legend(loc='lower right')

plt.show()
Output:

在这个例子中,我们使用line1.axes.legend()添加了图例,并修改了图例的位置。
8. Artist.axes与文本注释
Artist.axes属性还可以用于添加文本注释。这在需要在图表上添加说明或标记时非常有用。
import matplotlib.pyplot as plt
import numpy as np

fig, ax = plt.subplots()
x = np.linspace(0, 2*np.pi, 100)
line, = ax.plot(x, np.sin(x), label='Sine wave from how2matplotlib.com')

# 使用line.axes添加文本注释
line.axes.annotate('Peak', xy=(np.pi/2, 1), xytext=(np.pi/2, 1.2),
                   arrowprops=dict(facecolor='black', shrink=0.05))

plt.show()
Output:
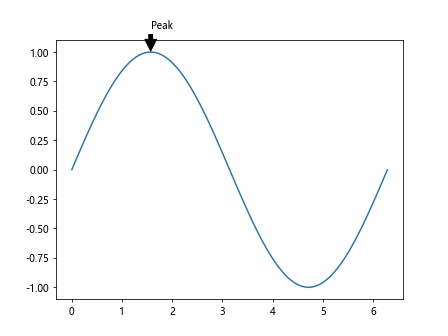
在这个例子中,我们使用line.axes.annotate()在正弦波的峰值处添加了一个文本注释。
9. Artist.axes与颜色映射
Artist.axes属性还可以用于设置和修改颜色映射。这在创建热图或其他需要颜色编码的图表时特别有用。
import matplotlib.pyplot as plt
import numpy as np

fig, ax = plt.subplots()
data = np.random.rand(10, 10)
im = ax.imshow(data, cmap='viridis')

# 使用im.axes添加颜色条
im.axes.figure.colorbar(im, ax=im.axes, label='Values from how2matplotlib.com')

plt.title('Heatmap with Colorbar')
plt.show()
Output:
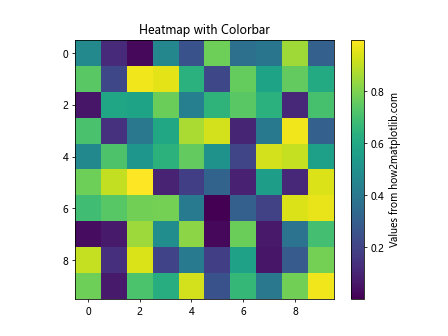
在这个例子中,我们创建了一个热图,并使用im.axes.figure.colorbar()添加了一个颜色条。
10. Artist.axes与动画
Artist.axes属性在创建动画时也很有用。我们可以使用它来更新动画中的图形元素。
import matplotlib.pyplot as plt
import numpy as np
from matplotlib.animation import FuncAnimation

fig, ax = plt.subplots()
line, = ax.plot([], [], lw=2)

def init():
    line.axes.set_xlim(0, 2*np.pi)
    line.axes.set_ylim(-1, 1)
    return line,

def update(frame):
    x = np.linspace(0, 2*np.pi, 100)
    y = np.sin(x + frame/10)
    line.set_data(x, y)
    return line,

ani = FuncAnimation(fig, update, frames=np.linspace(0, 2*np.pi, 128),
                    init_func=init, blit=True)

plt.title('Animated Sine Wave - how2matplotlib.com')
plt.show()
Output:
在这个例子中,我们创建了一个简单的正弦波动画。我们使用line.axes来设置x轴和y轴的范围。
11. Artist.axes与3D图形
Artist.axes属性在处理3D图形时也非常有用。它可以帮助我们访问和修改3D Axes的属性。
import matplotlib.pyplot as plt
import numpy as np
from mpl_toolkits.mplot3d import Axes3D

fig = plt.figure()
ax = fig.add_subplot(111, projection='3d')

x = np.random.rand(100)
y = np.random.rand(100)
z = np.random.rand(100)
scatter = ax.scatter(x, y, z)

# 使用scatter.axes修改3D图形属性
scatter.axes.set_xlabel('X Label')
scatter.axes.set_ylabel('Y Label')
scatter.axes.set_zlabel('Z Label')
scatter.axes.set_title('3D Scatter Plot - how2matplotlib.com')

plt.show()
Output:
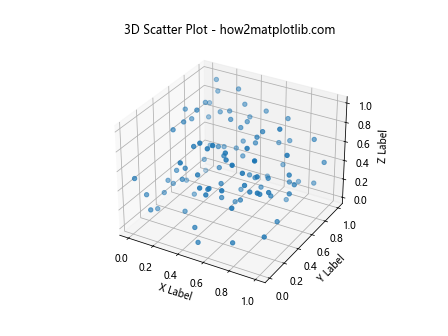
在这个例子中,我们创建了一个3D散点图,并使用scatter.axes来设置轴标签和标题。
12. Artist.axes与极坐标图
Artist.axes属性在处理极坐标图时也很有用。我们可以使用它来修改极坐标图的各种属性。
import matplotlib.pyplot as plt
import numpy as np

fig, ax = plt.subplots(subplot_kw=dict(projection='polar'))
r = np.arange(0, 2, 0.01)
theta = 2 * np.pi * r
line, = ax.plot(theta, r)

# 使用line.axes修改极坐标图属性
line.axes.set_rticks([0.5, 1, 1.5, 2])
line.axes.set_rlabel_position(45)
line.axes.set_title('Polar Plot - how2matplotlib.com')

plt.show()
Output:
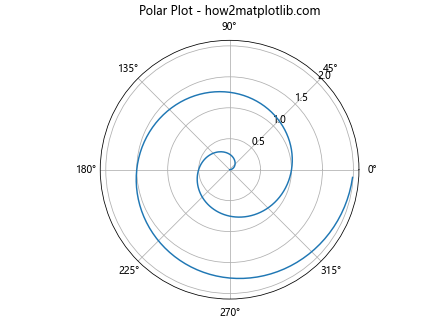
在这个例子中,我们创建了一个极坐标图,并使用line.axes来设置径向刻度和标签位置。
13. Artist.axes与子图布局
Artist.axes属性在处理复杂的子图布局时也很有用。我们可以使用它来调整子图的位置和大小。
import matplotlib.pyplot as plt
import numpy as np

fig = plt.figure(figsize=(12, 8))
gs = fig.add_gridspec(2, 2)

ax1 = fig.add_subplot(gs[0, 0])
ax2 = fig.add_subplot(gs[0, 1])
ax3 = fig.add_subplot(gs[1, :])

line1, = ax1.plot(np.random.rand(10), label='Data 1 from how2matplotlib.com')
line2, = ax2.plot(np.random.rand(10), label='Data 2 from how2matplotlib.com')
line3, = ax3.plot(np.random.rand(20), label='Data 3 from how2matplotlib.com')

# 使用Artist.axes调整子图布局
line1.axes.set_position([0.1, 0.6, 0.35, 0.35])
line2.axes.set_position([0.55, 0.6, 0.35, 0.35])
line3.axes.set_position([0.1, 0.1, 0.8, 0.4])

plt.show()
Output:
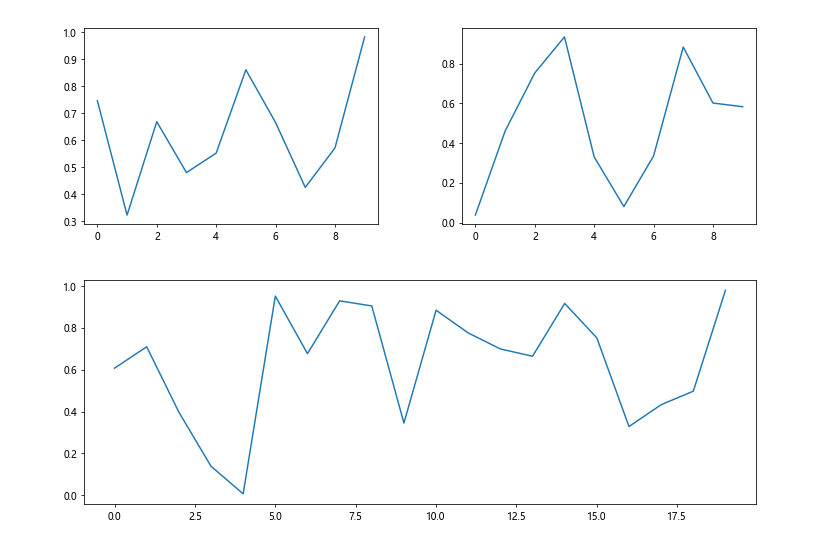
在这个例子中,我们创建了一个包含三个子图的复杂布局,并使用line.axes.set_position()来调整每个子图的位置和大小。
14. Artist.axes与图形样式
Artist.axes属性还可以用于设置和修改图形的整体样式。这包括背景色、网格线、刻度样式等。
import matplotlib.pyplot as plt
import numpy as np

fig, ax = plt.subplots()
x = np.linspace(0, 10, 100)
line, = ax.plot(x, np.sin(x), label='Sine wave from how2matplotlib.com')

# 使用line.axes修改图形样式
line.axes.set_facecolor('#f0f0f0')
line.axes.grid(True, linestyle='--', alpha=0.7)
line.axes.tick_params(axis='both', which='major', labelsize=10, colors='navy')

# 设置标题和轴标签
line.axes.set_title('Styled Plot - how2matplotlib.com', fontsize=16, fontweight='bold')
line.axes.set_xlabel('X-axis', fontsize=12)
line.axes.set_ylabel('Y-axis', fontsize=12)

plt.show()
Output:
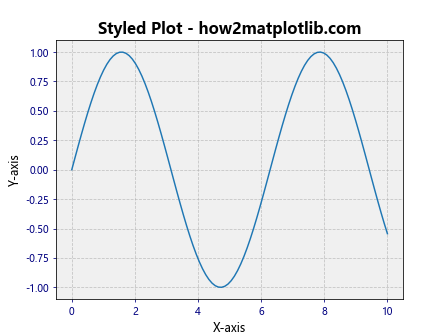
在这个例子中,我们使用line.axes来设置背景色、网格线样式、刻度标签样式,以及标题和轴标签的字体样式。
15. Artist.axes与图形保存
Artist.axes属性在保存图形时也很有用。我们可以使用它来调整图形的大小和分辨率。
import matplotlib.pyplot as plt
import numpy as np

fig, ax = plt.subplots()
x = np.linspace(0, 10, 100)
line, = ax.plot(x, np.sin(x), label='Sine wave from how2matplotlib.com')

# 使用line.axes调整图形大小
line.axes.figure.set_size_inches(10, 6)

# 保存图形
line.axes.figure.savefig('sine_wave_how2matplotlib.png', dpi=300, bbox_inches='tight')

plt.show()
Output:

在这个例子中,我们使用line.axes.figure来调整图形的大小,并保存高分辨率的图像文件。
16. Artist.axes与交互式绘图
Artist.axes属性在创建交互式绘图时也非常有用。我们可以使用它来添加和响应用户交互。
import matplotlib.pyplot as plt
import numpy as np

fig, ax = plt.subplots()
x = np.linspace(0, 10, 100)
line, = ax.plot(x, np.sin(x), label='Sine wave from how2matplotlib.com')

def on_click(event):
    if event.inaxes == line.axes:
        print(f'Clicked at position: ({event.xdata:.2f}, {event.ydata:.2f})')

fig.canvas.mpl_connect('button_press_event', on_click)

plt.title('Interactive Plot - Click anywhere on the plot')
plt.show()
Output:
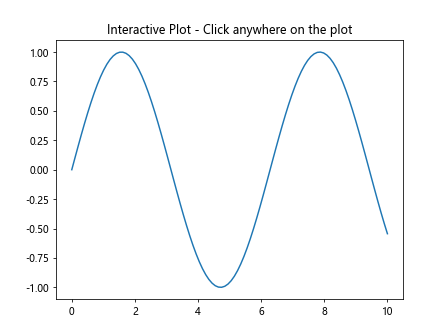
在这个例子中,我们添加了一个点击事件处理函数。当用户点击图形时,如果点击位置在line所属的axes内,就会打印出点击的坐标。
17. Artist.axes与自定义刻度
Artist.axes属性还可以用于创建自定义刻度。这在需要特殊格式的刻度标签时非常有用。
import matplotlib.pyplot as plt
import numpy as np

fig, ax = plt.subplots()
x = np.linspace(0, 2*np.pi, 100)
line, = ax.plot(x, np.sin(x), label='Sine wave from how2matplotlib.com')

# 自定义x轴刻度
x_ticks = [0, np.pi/2, np.pi, 3*np.pi/2, 2*np.pi]
x_labels = ['0', 'π/2', 'π', '3π/2', '2π']
line.axes.set_xticks(x_ticks)
line.axes.set_xticklabels(x_labels)

plt.title('Sine Wave with Custom Ticks')
plt.show()
Output:
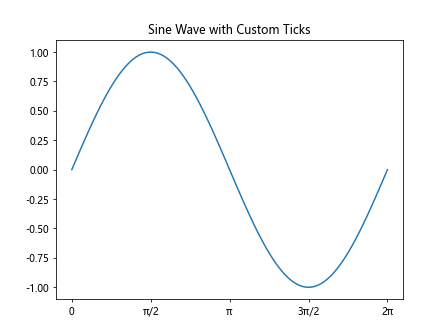
在这个例子中,我们使用line.axes来设置自定义的x轴刻度和标签,显示π的倍数。
18. Artist.axes与双y轴
Artist.axes属性在创建双y轴图形时也很有用。我们可以使用它来设置和调整第二个y轴。
import matplotlib.pyplot as plt
import numpy as np

fig, ax1 = plt.subplots()

x = np.linspace(0, 10, 100)
y1 = np.sin(x)
y2 = np.exp(x)

line1, = ax1.plot(x, y1, 'b-', label='Sine from how2matplotlib.com')
ax1.set_ylabel('Sine', color='b')

ax2 = ax1.twinx()  # 创建共享x轴的第二个y轴
line2, = ax2.plot(x, y2, 'r-', label='Exponential from how2matplotlib.com')
ax2.set_ylabel('Exponential', color='r')

# 使用line1.axes和line2.axes设置标题和图例
line1.axes.set_title('Dual Y-axis Plot')
lines = [line1, line2]
labels = [l.get_label() for l in lines]
ax1.legend(lines, labels, loc='upper left')

plt.show()
Output:
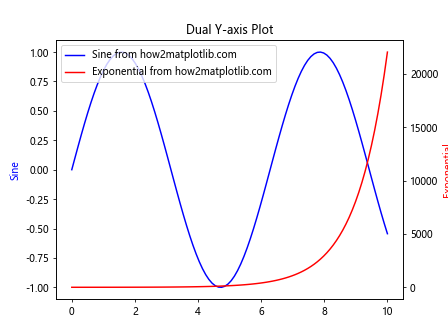
在这个例子中,我们创建了一个具有两个y轴的图形,分别显示正弦函数和指数函数。我们使用line1.axes和line2.axes来设置标题和图例。
19. Artist.axes与极限值标注
Artist.axes属性可以用来在图形上标注极值点。这在数据分析和可视化中非常有用。
import matplotlib.pyplot as plt
import numpy as np

fig, ax = plt.subplots()
x = np.linspace(0, 10, 100)
y = np.sin(x)
line, = ax.plot(x, y, label='Sine wave from how2matplotlib.com')

# 找到最大值和最小值
max_index = np.argmax(y)
min_index = np.argmin(y)

# 使用line.axes标注极值点
line.axes.annotate('Max', xy=(x[max_index], y[max_index]), xytext=(x[max_index], y[max_index]+0.5),
                   arrowprops=dict(facecolor='black', shrink=0.05))
line.axes.annotate('Min', xy=(x[min_index], y[min_index]), xytext=(x[min_index], y[min_index]-0.5),
                   arrowprops=dict(facecolor='black', shrink=0.05))

plt.title('Sine Wave with Extrema Annotations')
plt.show()
Output:
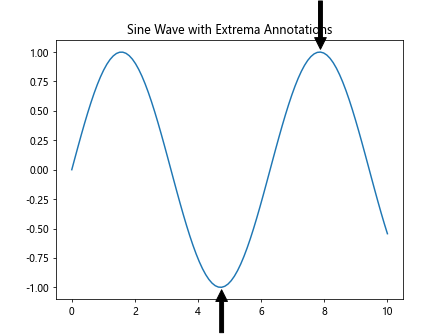
在这个例子中,我们使用line.axes.annotate()来标注正弦波的最大值和最小值点。
20. Artist.axes与数据缩放
最后,我们来看看如何使用Artist.axes属性来实现数据的动态缩放。
import matplotlib.pyplot as plt
import numpy as np

fig, ax = plt.subplots()
x = np.linspace(0, 10, 100)
y = np.sin(x)
line, = ax.plot(x, y, label='Sine wave from how2matplotlib.com')

def zoom(event):
    cur_xlim = line.axes.get_xlim()
    cur_ylim = line.axes.get_ylim()
    xdata = event.xdata # 获取鼠标点击的x坐标
    ydata = event.ydata # 获取鼠标点击的y坐标
    if event.button == 'up':
        # 放大
        scale_factor = 0.9
    elif event.button == 'down':
        # 缩小
        scale_factor = 1.1
    else:
        scale_factor = 1

    new_width = (cur_xlim[1] - cur_xlim[0]) * scale_factor
    new_height = (cur_ylim[1] - cur_ylim[0]) * scale_factor

    relx = (cur_xlim[1] - xdata)/(cur_xlim[1] - cur_xlim[0])
    rely = (cur_ylim[1] - ydata)/(cur_ylim[1] - cur_ylim[0])

    line.axes.set_xlim([xdata - new_width * (1-relx), xdata + new_width * (relx)])
    line.axes.set_ylim([ydata - new_height * (1-rely), ydata + new_height * (rely)])
    plt.draw()

fig.canvas.mpl_connect('scroll_event', zoom)

plt.title('Zoomable Plot - Use mouse wheel to zoom')
plt.show()
Output:
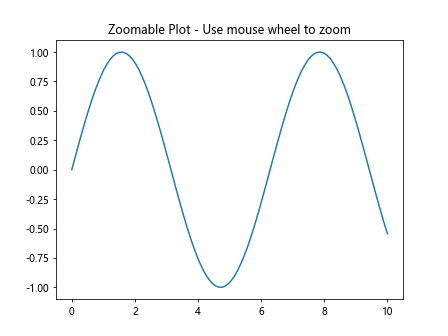
在这个例子中,我们实现了一个可以通过鼠标滚轮缩放的图形。我们使用line.axes来获取和设置坐标轴的范围,从而实现缩放效果。
总结起来,Matplotlib中的Artist.axes属性是一个强大而灵活的工具,它为我们提供了一种方便的方式来访问和操作图形的各个方面。无论是简单的图形调整还是复杂的交互式可视化,Artist.axes属性都能发挥重要作用。通过深入理解和灵活运用这个属性,我们可以创建出更加精确、美观和功能丰富的数据可视化作品。
 极客教程
极客教程