Matplotlib中使用set_minor_formatter()函数设置次要刻度格式
参考:Matplotlib.axis.Axis.set_minor_formatter() function in Python
Matplotlib是Python中最流行的数据可视化库之一,它提供了丰富的绘图功能和自定义选项。在创建图表时,刻度标签的格式化是一个重要的方面,可以大大提高图表的可读性和美观度。本文将详细介绍Matplotlib中的Axis.set_minor_formatter()函数,这是一个用于设置坐标轴次要刻度标签格式的强大工具。
1. set_minor_formatter()函数简介
set_minor_formatter()是Matplotlib库中axis.Axis类的一个方法,用于设置坐标轴次要刻度的格式化器。次要刻度通常是主要刻度之间的较小刻度,用于提供更精细的刻度信息。通过使用这个函数,我们可以自定义次要刻度标签的显示方式,使图表更加清晰和信息丰富。
基本语法如下:
axis.set_minor_formatter(formatter)
其中,axis是坐标轴对象(可以是x轴或y轴),formatter是一个格式化器对象或可调用对象,用于定义如何格式化次要刻度标签。
2. 常用的格式化器
Matplotlib提供了多种内置的格式化器,可以直接用于set_minor_formatter()函数。以下是一些常用的格式化器:
2.1 NullFormatter
NullFormatter用于隐藏刻度标签,只显示刻度线而不显示文本。
示例代码:
import matplotlib.pyplot as plt
import numpy as np
from matplotlib.ticker import NullFormatter

fig, ax = plt.subplots(figsize=(8, 6))
x = np.linspace(0, 10, 100)
y = np.sin(x)
ax.plot(x, y, label='sin(x)')

ax.xaxis.set_minor_formatter(NullFormatter())
ax.set_title('How2matplotlib.com - NullFormatter Example')
ax.legend()
plt.show()
Output:
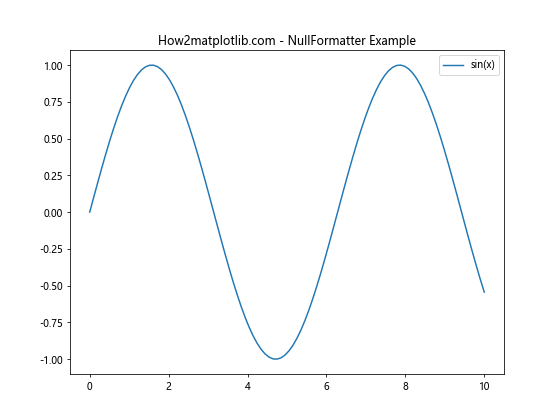
在这个例子中,我们使用NullFormatter()来隐藏x轴的次要刻度标签。这样可以减少图表的视觉复杂度,同时保留刻度线以提供参考。
2.2 FormatStrFormatter
FormatStrFormatter允许使用字符串格式化语法来定制刻度标签的显示方式。
示例代码:
import matplotlib.pyplot as plt
import numpy as np
from matplotlib.ticker import FormatStrFormatter

fig, ax = plt.subplots(figsize=(8, 6))
x = np.linspace(0, 5, 50)
y = x**2

ax.plot(x, y, label='y = x^2')
ax.yaxis.set_minor_formatter(FormatStrFormatter('%.2f'))
ax.set_title('How2matplotlib.com - FormatStrFormatter Example')
ax.legend()
plt.show()
Output:
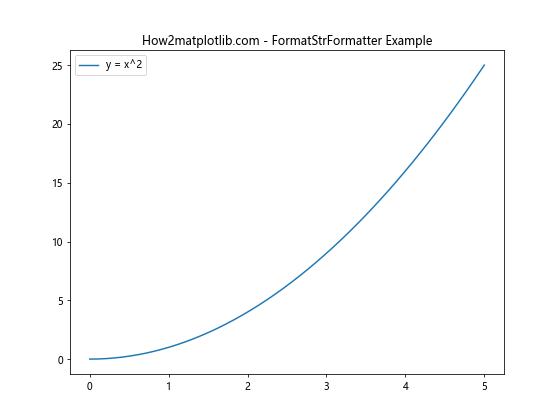
在这个例子中,我们使用FormatStrFormatter('%.2f')来格式化y轴的次要刻度标签,使其显示为保留两位小数的浮点数。
2.3 FuncFormatter
FuncFormatter允许我们使用自定义函数来格式化刻度标签,提供了最大的灵活性。
示例代码:
import matplotlib.pyplot as plt
import numpy as np
from matplotlib.ticker import FuncFormatter

def format_func(value, tick_number):
    return f"How2matplotlib.com\n{value:.1f}°"

fig, ax = plt.subplots(figsize=(8, 6))
x = np.linspace(0, 360, 37)
y = np.sin(np.radians(x))

ax.plot(x, y, label='sin(x)')
ax.xaxis.set_minor_formatter(FuncFormatter(format_func))
ax.set_title('FuncFormatter Example')
ax.legend()
plt.show()
Output:
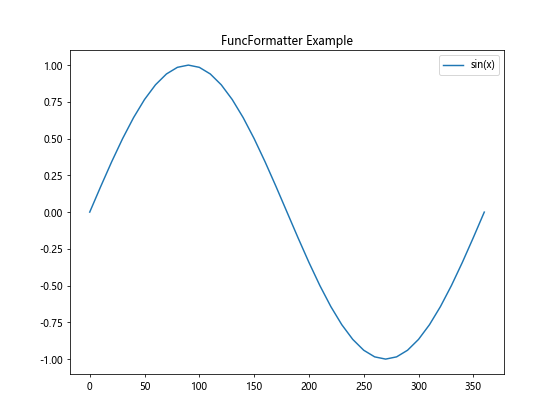
在这个例子中,我们定义了一个自定义函数format_func,它将值格式化为带有一位小数的角度,并在每个标签上添加”How2matplotlib.com”。然后我们使用FuncFormatter(format_func)来应用这个格式化函数到x轴的次要刻度。
3. 设置次要刻度的位置
在使用set_minor_formatter()之前,我们通常需要先设置次要刻度的位置。这可以通过set_minor_locator()方法来实现。
4. 结合主要刻度和次要刻度
为了创建信息丰富的图表,我们通常会同时设置主要刻度和次要刻度的格式。
示例代码:
import matplotlib.pyplot as plt
import numpy as np
from matplotlib.ticker import MultipleLocator, FormatStrFormatter, FuncFormatter

def major_formatter(x, pos):
    return f"How2matplotlib.com\n{x:.0f}"

def minor_formatter(x, pos):
    return f"{x:.1f}"

fig, ax = plt.subplots(figsize=(10, 6))
x = np.linspace(0, 10, 100)
y = np.sin(x) * np.exp(-x/10)

ax.plot(x, y, label='sin(x) * exp(-x/10)')

ax.xaxis.set_major_locator(MultipleLocator(2))
ax.xaxis.set_major_formatter(FuncFormatter(major_formatter))
ax.xaxis.set_minor_locator(MultipleLocator(0.5))
ax.xaxis.set_minor_formatter(FuncFormatter(minor_formatter))

ax.set_title('Combining Major and Minor Formatters')
ax.legend()
plt.show()
Output:
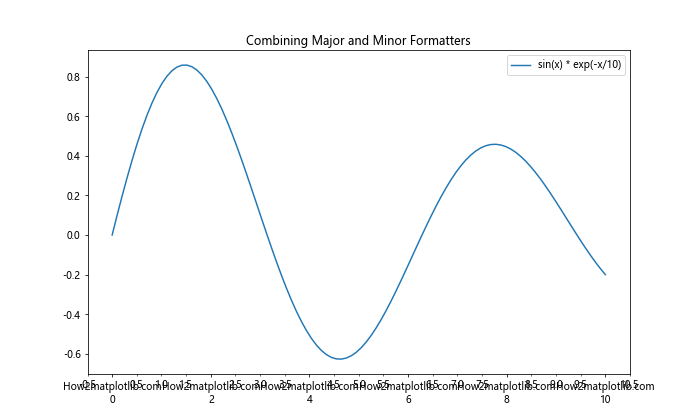
在这个例子中,我们为x轴设置了不同的主要刻度和次要刻度格式。主要刻度显示整数值和”How2matplotlib.com”,而次要刻度显示一位小数的值。
5. 在极坐标系中使用set_minor_formatter()
set_minor_formatter()函数不仅适用于笛卡尔坐标系,也可以在极坐标系中使用。
示例代码:
import matplotlib.pyplot as plt
import numpy as np
from matplotlib.ticker import FuncFormatter

def rad_to_deg(x, pos):
    return f"{np.degrees(x):.0f}°"

fig, ax = plt.subplots(figsize=(8, 8), subplot_kw=dict(projection='polar'))
r = np.linspace(0, 1, 100)
theta = 2 * np.pi * r

ax.plot(theta, r)
ax.set_title('How2matplotlib.com - Polar Plot with Formatted Ticks')

ax.xaxis.set_minor_formatter(FuncFormatter(rad_to_deg))
plt.show()
Output:
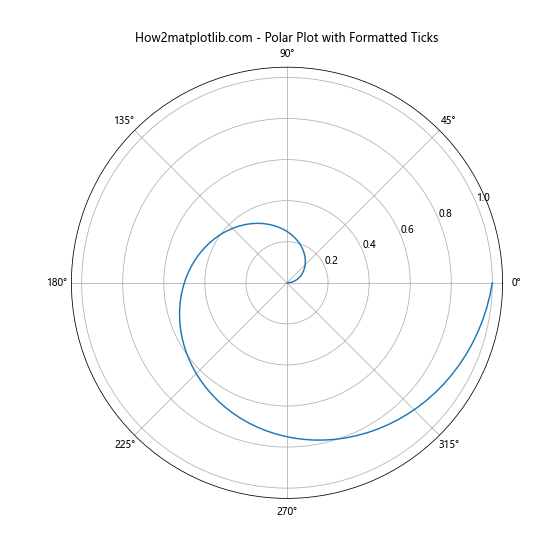
在这个极坐标系的例子中,我们使用FuncFormatter将弧度转换为度数,并应用到次要刻度上。
6. 日期时间格式化
对于时间序列数据,Matplotlib提供了专门的日期时间格式化器。
示例代码:
import matplotlib.pyplot as plt
import numpy as np
from matplotlib.dates import DateFormatter, DayLocator, HourLocator
from datetime import datetime, timedelta

fig, ax = plt.subplots(figsize=(10, 6))

base = datetime(2023, 1, 1)
dates = [base + timedelta(hours=i) for i in range(48)]
y = np.random.randn(48).cumsum()

ax.plot(dates, y)

ax.xaxis.set_major_locator(DayLocator())
ax.xaxis.set_major_formatter(DateFormatter('%Y-%m-%d'))
ax.xaxis.set_minor_locator(HourLocator(byhour=range(0, 24, 6)))
ax.xaxis.set_minor_formatter(DateFormatter('%H:%M'))

ax.set_title('How2matplotlib.com - Time Series with Formatted Ticks')
plt.xticks(rotation=45)
plt.tight_layout()
plt.show()
Output:
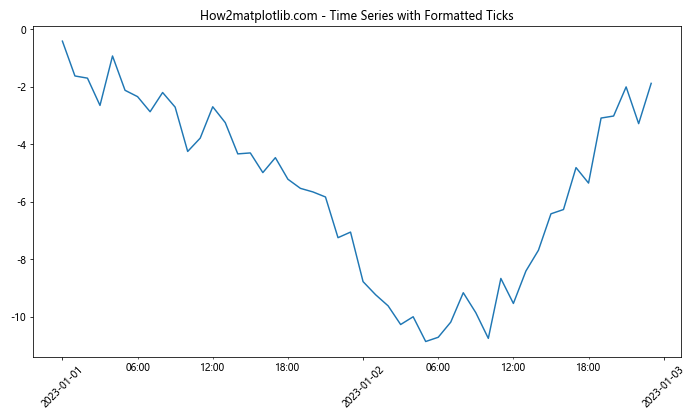
在这个例子中,我们使用DateFormatter来格式化日期时间刻度。主要刻度显示日期,次要刻度显示时间。
7. 科学记数法格式化
对于非常大或非常小的数值,使用科学记数法可以使图表更加清晰。
示例代码:
import matplotlib.pyplot as plt
import numpy as np
from matplotlib.ticker import ScalarFormatter, FormatStrFormatter

fig, ax = plt.subplots(figsize=(8, 6))
x = np.logspace(0, 10, 11)
y = x**2

ax.plot(x, y)
ax.set_xscale('log')
ax.set_yscale('log')

ax.xaxis.set_major_formatter(ScalarFormatter())
ax.yaxis.set_major_formatter(ScalarFormatter())
ax.yaxis.set_minor_formatter(FormatStrFormatter('%.1e'))

ax.set_title('How2matplotlib.com - Scientific Notation Example')
plt.tight_layout()
plt.show()
Output:
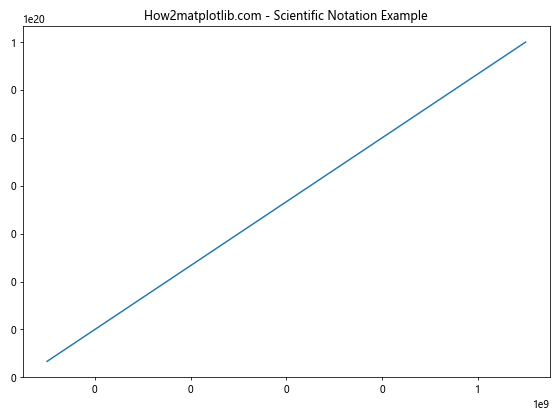
在这个例子中,我们使用ScalarFormatter()来格式化主要刻度,使用FormatStrFormatter('%.1e')来以科学记数法格式化y轴的次要刻度。
8. 自定义Ticker类
对于更复杂的格式化需求,我们可以创建自定义的Ticker类。
示例代码:
import matplotlib.pyplot as plt
import numpy as np
from matplotlib.ticker import Formatter

class CustomFormatter(Formatter):
    def __init__(self, prefix='How2matplotlib.com'):
        self.prefix = prefix

    def __call__(self, x, pos=None):
        if x == 0:
            return self.prefix
        return f"{self.prefix}\n{x:.2f}"

fig, ax = plt.subplots(figsize=(8, 6))
x = np.linspace(0, 10, 11)
y = x**2

ax.plot(x, y)
ax.yaxis.set_minor_formatter(CustomFormatter())

ax.set_title('Custom Formatter Example')
plt.tight_layout()
plt.show()
Output:
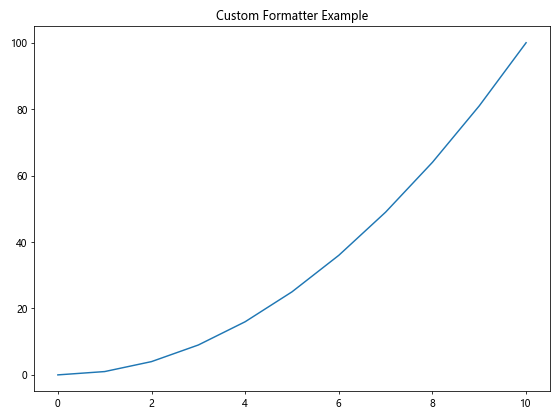
在这个例子中,我们创建了一个CustomFormatter类,它在每个刻度标签前添加一个前缀,并对非零值进行格式化。
9. 多子图中的格式化
当创建包含多个子图的图表时,我们可以为每个子图单独设置格式化器。
示例代码:
import matplotlib.pyplot as plt
import numpy as np
from matplotlib.ticker import FormatStrFormatter, FuncFormatter

def celsius_to_fahrenheit(x, pos):
    return f"{(x * 9/5 + 32):.1f}°F"

fig, (ax1, ax2) = plt.subplots(2, 1, figsize=(8, 10))

x = np.linspace(0, 10, 100)
y1 = np.sin(x)
y2 = np.cos(x)

ax1.plot(x, y1, label='sin(x)')
ax2.plot(x, y2, label='cos(x)')

ax1.yaxis.set_minor_formatter(FormatStrFormatter('%.2f'))
ax2.yaxis.set_minor_formatter(FuncFormatter(celsius_to_fahrenheit))

ax1.set_title('How2matplotlib.com - Subplot 1')
ax2.set_title('How2matplotlib.com - Subplot 2')
ax1.legend()
ax2.legend()

plt.tight_layout()
plt.show()
Output:
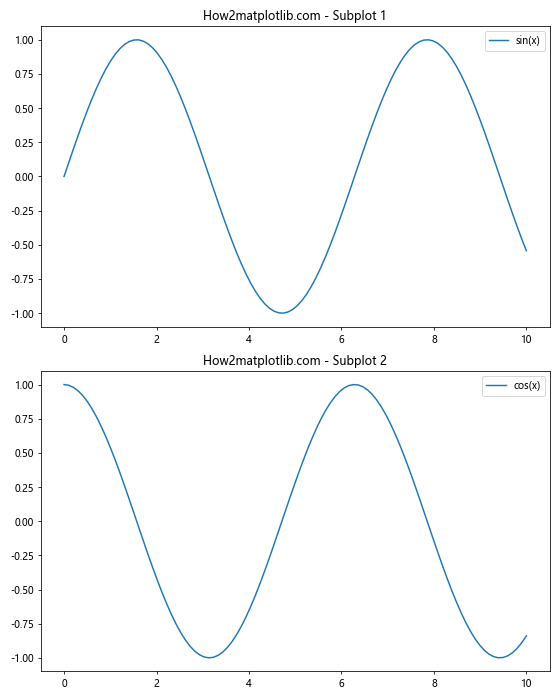
在这个例子中,我们创建了两个子图,并为每个子图的y轴设置了不同的次要刻度格式化器。第一个子图使用FormatStrFormatter显示两位小数,第二个子图使用自定义函数将摄氏度转换为华氏度。
10. 颜色映射刻度格式化
当使用颜色映射(colormap)时,我们也可以格式化颜色条的刻度。
示例代码:
import matplotlib.pyplot as plt
import numpy as np
from matplotlib.ticker import FuncFormatter

def format_func(x, pos):
    return f"How2matplotlib.com\n{x:.1e}"

fig, ax = plt.subplots(figsize=(8, 6))

x = np.linspace(0, 5, 50)
y = np.linspace(0, 5, 40)
X, Y = np.meshgrid(x, y)
Z = np.sin(X) * np.cos(Y) * np.exp(-((X-2.5)**2 + (Y-2.5)**2) / 10)

c = ax.pcolormesh(X, Y, Z, cmap='viridis')
cbar = fig.colorbar(c, ax=ax)
cbar.ax.yaxis.set_minor_formatter(FuncFormatter(format_func))

ax.set_title('Colormap with Formatted Colorbar Ticks')
plt.show()
Output:
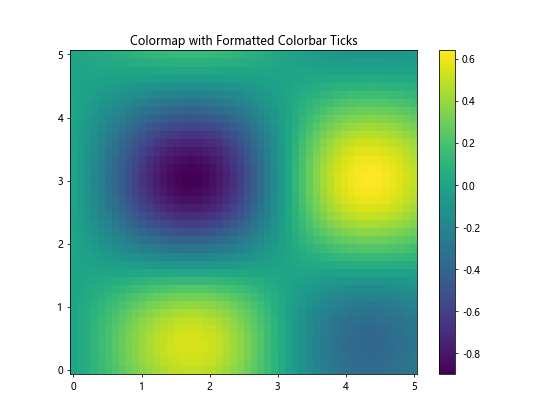
在这个例子中,我们创建了一个颜色映射图,并使用FuncFormatter来格式化颜色条的次要刻度,显示科学记数法和”How2matplotlib.com”标签。
11. 3D图表中的刻度格式化
3D图表也支持刻度格式化,虽然在3D环境中设置次要刻度可能不太常见,但我们仍然可以格式化主要刻度。
示例代码:
import matplotlib.pyplot as plt
import numpy as np
from matplotlib.ticker import FuncFormatter

def format_func(x, pos):
    return f"How2matplotlib.com\n{x:.1f}"

fig = plt.figure(figsize=(10, 8))
ax = fig.add_subplot(111, projection='3d')

x = np.linspace(-5, 5, 50)
y = np.linspace(-5, 5, 50)
X, Y = np.meshgrid(x, y)
Z = np.sin(np.sqrt(X**2 + Y**2))

surf = ax.plot_surface(X, Y, Z, cmap='viridis')

ax.xaxis.set_major_formatter(FuncFormatter(format_func))
ax.yaxis.set_major_formatter(FuncFormatter(format_func))
ax.zaxis.set_major_formatter(FuncFormatter(format_func))

ax.set_title('How2matplotlib.com - 3D Plot with Formatted Ticks')
plt.show()
Output:
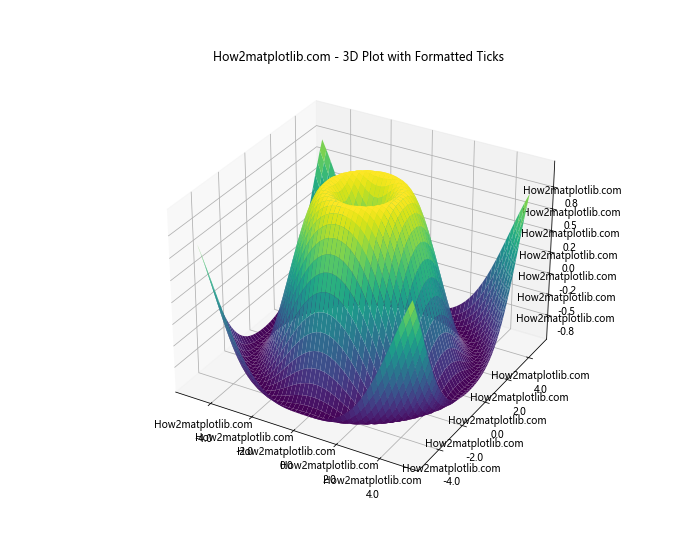
在这个3D图表的例子中,我们为x、y和z轴的主要刻度设置了相同的格式化函数,显示”How2matplotlib.com”和保留一位小数的值。
12. 动态刻度格式化
在某些情况下,我们可能需要根据数据的范围动态调整刻度的格式。这可以通过创建一个自适应的格式化器来实现。
示例代码:
import matplotlib.pyplot as plt
import numpy as np
from matplotlib.ticker import FuncFormatter

class AdaptiveFormatter(object):
    def __init__(self, threshold=1000):
        self.threshold = threshold

    def __call__(self, x, pos):
        if abs(x) >= self.threshold:
            return f"How2matplotlib.com\n{x:.1e}"
        else:
            return f"How2matplotlib.com\n{x:.2f}"

fig, (ax1, ax2) = plt.subplots(1, 2, figsize=(12, 5))

x1 = np.linspace(0, 10, 100)
y1 = x1**2

x2 = np.linspace(0, 1000, 100)
y2 = x2**2

ax1.plot(x1, y1)
ax2.plot(x2, y2)

formatter = AdaptiveFormatter()
ax1.yaxis.set_minor_formatter(FuncFormatter(formatter))
ax2.yaxis.set_minor_formatter(FuncFormatter(formatter))

ax1.set_title('Small Scale')
ax2.set_title('Large Scale')

plt.tight_layout()
plt.show()
Output:
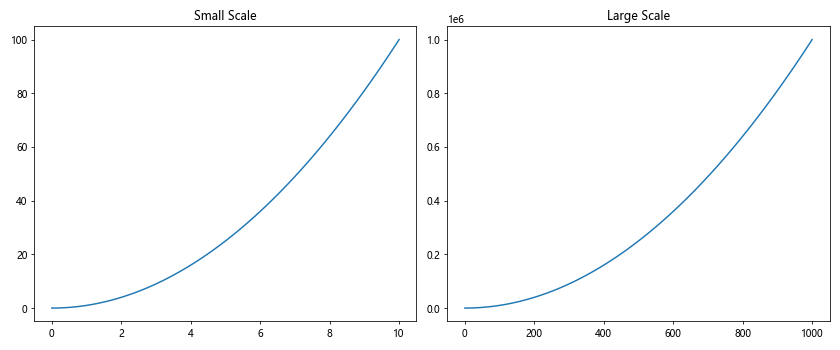
在这个例子中,我们创建了一个AdaptiveFormatter类,它根据数值的大小选择不同的格式化方式。当数值小于阈值时,它显示小数形式;当数值大于或等于阈值时,它显示科学记数法。
13. 极坐标系中的角度格式化
在极坐标系中,我们可能需要以特殊的方式格式化角度刻度。
示例代码:
import matplotlib.pyplot as plt
import numpy as np
from matplotlib.ticker import FuncFormatter

def angle_formatter(x, pos):
    return f"How2matplotlib.com\n{x:.0f}°"

fig, ax = plt.subplots(figsize=(8, 8), subplot_kw=dict(projection='polar'))

r = np.linspace(0, 1, 100)
theta = 2 * np.pi * r

ax.plot(theta, r)
ax.set_rlabel_position(0)
ax.xaxis.set_major_formatter(FuncFormatter(angle_formatter))

ax.set_title('Polar Plot with Formatted Angle Ticks')
plt.show()
Output:
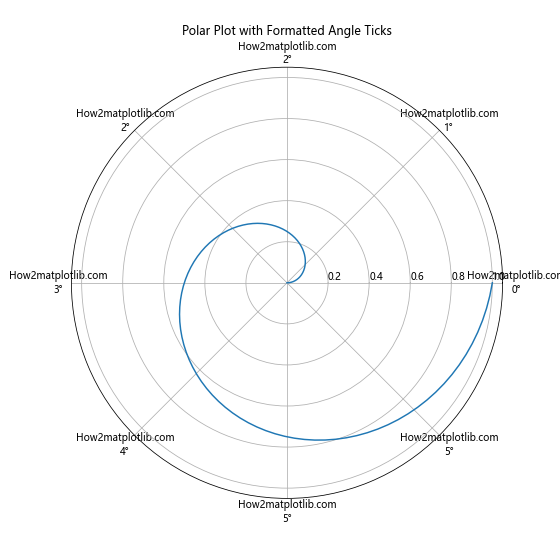
在这个极坐标系的例子中,我们使用FuncFormatter将弧度转换为度数,并在每个刻度标签上添加”How2matplotlib.com”。
14. 对数刻度的格式化
对于对数刻度,我们可能需要特殊的格式化方式来清晰地显示数量级。
示例代码:
import matplotlib.pyplot as plt
import numpy as np
from matplotlib.ticker import FuncFormatter

def log_formatter(x, pos):
    return f"How2matplotlib.com\n10^{int(np.log10(x))}"

fig, ax = plt.subplots(figsize=(10, 6))

x = np.logspace(0, 5, 6)
y = x**2

ax.plot(x, y)
ax.set_xscale('log')
ax.set_yscale('log')

ax.xaxis.set_major_formatter(FuncFormatter(log_formatter))
ax.yaxis.set_major_formatter(FuncFormatter(log_formatter))

ax.set_title('Log Scale Plot with Formatted Ticks')
plt.grid(True)
plt.show()
Output:
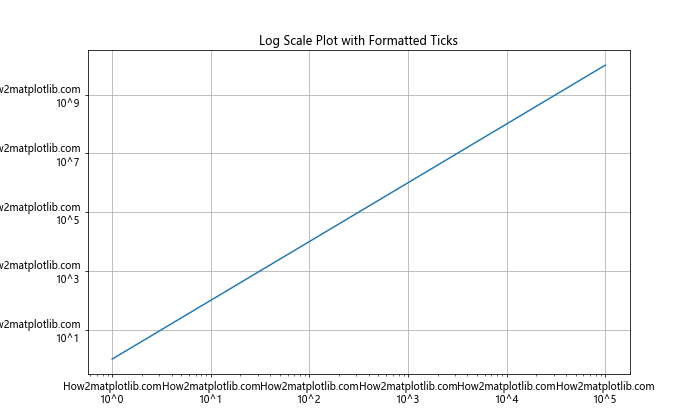
在这个例子中,我们创建了一个对数刻度的图表,并使用自定义的格式化函数来显示10的幂次方形式的刻度标签。
15. 时间序列数据的高级格式化
对于时间序列数据,我们可能需要更复杂的格式化,例如根据时间跨度自动调整格式。
示例代码:
import matplotlib.pyplot as plt
import numpy as np
from matplotlib.dates import DateFormatter, AutoDateLocator
from datetime import datetime, timedelta

class FlexibleDateFormatter(DateFormatter):
    def __init__(self, fmt='%Y-%m-%d'):
        super().__init__(fmt)

    def __call__(self, x, pos=None):
        date = self.num2date(x)
        if date.second != 0 or date.microsecond != 0:
            return f"How2matplotlib.com\n{date:%H:%M:%S.%f}"
        elif date.hour != 0 or date.minute != 0:
            return f"How2matplotlib.com\n{date:%Y-%m-%d %H:%M}"
        else:
            return f"How2matplotlib.com\n{date:%Y-%m-%d}"

fig, ax = plt.subplots(figsize=(12, 6))

base = datetime(2023, 1, 1)
x = [base + timedelta(hours=i) for i in range(168)]  # One week of hourly data
y = np.cumsum(np.random.randn(168))

ax.plot(x, y)

ax.xaxis.set_major_locator(AutoDateLocator())
ax.xaxis.set_major_formatter(FlexibleDateFormatter())

ax.set_title('Time Series with Flexible Date Formatting')
plt.xticks(rotation=45)
plt.tight_layout()
plt.show()
在这个例子中,我们创建了一个FlexibleDateFormatter类,它根据日期时间的精度自动调整格式。这对于显示跨越不同时间尺度的数据特别有用。
16. 多语言支持
在国际化的应用中,我们可能需要支持多种语言的刻度标签。
示例代码:
import matplotlib.pyplot as plt
import numpy as np
from matplotlib.ticker import FuncFormatter

def multilingual_formatter(x, pos):
    languages = {
        'en': 'Value',
        'es': 'Valor',
        'fr': 'Valeur',
        'de': 'Wert'
    }
    lang = 'en'  # 可以根据需要更改语言
    return f"How2matplotlib.com\n{languages[lang]}: {x:.2f}"

fig, ax = plt.subplots(figsize=(8, 6))

x = np.linspace(0, 10, 100)
y = np.sin(x)

ax.plot(x, y)
ax.yaxis.set_minor_formatter(FuncFormatter(multilingual_formatter))

ax.set_title('Multilingual Tick Formatting')
plt.show()
Output:
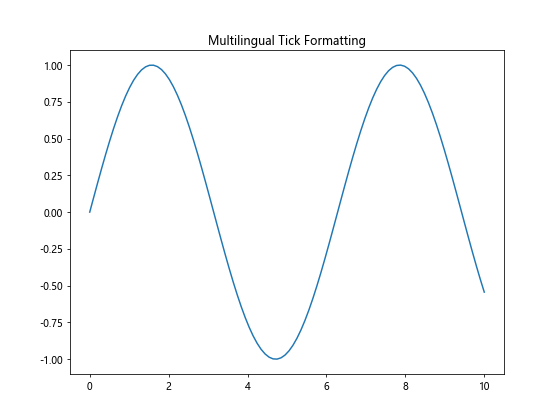
在这个例子中,我们创建了一个多语言格式化器,可以根据选择的语言显示不同的标签文本。
17. 带单位的刻度格式化
在科学或工程图表中,我们可能需要在刻度标签中包含单位信息。
示例代码:
import matplotlib.pyplot as plt
import numpy as np
from matplotlib.ticker import FuncFormatter

def unit_formatter(x, pos):
    units = ['B', 'KB', 'MB', 'GB', 'TB']
    k = 1024.0
    magnitude = int(np.floor(np.log(x) / np.log(k)))
    return f"How2matplotlib.com\n{x/k**magnitude:.1f} {units[magnitude]}"

fig, ax = plt.subplots(figsize=(10, 6))

x = np.logspace(0, 12, 13)
y = x

ax.plot(x, y)
ax.set_xscale('log')
ax.set_yscale('log')

ax.xaxis.set_major_formatter(FuncFormatter(unit_formatter))
ax.yaxis.set_major_formatter(FuncFormatter(unit_formatter))

ax.set_title('Data Size Plot with Unit Formatting')
plt.grid(True)
plt.show()
Output:
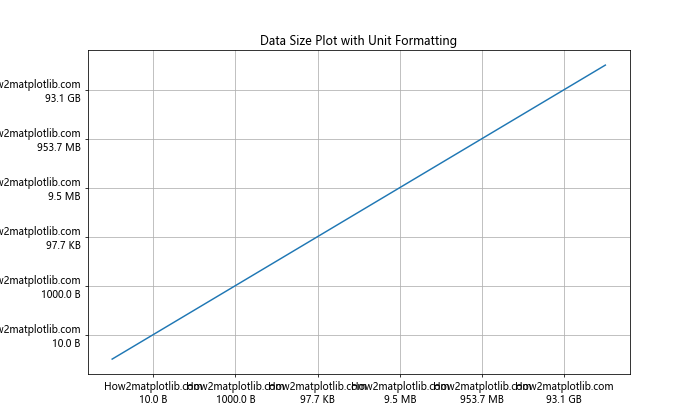
在这个例子中,我们创建了一个格式化器,可以自动将字节数转换为适当的单位(B、KB、MB、GB、TB)并显示。
18. 条形图中的刻度格式化
在条形图中,我们可能需要在每个条形上显示具体的数值。
示例代码:
import matplotlib.pyplot as plt
import numpy as np
from matplotlib.ticker import FuncFormatter

def value_formatter(x, pos):
    return f"How2matplotlib.com\n{x:.0f}"

fig, ax = plt.subplots(figsize=(10, 6))

categories = ['A', 'B', 'C', 'D', 'E']
values = np.random.randint(0, 100, 5)

bars = ax.bar(categories, values)

ax.yaxis.set_major_formatter(FuncFormatter(value_formatter))

for bar in bars:
    height = bar.get_height()
    ax.text(bar.get_x() + bar.get_width()/2., height,
            f'{height}',
            ha='center', va='bottom')

ax.set_title('Bar Chart with Formatted Ticks and Bar Labels')
plt.show()
Output:
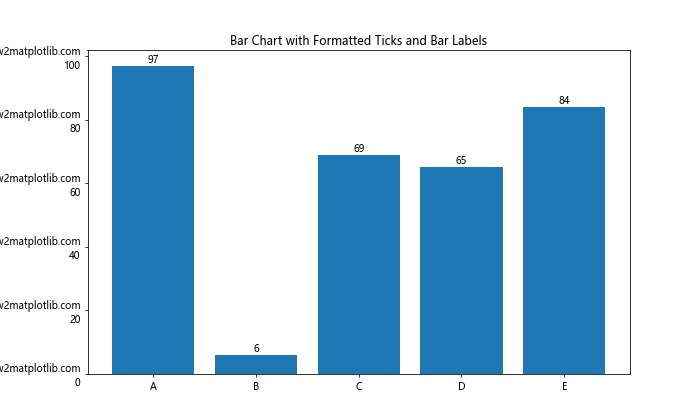
在这个例子中,我们不仅格式化了y轴的刻度,还在每个条形上方添加了数值标签。
19. 热图中的刻度格式化
在热图中,我们可能需要格式化颜色条的刻度。
示例代码:
import matplotlib.pyplot as plt
import numpy as np
from matplotlib.ticker import FuncFormatter

def percentage_formatter(x, pos):
    return f"How2matplotlib.com\n{x:.0%}"

fig, ax = plt.subplots(figsize=(10, 8))

data = np.random.rand(10, 10)
im = ax.imshow(data, cmap='YlOrRd')

cbar = fig.colorbar(im, ax=ax)
cbar.ax.yaxis.set_major_formatter(FuncFormatter(percentage_formatter))

ax.set_title('Heatmap with Percentage Formatted Colorbar')
plt.show()
Output:
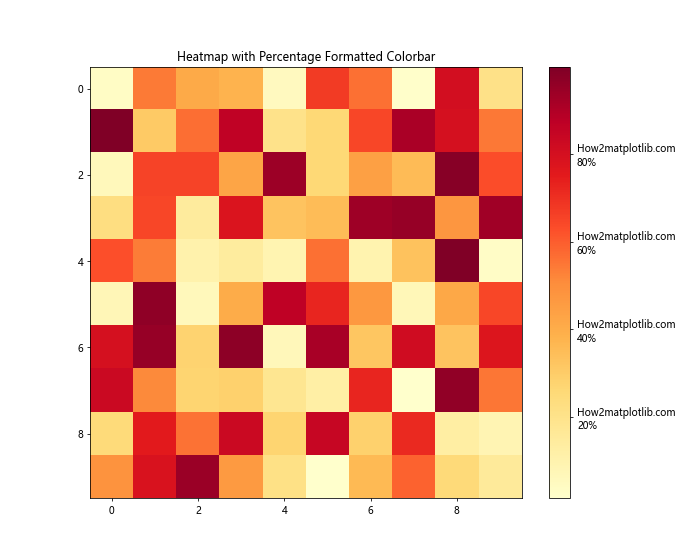
在这个例子中,我们创建了一个热图,并将颜色条的刻度格式化为百分比形式。
20. 动画中的刻度格式化
在创建动画时,我们可能需要动态更新刻度的格式。
示例代码:
import matplotlib.pyplot as plt
import numpy as np
from matplotlib.animation import FuncAnimation
from matplotlib.ticker import FuncFormatter

def time_formatter(x, pos):
    hours = int(x // 3600)
    minutes = int((x % 3600) // 60)
    seconds = int(x % 60)
    return f"How2matplotlib.com\n{hours:02d}:{minutes:02d}:{seconds:02d}"

fig, ax = plt.subplots(figsize=(10, 6))

x = np.linspace(0, 2*np.pi, 100)
line, = ax.plot(x, np.sin(x))

ax.xaxis.set_major_formatter(FuncFormatter(time_formatter))

def update(frame):
    line.set_ydata(np.sin(x + frame/10))
    ax.set_xlim(frame, frame + 2*np.pi)
    return line,

ani = FuncAnimation(fig, update, frames=np.linspace(0, 100, 500),
                    interval=50, blit=True)

plt.title('Animated Plot with Time Formatted Ticks')
plt.show()
Output:
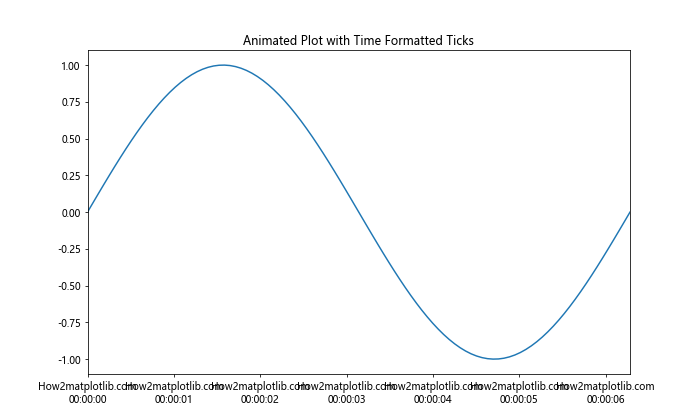
在这个动画例子中,我们创建了一个时间格式化器,将x轴的值转换为时:分:秒的格式。随着动画的进行,x轴的刻度会动态更新。
总结:
通过本文的详细介绍和丰富的示例,我们深入探讨了Matplotlib中Axis.set_minor_formatter()函数的使用方法和应用场景。从基本的数值格式化到复杂的自定义格式化器,从2D图表到3D图表,从静态图表到动画,我们展示了这个强大函数的多样性和灵活性。
正确使用刻度格式化可以大大提高图表的可读性和信息传递效率。无论是科学数据可视化、金融分析还是日常数据报告,掌握刻度格式化技巧都能让你的图表更加专业和有说服力。
记住,图表的核心是传达信息,而良好的刻度格式化是实现这一目标的关键工具之一。希望这篇文章能够帮助你在Matplotlib中创建出更加清晰、美观、信息丰富的图表。
 极客教程
极客教程