Matplotlib annotation box
在Matplotlib中,我们可以通过使用annotation box来标记和注释图表中的特定数据点或区域。annotation box可以包含文本、箭头和样式设置,帮助我们更清晰地表达数据的含义。在本文中,我们将详细介绍如何在Matplotlib中使用annotation box来标记图表中的数据点。
1. 基本用法
首先,让我们看一个简单的例子,展示如何在图表中使用annotation box。
import matplotlib.pyplot as plt

x = [1, 2, 3, 4, 5]
y = [2, 3, 5, 7, 11]

plt.plot(x, y, marker='o')

plt.annotate('Prime numbers',
             xy=(4, 7),
             xytext=(3, 8),
             arrowprops=dict(facecolor='black', shrink=0.05))

plt.show()
Output:

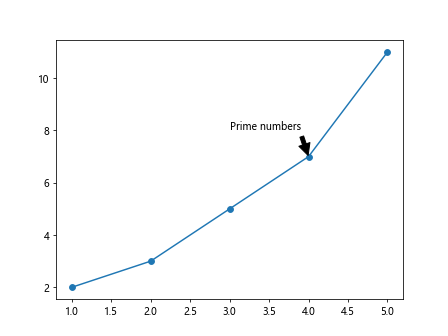
在这个示例中,我们在坐标点(4, 7)处添加了一个annotation box,文本内容为’Prime numbers’。arrowprops参数用于设置箭头的样式,包括箭头颜色和缩放比例。
2. 坐标系转换
有时候,我们需要在不同坐标系之间添加annotation box,比如在数据坐标系和图像坐标系之间进行转换。下面是一个示例,展示如何在不同坐标系之间使用annotation box。
import matplotlib.pyplot as plt

fig, ax = plt.subplots()

x = [1, 2, 3, 4, 5]
y = [2, 3, 5, 7, 11]

ax.plot(x, y, marker='o')

bbox_props = dict(boxstyle="rarrow,pad=0.3", fc="cyan", ec="b", lw=2)

ax.annotate('Prime numbers',
            xy=(4, 7), xycoords='data',
            xytext=(50, 300), textcoords='offset points',
            arrowprops=dict(arrowstyle="->",
                            connectionstyle="arc3,rad=0.3"),
            bbox=bbox_props)

plt.show()
Output:

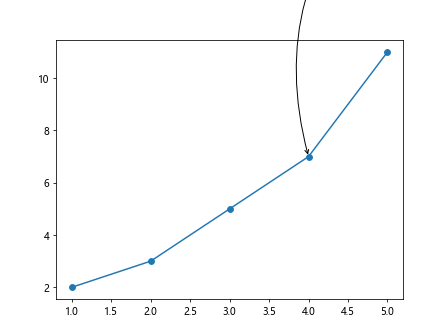
在这个示例中,我们在数据坐标系的点(4, 7)处添加了一个annotation box,箭头指向图像坐标系的坐标(50, 300)。
3. 自定义样式
Matplotlib允许我们自定义annotation box的样式,包括文本样式、边框样式和背景色。下面是一个示例,展示如何自定义annotation box的样式。
import matplotlib.pyplot as plt

x = [1, 2, 3, 4, 5]
y = [2, 3, 5, 7, 11]

plt.plot(x, y, marker='o')

bbox_props = dict(boxstyle="round,pad=0.3", fc="#FFD700", ec="b", lw=2)

plt.annotate('Prime numbers',
             xy=(4, 7),
             xytext=(3, 8),
             arrowprops=dict(facecolor='black', shrink=0.05),
             bbox=bbox_props)

plt.show()
Output:

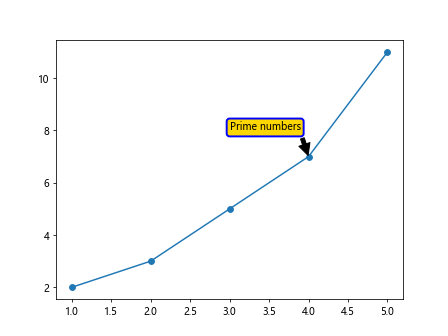
在这个示例中,我们使用了一个圆角矩形的边框样式,背景色为金色,边框颜色为蓝色。通过修改boxstyle、fc和ec参数,我们可以自定义annotation box的样式。
4. 多个annotation box
有时候,我们需要在同一个图表中添加多个annotation box,用于注释不同的数据点或区域。下面是一个示例,展示如何在图表中添加多个annotation box。
import matplotlib.pyplot as plt

x = [1, 2, 3, 4, 5]
y = [2, 3, 5, 7, 11]

plt.plot(x, y, marker='o')

plt.annotate('Prime numbers', xy=(2, 3), xytext=(1, 4),
             arrowprops=dict(facecolor='black', shrink=0.05))

plt.annotate('Prime numbers', xy=(4, 7), xytext=(3, 8),
             arrowprops=dict(facecolor='black', shrink=0.05))

plt.show()
Output:

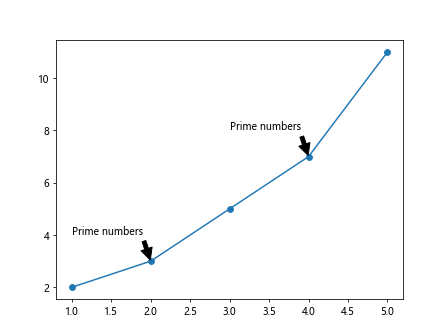
在这个示例中,我们在图表中的不同坐标点处添加了两个annotation box,分别用于注释不同的数据点。
通过以上示例,我们可以看到如何在Matplotlib中使用annotation box来标记和注释图表中的数据点。我们可以灵活地设置annotation box的样式和内容,使得图表更加易于理解和阅读。Matplotlib的annotation box功能为数据可视化提供了更多的可能性和灵感。
 极客教程
极客教程