Matplotlib ax annotate
Matplotlib 是一个用于绘制图形的 Python 库,而 ax.annotate() 是其中一个常用的函数,用于向图形中添加标签。在这篇文章中,我们将详细介绍如何使用 matplotlib 的 ax.annotate() 函数,并给出多个示例代码。
基本用法
首先,我们来看一下 ax.annotate() 函数的基本用法。这个函数的语法如下:
ax.annotate(text, xy, xytext, arrowprops)
其中,参数含义如下:
– text: 要显示的文本内容
– xy: 要标注的点的位置
– xytext: 文本的位置
– arrowprops: 箭头的设置
下面是一个简单的示例代码:
import matplotlib.pyplot as plt

fig, ax = plt.subplots()
ax.annotate('Example Annotation', xy=(0.5, 0.5), xytext=(0.2, 0.8),
            arrowprops=dict(facecolor='black', shrink=0.05))
plt.show()
Output:
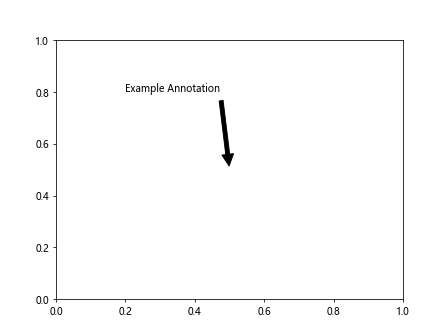
这段代码会在图形中间标注一段文本 ‘Example Annotation’,箭头指向该文本。
文本样式设置
在 ax.annotate() 函数中,可以通过设置参数来调整文本的样式,包括字体大小、颜色、加粗等。下面是一个示例代码:
import matplotlib.pyplot as plt

fig, ax = plt.subplots()
ax.annotate('Example Annotation', xy=(0.5, 0.5), xytext=(0.2, 0.8),
            arrowprops=dict(facecolor='black', shrink=0.05),
            fontsize=12, color='red', fontweight='bold')
plt.show()
Output:
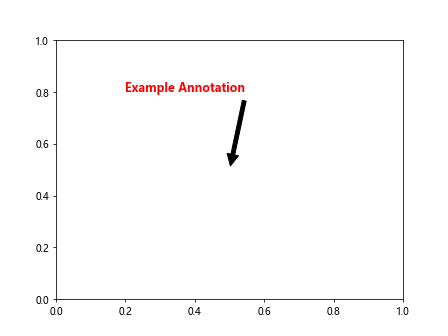
这段代码会将文本的字体设置为大小为12,颜色为红色,加粗显示。
箭头样式设置
在 ax.annotate() 函数中,还可以通过设置 arrowprops 参数来调整箭头的样式,包括颜色、线型、箭头形状等。下面是一个示例代码:
import matplotlib.pyplot as plt

fig, ax = plt.subplots()
ax.annotate('Example Annotation', xy=(0.5, 0.5), xytext=(0.2, 0.8),
            arrowprops=dict(facecolor='black', shrink=0.05, linestyle='dashed',
                            arrowstyle='fancy'))
plt.show()
这段代码将箭头的颜色设置为黑色,线型为虚线,箭头形状为 fancy。
多个标注
在一个图形中,也可以同时标注多个点,只需要在 ax.annotate() 函数中多次调用即可。下面是一个示例代码:
import matplotlib.pyplot as plt

fig, ax = plt.subplots()
ax.annotate('Example Annotation 1', xy=(0.2, 0.2), xytext=(0.1, 0.5),
            arrowprops=dict(facecolor='black', shrink=0.05))
ax.annotate('Example Annotation 2', xy=(0.5, 0.5), xytext=(0.4, 0.8),
            arrowprops=dict(facecolor='black', shrink=0.05))
plt.show()
Output:
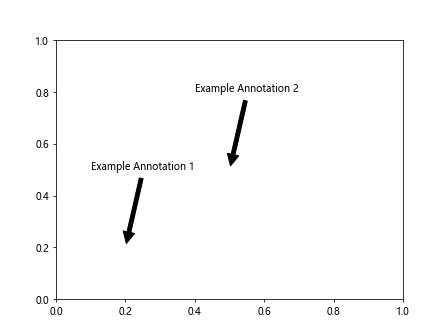
这段代码会在图形中同时标注两个点,分别显示 ‘Example Annotation 1’ 和 ‘Example Annotation 2’。
偏移设置
在 ax.annotate() 函数中,还可以设置偏移量,使得文本位置稍微偏离标注点。下面是一个示例代码:
import matplotlib.pyplot as plt

fig, ax = plt.subplots()
ax.annotate('Example Annotation', xy=(0.5, 0.5), xytext=(0.5, 0.6),
            arrowprops=dict(facecolor='black', shrink=0.05),
            xycoords='data', textcoords='data',
            arrowprops=dict(arrowstyle="->", connectionstyle="arc3"))
plt.show()
这段代码将文本的位置稍微向上偏移,使得文本显示更加清晰。
自定义箭头位置
有时候,箭头的位置不必须要指向标注点,也可以自定义箭头的位置。下面是一个示例代码:
import matplotlib.pyplot as plt

fig, ax = plt.subplots()
ax.annotate('Example Annotation', xy=(0.5, 0.5), xytext=(0.2, 0.8),
            arrowprops=dict(arrowstyle="->", connectionstyle="angle,angleA=90,angleB=0,rad=10"))
plt.show()
Output:
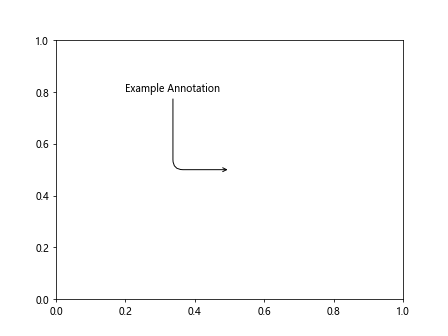
这段代码将箭头的位置设置为固定值,而不是直接指向标注点。
综合示例
下面是一个综合示例代码,演示了如何使用 ax.annotate() 函数进行复杂的标注设置:
import matplotlib.pyplot as plt

fig, ax = plt.subplots()
ax.annotate('Example Annotation 1', xy=(0.2, 0.2), xytext=(0.1, 0.5),
            arrowprops=dict(facecolor='black', shrink=0.05))
ax.annotate('Example Annotation 2', xy=(0.5, 0.5), xytext=(0.4, 0.8),
            arrowprops=dict(facecolor='black', shrink=0.05),
            fontsize=12, color='red', fontweight='bold')
ax.annotate('Example Annotation 3', xy=(0.8, 0.8), xytext=(0.9, 0.5),
            arrowprops=dict(arrowstyle="->", connectionstyle="angle,angleA=90,angleB=0,rad=10"))
plt.show()
Output:
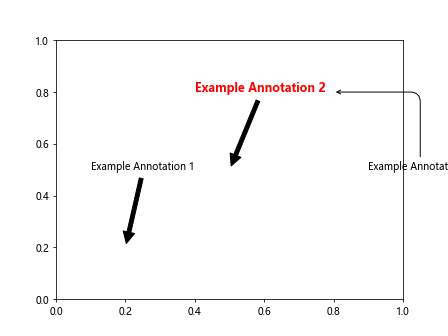
这段代码同时展示了多个不同样式的标注,包括不同的文本样式、箭头样式、偏移设置等。
总结
通过本文的介绍,读者应该对 matplotlib 的 ax.annotate() 函数有了更深入的了解。这个函数在实际绘图中非常实用,可以帮助我们清晰地标注图形中的重要信息。
 极客教程
极客教程