Matplotlib注释位置
参考:matplotlib annotate position
Matplotlib是一个Python的绘图库,提供了丰富的绘图功能,包括直方图、散点图、折线图等。在绘制图表时,我们经常需要在图表中添加注释来说明数据或者突出某些重要信息。正确的注释位置可以使图表更加清晰和易读。本文将详细介绍Matplotlib中如何调整注释的位置。
1. 设置注释的绝对位置
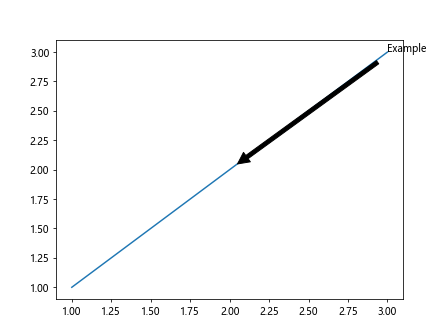
在Matplotlib中,可以使用annotate方法来添加注释。该方法的参数中包含了xy参数,表示注释的位置。我们可以通过设置xy参数来调整注释的绝对位置。
import matplotlib.pyplot as plt

plt.plot([1, 2, 3], [1, 2, 3])
plt.annotate('Example', xy=(2, 2), xytext=(3, 3),
             arrowprops=dict(facecolor='black', shrink=0.05))
plt.show()
Output:
2. 设置相对于数据点的偏移位置
除了设置注释的绝对位置外,还可以设置相对于数据点的偏移位置。我们可以通过设置xycoords和textcoords参数来实现。
import matplotlib.pyplot as plt

plt.plot([1, 2, 3], [1, 2, 3])
plt.annotate('Example', xy=(2, 2), xycoords='data', textcoords='offset points',
             arrowprops=dict(facecolor='black', shrink=0.05))
plt.show()
3. 设置相对于轴的偏移位置
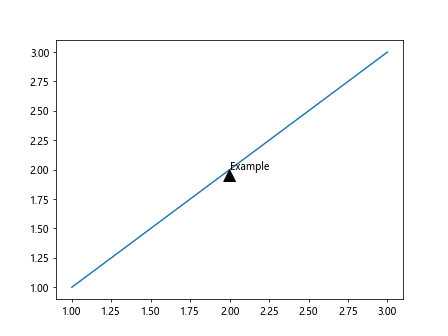
有时候我们希望注释相对于整个坐标轴的位置进行设置,可以通过设置xycoords和textcoords参数为axes fraction来实现。
import matplotlib.pyplot as plt

plt.plot([1, 2, 3], [1, 2, 3])
plt.annotate('Example', xy=(0.5, 0.5), xycoords='axes fraction', textcoords='axes fraction',
             arrowprops=dict(facecolor='black', shrink=0.05))
plt.show()
Output:
4. 设置相对于图像的偏移位置
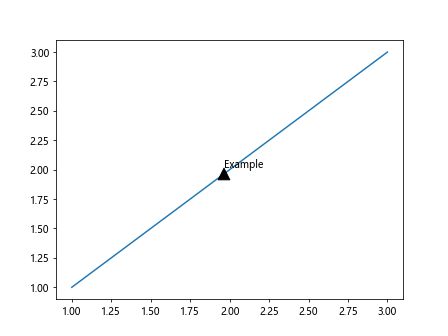
有时候我们希望注释相对于整个图像的位置进行设置,可以通过设置xycoords和textcoords参数为figure fraction来实现。
import matplotlib.pyplot as plt

plt.plot([1, 2, 3], [1, 2, 3])
plt.annotate('Example', xy=(0.5, 0.5), xycoords='figure fraction', textcoords='figure fraction',
             arrowprops=dict(facecolor='black', shrink=0.05))
plt.show()
Output:
5. 设置箭头的样式
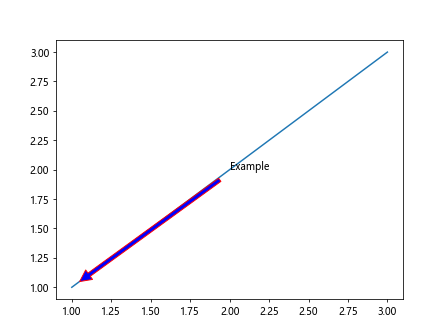
在注释中,我们可以设置箭头的样式,包括颜色、缩进等。可以通过arrowprops参数来进行设置。
import matplotlib.pyplot as plt

plt.plot([1, 2, 3], [1, 2, 3])
plt.annotate('Example', xy=(1, 1), xytext=(2, 2),
             arrowprops=dict(facecolor='blue', edgecolor='red', shrink=0.05))
plt.show()
Output:
6. 设置文字的样式
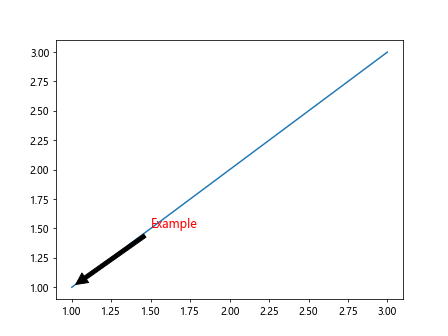
除了注释的位置和箭头样式外,我们还可以设置文字的样式,包括字体、大小、颜色等。
import matplotlib.pyplot as plt

plt.plot([1, 2, 3], [1, 2, 3])
plt.annotate('Example', xy=(1, 1), xytext=(1.5, 1.5),
             arrowprops=dict(facecolor='black', shrink=0.05),
             fontsize=12, color='red', style='italic')
plt.show()
Output:
7. 设置注释的背景色
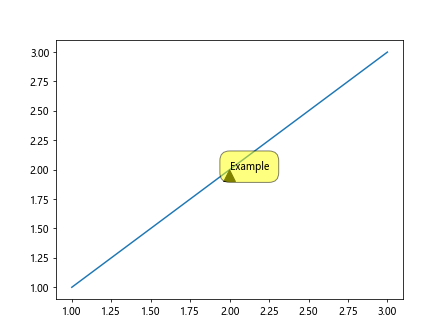
有时候我们需要给注释添加背景色来突出注释内容,可以通过设置bbox参数来实现。
import matplotlib.pyplot as plt

plt.plot([1, 2, 3], [1, 2, 3])
plt.annotate('Example', xy=(2, 2), xytext=(2, 2),
             arrowprops=dict(facecolor='black', shrink=0.05),
             bbox=dict(boxstyle='round,pad=1', fc='yellow', alpha=0.5))
plt.show()
Output:
8. 设置注释的可见性
有时候我们需要根据条件来控制注释的可见性,可以通过set_visible方法来实现。
import matplotlib.pyplot as plt

fig, ax = plt.subplots()
line, = ax.plot([1, 2, 3], [1, 2, 3])

annot = ax.annotate('Example', xy=(2, 2), xytext=(2, 2),
                    arrowprops=dict(facecolor='black', shrink=0.05))

annot.set_visible(False)

plt.show()
Output:
9. 设置注释的偏移
我们还可以设置注释文本的偏移,可以通过设置textcoords和offset参数来实现。
import matplotlib.pyplot as plt

plt.plot([1, 2, 3], [1, 2, 3])
plt.annotate('Example', xy=(2, 2), xytext=(2, 2),
             arrowprops=dict(facecolor='black', shrink=0.05),
             textcoords='offset points', offset=(20, 20))
plt.show()
10. 设置注释的旋转角度
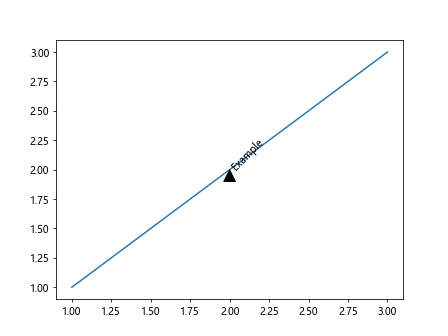
有时候我们需要旋转注释文本,可以通过设置rotation参数来实现。
import matplotlib.pyplot as plt

plt.plot([1, 2, 3], [1, 2, 3])
plt.annotate('Example', xy=(2, 2), xytext=(2, 2),
             arrowprops=dict(facecolor='black', shrink=0.05),
             rotation=45)
plt.show()
Output:
本文介绍了Matplotlib中如何调整注释的位置,包括设置绝对位置、相对位置、箭头样式、文字样式、背景色等。通过灵活运用这些功能,可以使图表更加清晰和易读。
 极客教程
极客教程