Matplotlib 中的注释旋转:如何使用 annotate 和 rotate 创建动态图表标注
Matplotlib 是 Python 中最流行的数据可视化库之一,它提供了丰富的功能来创建各种类型的图表和图形。在数据可视化中,添加注释是一种重要的技术,可以帮助解释数据点或突出显示特定信息。本文将深入探讨 Matplotlib 中的 annotate 函数以及如何旋转注释,以创建更具吸引力和信息丰富的图表。
1. Matplotlib annotate 函数简介
annotate 函数是 Matplotlib 中用于添加注释的主要工具。它允许用户在图表上的任意位置添加文本、箭头或其他标记。annotate 函数的基本语法如下:
import matplotlib.pyplot as plt

plt.figure(figsize=(8, 6))
plt.plot([1, 2, 3, 4], [1, 4, 2, 3], 'ro-')
plt.annotate('Data point', xy=(2, 4), xytext=(3, 4.5),
             arrowprops=dict(facecolor='black', shrink=0.05))
plt.title('How to use annotate in Matplotlib - how2matplotlib.com')
plt.show()
Output:
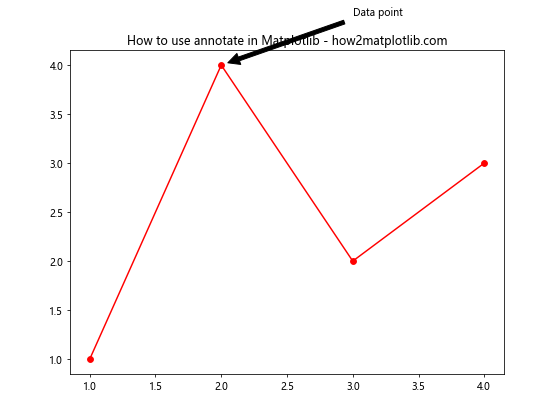
在这个例子中,我们创建了一个简单的线图,并在数据点 (2, 4) 处添加了一个注释。注释文本 “Data point” 被放置在 (3, 4.5) 的位置,并用一个箭头指向数据点。
annotate 函数的主要参数包括:
- s:注释文本
- xy:要标注的点的坐标
- xytext:文本放置的坐标
- arrowprops:箭头的属性字典
2. 旋转注释文本
有时,我们可能需要旋转注释文本以适应图表布局或突出显示某些信息。可以使用 rotation 参数来实现这一点:
import matplotlib.pyplot as plt

plt.figure(figsize=(8, 6))
plt.plot([1, 2, 3, 4], [1, 4, 2, 3], 'bo-')
plt.annotate('Rotated annotation', xy=(3, 2), xytext=(3.5, 2.5),
             rotation=45, va='bottom',
             arrowprops=dict(facecolor='red', shrink=0.05))
plt.title('Rotated annotation example - how2matplotlib.com')
plt.show()
Output:
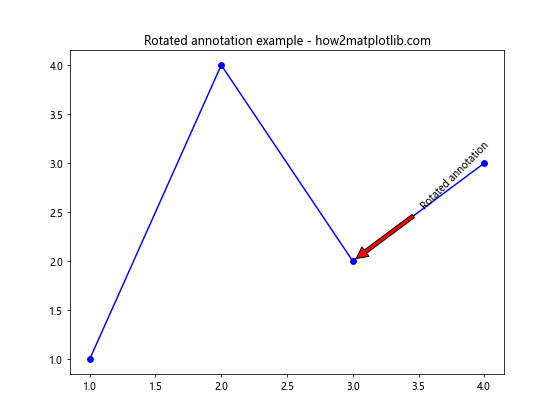
在这个例子中,我们将注释文本旋转了 45 度。rotation 参数接受度数作为输入,可以是正值(逆时针旋转)或负值(顺时针旋转)。
3. 使用 transform 参数
transform 参数允许我们在不同的坐标系统中指定注释的位置。这在创建复杂的图表布局时特别有用:
import matplotlib.pyplot as plt

fig, ax = plt.subplots(figsize=(8, 6))
ax.plot([1, 2, 3, 4], [1, 4, 2, 3], 'go-')
ax.annotate('Transformed annotation', xy=(0.5, 0.5), xytext=(0.7, 0.7),
            xycoords='axes fraction', textcoords='axes fraction',
            arrowprops=dict(facecolor='blue', shrink=0.05))
ax.set_title('Using transform in annotate - how2matplotlib.com')
plt.show()
Output:
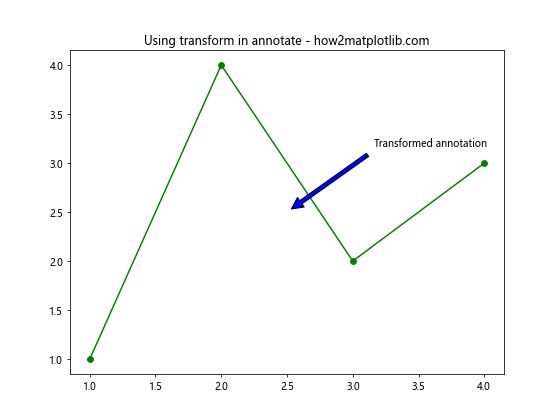
在这个例子中,我们使用 ‘axes fraction’ 坐标系统来指定注释的位置。这意味着坐标值是相对于轴的大小的比例,而不是数据坐标。
4. 自定义箭头样式
arrowprops 参数提供了丰富的选项来自定义连接文本和数据点的箭头:
import matplotlib.pyplot as plt

plt.figure(figsize=(8, 6))
plt.plot([1, 2, 3, 4], [1, 4, 2, 3], 'ro-')
plt.annotate('Custom arrow', xy=(2, 4), xytext=(3, 4.5),
             arrowprops=dict(facecolor='green', shrink=0.05, width=4, headwidth=12, headlength=10),
             bbox=dict(boxstyle="round,pad=0.3", fc="yellow", ec="b", lw=2))
plt.title('Custom arrow style - how2matplotlib.com')
plt.show()
Output:
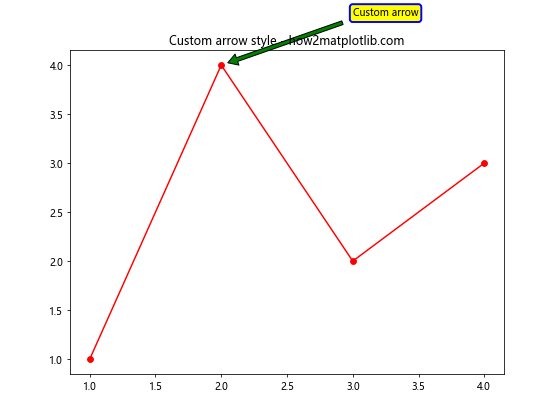
这个例子展示了如何自定义箭头的颜色、宽度和头部大小,以及如何为注释文本添加背景框。
5. 多行注释
对于较长的注释,我们可能需要使用多行文本:
import matplotlib.pyplot as plt

plt.figure(figsize=(8, 6))
plt.plot([1, 2, 3, 4], [1, 4, 2, 3], 'bo-')
plt.annotate('Multi-line\nannotation\nexample', xy=(3, 2), xytext=(3.5, 3),
             ha='left', va='center',
             arrowprops=dict(facecolor='red', shrink=0.05))
plt.title('Multi-line annotation - how2matplotlib.com')
plt.show()
Output:
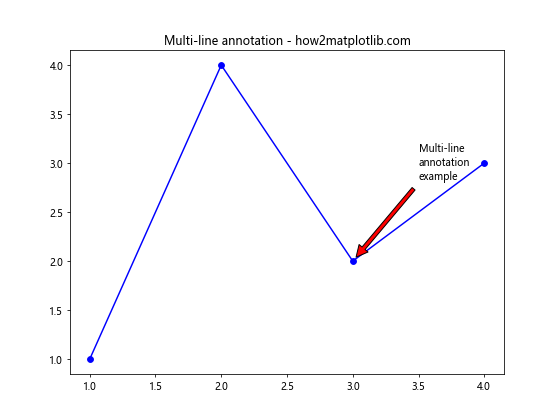
在这个例子中,我们使用 ‘\n’ 来创建多行注释。ha 和 va 参数用于控制文本的水平和垂直对齐。
6. 动态注释位置
有时,我们可能需要根据数据动态确定注释的位置:
import matplotlib.pyplot as plt
import numpy as np

x = np.linspace(0, 10, 100)
y = np.sin(x)

plt.figure(figsize=(10, 6))
plt.plot(x, y)

max_index = np.argmax(y)
plt.annotate(f'Maximum: {y[max_index]:.2f}', xy=(x[max_index], y[max_index]),
             xytext=(x[max_index]+1, y[max_index]),
             arrowprops=dict(facecolor='black', shrink=0.05))

plt.title('Dynamic annotation placement - how2matplotlib.com')
plt.show()
Output:
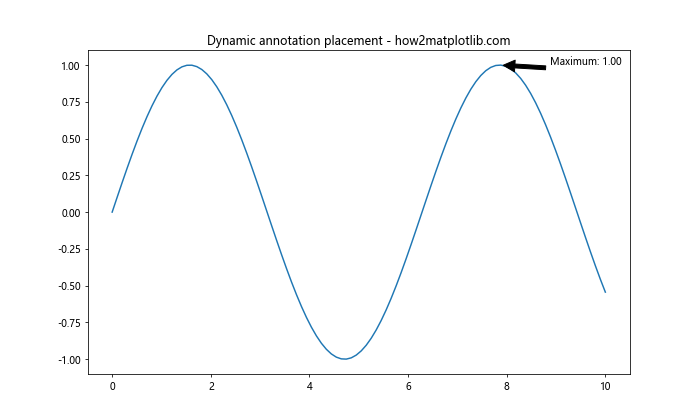
这个例子展示了如何在正弦波的最高点添加动态注释。
7. 注释组
当需要添加多个相关的注释时,可以使用注释组来保持代码的整洁:
import matplotlib.pyplot as plt
from matplotlib.offsetbox import AnnotationBbox, TextArea

fig, ax = plt.subplots(figsize=(8, 6))
ax.plot([1, 2, 3, 4], [1, 4, 2, 3], 'ro-')

for x, y in zip([1, 2, 3, 4], [1, 4, 2, 3]):
    offsetbox = TextArea(f'({x}, {y})')
    ab = AnnotationBbox(offsetbox, (x, y),
                        xybox=(0, 40),
                        xycoords='data',
                        boxcoords="offset points",
                        arrowprops=dict(arrowstyle="->"))
    ax.add_artist(ab)

ax.set_title('Annotation group example - how2matplotlib.com')
plt.show()
Output:
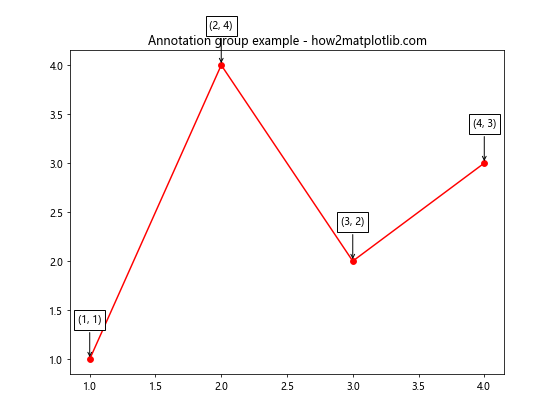
这个例子为每个数据点创建了一个注释,显示其坐标。
8. 旋转箭头
除了旋转文本,我们还可以旋转整个注释,包括箭头:
import matplotlib.pyplot as plt
import numpy as np

plt.figure(figsize=(8, 6))
plt.plot([1, 2, 3, 4], [1, 4, 2, 3], 'bo-')

for i, (x, y) in enumerate(zip([1, 2, 3, 4], [1, 4, 2, 3])):
    angle = i * 90  # 每个注释旋转不同的角度
    plt.annotate(f'Point {i+1}', xy=(x, y), xytext=(30, 30),
                 textcoords="offset points",
                 rotation=angle,
                 ha='left', va='bottom',
                 bbox=dict(boxstyle='round,pad=0.5', fc='yellow', alpha=0.5),
                 arrowprops=dict(arrowstyle='->', connectionstyle='arc3,rad=0'))

plt.title('Rotated annotations with arrows - how2matplotlib.com')
plt.show()
Output:
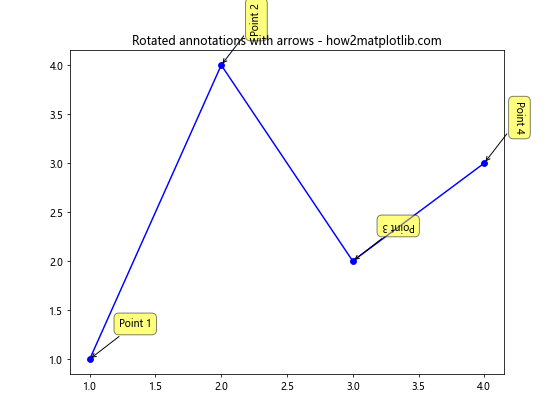
这个例子为每个数据点创建了一个旋转的注释,角度从 0 到 270 度不等。
9. 使用 LaTeX 公式
Matplotlib 支持在注释中使用 LaTeX 公式,这对于添加数学表达式特别有用:
import matplotlib.pyplot as plt

plt.figure(figsize=(8, 6))
plt.plot([1, 2, 3, 4], [1, 4, 2, 3], 'ro-')
plt.annotate(r'\sum_{i=1}^n x_i = \frac{n(n+1)}{2}', xy=(2, 4), xytext=(3, 4.5),
             arrowprops=dict(facecolor='black', shrink=0.05))
plt.title('LaTeX formula in annotation - how2matplotlib.com')
plt.show()
Output:
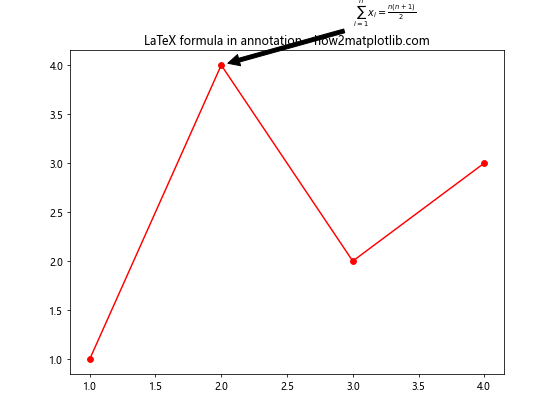
这个例子在图表中添加了一个包含 LaTeX 公式的注释。注意使用原始字符串(r”)来避免转义字符的问题。
10. 交互式注释
使用 Matplotlib 的交互式后端,我们可以创建动态的、可移动的注释:
import matplotlib.pyplot as plt
from matplotlib.offsetbox import AnnotationBbox, TextArea
from matplotlib.patches import Circle

fig, ax = plt.subplots(figsize=(8, 6))
ax.set_xlim(0, 10)
ax.set_ylim(0, 10)

circle = Circle((5, 5), 0.1, fc='red')
ab = AnnotationBbox(circle, (5, 5), xycoords='data',
                    xybox=(0, 40), boxcoords="offset points",
                    arrowprops=dict(arrowstyle="->"))
ax.add_artist(ab)

ax.set_title('Interactive annotation - how2matplotlib.com')
plt.show()
这个例子创建了一个可以用鼠标拖动的注释。注意,要使其工作,你需要使用支持交互的 Matplotlib 后端。
11. 时间序列数据的注释
在处理时间序列数据时,注释可以帮助突出显示重要的时间点:
import matplotlib.pyplot as plt
import pandas as pd

dates = pd.date_range(start='2023-01-01', end='2023-12-31', freq='D')
values = pd.Series(range(len(dates))) + pd.Series(range(len(dates))).cumsum()

fig, ax = plt.subplots(figsize=(12, 6))
ax.plot(dates, values)

important_date = pd.Timestamp('2023-07-01')
important_value = values[dates == important_date].values[0]

ax.annotate('Important event', xy=(important_date, important_value),
            xytext=(10, 10), textcoords='offset points',
            arrowprops=dict(arrowstyle="->", connectionstyle="arc3,rad=.2"))

ax.set_title('Time series annotation - how2matplotlib.com')
plt.show()
Output:
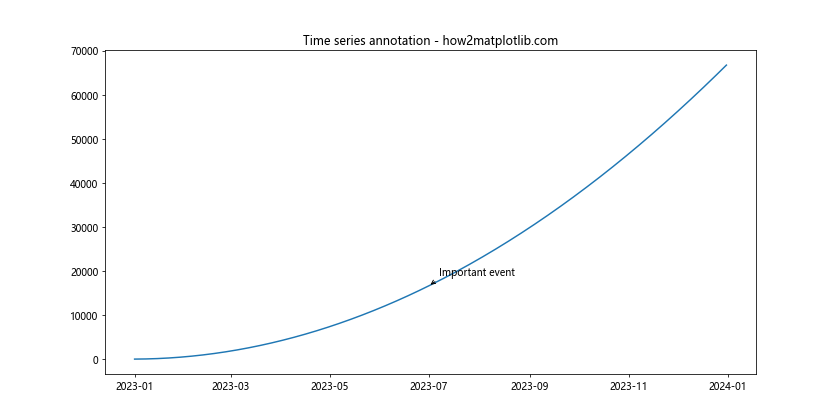
这个例子展示了如何在时间序列图表中添加注释,突出显示特定日期的重要事件。
12. 注释样式的一致性
在一个图表中使用多个注释时,保持样式的一致性很重要:
import matplotlib.pyplot as plt

def consistent_annotate(ax, text, xy, xytext):
    return ax.annotate(text, xy=xy, xytext=xytext,
                       xycoords='data', textcoords='offset points',
                       fontsize=10, ha='center', va='bottom',
                       bbox=dict(boxstyle='round,pad=0.5', fc='yellow', alpha=0.5),
                       arrowprops=dict(arrowstyle='->', connectionstyle='arc3,rad=0.3'))

fig, ax = plt.subplots(figsize=(10, 6))
x = [1, 2, 3, 4, 5]
y = [2, 4, 1, 3, 5]
ax.plot(x, y, 'bo-')

consistent_annotate(ax, 'Point A', (2, 4), (10, 10))
consistent_annotate(ax, 'Point B', (4, 3), (-10, 10))
consistent_annotate(ax, 'Point C', (5, 5), (10, -10))

ax.set_title('Consistent annotation style - how2matplotlib.com')
plt.show()
Output:
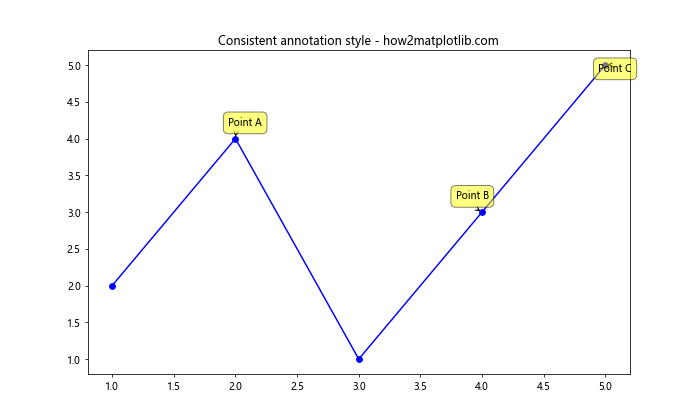
这个例子定义了一个函数来创建具有一致样式的注释,然后在图表的不同位置使用这个函数。
13. 在子图中使用注释
当使用子图时,我们需要确保注释被添加到正确的轴上:
import matplotlib.pyplot as plt

fig, (ax1, ax2) = plt.subplots(1, 2, figsize=(12, 5))

ax1.plot([1, 2, 3, 4], [1, 4, 2, 3], 'ro-')
ax1.annotate('Subplot 1', xy=(2, 4), xytext=(3, 4.5),
             arrowprops=dict(facecolor='black', shrink=0.05))
ax1.set_title('Subplot 1 - how2matplotlib.com')

ax2.plot([1, 2, 3, 4], [4, 3, 2, 1], 'bo-')
ax2.annotate('Subplot 2', xy=(3, 2), xytext=(2, 1.5),
             arrowprops=dict(facecolor='red', shrink=0.05))
ax2.set_title('Subplot 2 - how2matplotlib.com')

plt.tight_layout()
plt.show()
Output:
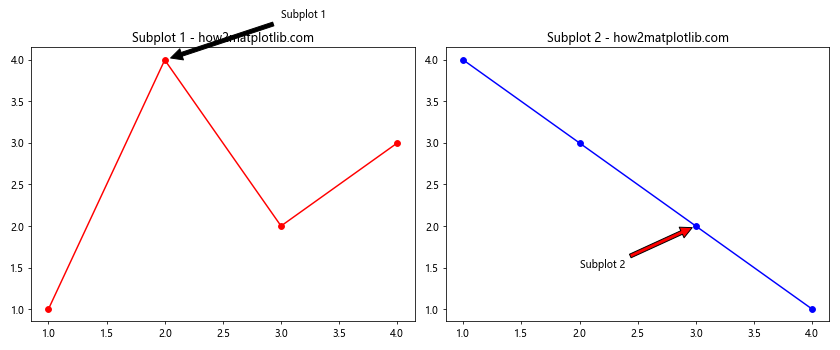
这个例子展示了如何在包含两个子图的图表中为每个子图添加注释。
14. 注释中的颜色渐变
我们可以使用颜色渐变来增强注释的视觉效果:
import matplotlib.pyplot as plt
from matplotlib.patheffects import withStroke
from matplotlib.colors import LinearSegmentedColormap

fig, ax = plt.subplots(figsize=(8, 6))
ax.plot([1, 2, 3, 4], [1, 4, 2, 3], 'ro-')

cmap = LinearSegmentedColormap.from_list("", ["yellow", "red"])
t = ax.annotate('Gradient color', xy=(2, 4), xytext=(3, 4.5),
                arrowprops=dict(arrowstyle="->", connectionstyle="arc3,rad=.2"),
                bbox=dict(boxstyle="round", fc="w"),
                path_effects=[withStroke(linewidth=3, foreground="none")])

t.set_backgroundcolor(cmap(0.5))
t.get_bbox_patch().set_facecolor(cmap(0.5))

ax.set_title('Gradient color annotation - how2matplotlib.com')
plt.show()
Output:
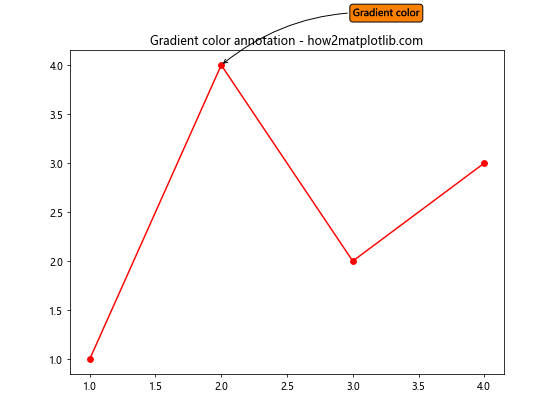
这个例子创建了一个带有颜色渐变背景的注释,从黄色过渡到红色。
15. 动态调整注释位置
在某些情况下,我们可能需要根据图表的内容动态调整注释的位置,以避免重叠:
import matplotlib.pyplot as plt
import numpy as np

def smart_annotate(ax, text, xy, xytext=None):
    if xytext is None:
        xytext = (0, 20)

    annotation = ax.annotate(text, xy, xytext=xytext, textcoords="offset points",
                             ha='center', va='bottom',
                             bbox=dict(boxstyle='round,pad=0.5', fc='yellow', alpha=0.5),
                             arrowprops=dict(arrowstyle='->', connectionstyle='arc3,rad=0'))

    # 检查注释是否超出轴的范围
    fig = ax.get_figure()
    fig.canvas.draw()
    bbox = annotation.get_window_extent()
    if bbox.ymax > ax.get_window_extent().ymax:
        new_xytext = (xytext[0], -xytext[1])  # 将注释移到数据点下方
        annotation.xytext = new_xytext
        annotation.set_va('top')

    return annotation

fig, ax = plt.subplots(figsize=(8, 6))
x = np.linspace(0, 10, 100)
y = np.sin(x)
ax.plot(x, y)

smart_annotate(ax, 'Peak', (np.pi/2, 1))
smart_annotate(ax, 'Trough', (3*np.pi/2, -1))

ax.set_title('Smart annotation placement - how2matplotlib.com')
plt.show()
Output:
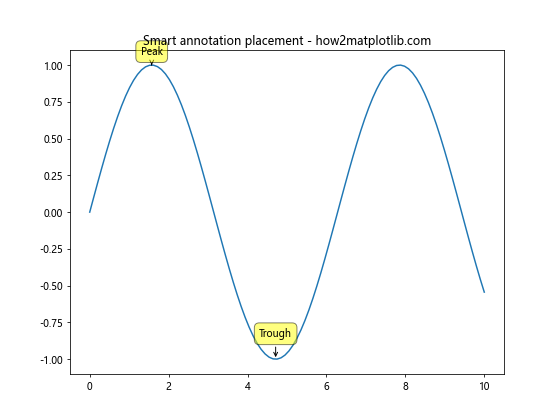
这个例子定义了一个智能注释函数,它会检查注释是否超出图表范围,并在必要时调整位置。
16. 使用注释创建图例
虽然 Matplotlib 有内置的图例功能,但有时使用注释创建自定义图例可能更灵活:
import matplotlib.pyplot as plt
import numpy as np

fig, ax = plt.subplots(figsize=(10, 6))

x = np.linspace(0, 10, 100)
y1 = np.sin(x)
y2 = np.cos(x)

line1, = ax.plot(x, y1, 'b-')
line2, = ax.plot(x, y2, 'r-')

ax.annotate('Sin curve', xy=(5, 0.5), xytext=(6, 0.7),
            arrowprops=dict(arrowstyle='->', color='blue'),
            color='blue')
ax.annotate('Cos curve', xy=(5, -0.5), xytext=(6, -0.7),
            arrowprops=dict(arrowstyle='->', color='red'),
            color='red')

ax.set_title('Custom legend using annotations - how2matplotlib.com')
plt.show()
Output:
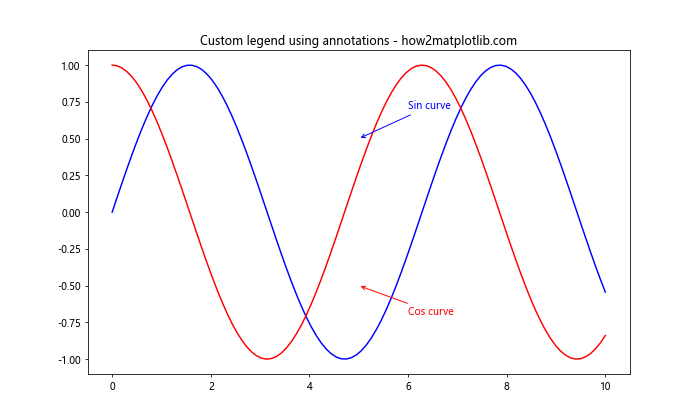
这个例子使用注释创建了一个自定义图例,为正弦和余弦曲线添加说明。
17. 3D 图表中的注释
Matplotlib 也支持在 3D 图表中添加注释,尽管这需要一些额外的考虑:
import matplotlib.pyplot as plt
from mpl_toolkits.mplot3d import Axes3D
import numpy as np

fig = plt.figure(figsize=(10, 8))
ax = fig.add_subplot(111, projection='3d')

# 创建一些示例数据
x = np.linspace(-5, 5, 100)
y = np.linspace(-5, 5, 100)
X, Y = np.meshgrid(x, y)
Z = np.sin(np.sqrt(X**2 + Y**2))

# 绘制 3D 表面
surf = ax.plot_surface(X, Y, Z, cmap='viridis')

# 添加 3D 注释
ax.text(0, 0, 1, "Peak", fontsize=12, color='red')
ax.text(4, 4, -0.5, "Trough", fontsize=12, color='blue')

ax.set_title('3D annotation example - how2matplotlib.com')
plt.show()
Output:
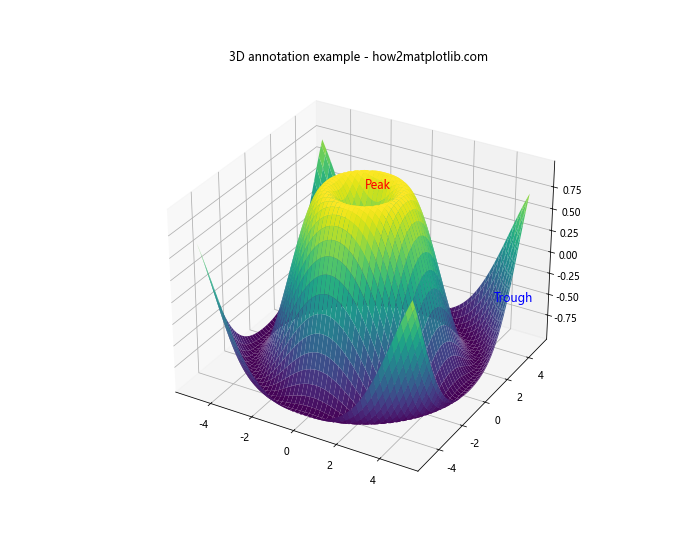
这个例子展示了如何在 3D 图表中添加文本注释。注意,在 3D 空间中,我们使用 ax.text() 而不是 ax.annotate(),因为后者在 3D 轴上的行为可能不如预期。
18. 注释动画
我们可以创建动画注释来突出显示数据的变化:
import matplotlib.pyplot as plt
import matplotlib.animation as animation
import numpy as np

fig, ax = plt.subplots(figsize=(8, 6))

x = np.linspace(0, 2*np.pi, 100)
line, = ax.plot(x, np.sin(x))

annotation = ax.annotate('', xy=(0, 0), xytext=(20, 20),
                         textcoords="offset points",
                         bbox=dict(boxstyle="round", fc="w"),
                         arrowprops=dict(arrowstyle="->"))

def animate(i):
    line.set_ydata(np.sin(x + i/10.0))
    x_pos = i/10.0 % (2*np.pi)
    y_pos = np.sin(x_pos)
    annotation.xy = (x_pos, y_pos)
    annotation.set_text(f'Phase: {x_pos:.2f}\nValue: {y_pos:.2f}')
    return line, annotation

ani = animation.FuncAnimation(fig, animate, frames=100, interval=50, blit=True)

ax.set_title('Animated annotation - how2matplotlib.com')
plt.show()
Output:
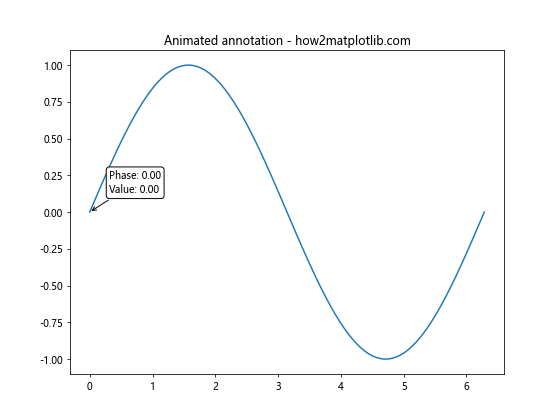
这个例子创建了一个动画,其中注释跟随正弦波的峰值移动,并实时更新其位置和文本。
19. 使用注释创建文本框
注释不仅可以用于指向特定的数据点,还可以用于创建独立的文本框:
import matplotlib.pyplot as plt

fig, ax = plt.subplots(figsize=(8, 6))

ax.plot([1, 2, 3, 4], [1, 4, 2, 3], 'ro-')

textstr = '\n'.join((
    r'\mu=1.5',
    r'\mathrm{median}=2.5',
    r'\sigma=1.2'))

ax.annotate(textstr, xy=(0.05, 0.95), xycoords='axes fraction',
            bbox=dict(boxstyle='round', facecolor='wheat', alpha=0.5),
            verticalalignment='top')

ax.set_title('Text box using annotation - how2matplotlib.com')
plt.show()
Output:
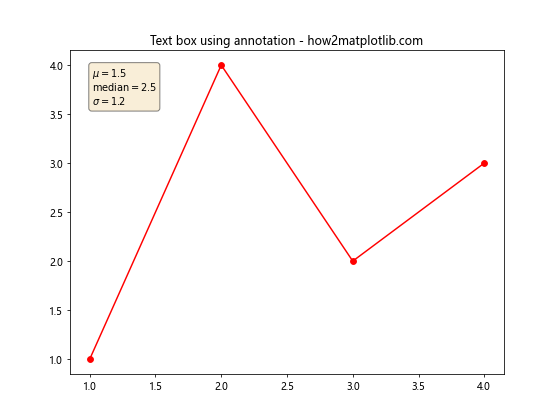
这个例子使用注释创建了一个包含多行文本的文本框,位于图表的左上角。
20. 注释样式的参数化
为了使代码更加模块化和可重用,我们可以将注释样式参数化:
import matplotlib.pyplot as plt

def create_annotation(ax, text, xy, xytext, style='default'):
    styles = {
        'default': dict(
            bbox=dict(boxstyle='round', facecolor='wheat', alpha=0.5),
            arrowprops=dict(arrowstyle='->'),
        ),
        'fancy': dict(
            bbox=dict(boxstyle='rarrow', facecolor='lightblue', edgecolor='blue'),
            arrowprops=dict(arrowstyle='fancy', connectionstyle='arc3,rad=.2', color='red'),
        ),
        'simple': dict(
            bbox=None,
            arrowprops=dict(arrowstyle='-'),
        )
    }

    style_params = styles.get(style, styles['default'])
    return ax.annotate(text, xy, xytext, **style_params)

fig, ax = plt.subplots(figsize=(10, 6))
ax.plot([1, 2, 3, 4], [1, 4, 2, 3], 'ro-')

create_annotation(ax, 'Default style', (2, 4), (3, 4.5))
create_annotation(ax, 'Fancy style', (3, 2), (4, 2.5), style='fancy')
create_annotation(ax, 'Simple style', (1, 1), (0.5, 1.5), style='simple')

ax.set_title('Parameterized annotation styles - how2matplotlib.com')
plt.show()
Output:
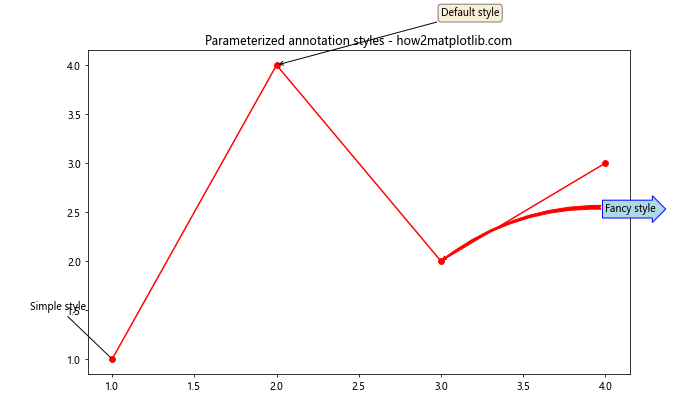
这个例子定义了一个函数,可以根据预定义的样式创建不同外观的注释,使得在整个项目中保持一致的注释样式变得更加容易。
总结起来,Matplotlib 的 annotate 函数是一个强大而灵活的工具,可以大大增强数据可视化的表现力和信息量。通过旋转、自定义样式、动态定位等技术,我们可以创建出既美观又富有信息的图表注释。在实际应用中,合理使用这些技术可以帮助读者更好地理解和解释数据,从而提高数据可视化的整体质量和效果。
 极客教程
极客教程