Matplotlib中如何设置注释文本的字体大小
参考:matplotlib annotate font size
Matplotlib是Python中强大的数据可视化库,它提供了丰富的绘图功能。在数据可视化过程中,为图表添加注释是一种常见的需求,而调整注释文本的字体大小则可以让图表更加清晰易读。本文将详细介绍如何在Matplotlib中设置注释文本的字体大小,包括使用annotate()函数、text()函数以及全局字体设置等多种方法。
1. 使用annotate()函数设置字体大小
annotate()函数是Matplotlib中用于添加注释的主要方法。它提供了多种参数来控制注释的样式,其中fontsize参数可以直接设置注释文本的字体大小。
1.1 基本用法
以下是一个简单的示例,展示如何使用annotate()函数添加注释并设置字体大小:
import matplotlib.pyplot as plt

fig, ax = plt.subplots()
ax.plot([1, 2, 3, 4], [1, 4, 2, 3])
ax.annotate('Peak', xy=(2, 4), xytext=(3, 4.5),
            fontsize=16,
            arrowprops=dict(facecolor='black', shrink=0.05))

plt.title('How to set font size in Matplotlib annotations - how2matplotlib.com')
plt.show()
Output:
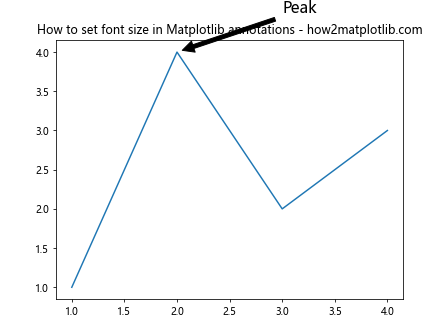
在这个例子中,我们使用fontsize=16来设置注释文本”Peak”的字体大小为16点。xy参数指定了箭头的指向位置,xytext参数指定了文本的位置。
1.2 使用相对大小
除了使用绝对的点数,我们还可以使用相对大小来设置字体:
import matplotlib.pyplot as plt

fig, ax = plt.subplots()
ax.plot([1, 2, 3, 4], [1, 4, 2, 3])
ax.annotate('Small', xy=(1, 1), fontsize='small')
ax.annotate('Medium', xy=(2, 4), fontsize='medium')
ax.annotate('Large', xy=(4, 3), fontsize='large')

plt.title('Relative font sizes in annotations - how2matplotlib.com')
plt.show()
Output:
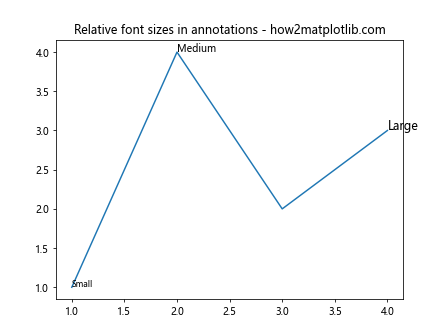
这个例子展示了如何使用’small’、’medium’和’large’等相对大小来设置注释文本的字体大小。这种方法的优点是可以根据整体图表的大小自动调整字体大小。
1.3 使用数值倍数
我们还可以使用数值倍数来设置字体大小,这种方法会相对于默认字体大小进行缩放:
import matplotlib.pyplot as plt

fig, ax = plt.subplots()
ax.plot([1, 2, 3, 4], [1, 4, 2, 3])
ax.annotate('0.8x', xy=(1, 1), fontsize=0.8)
ax.annotate('1x', xy=(2, 4), fontsize=1)
ax.annotate('1.5x', xy=(4, 3), fontsize=1.5)

plt.title('Font size multipliers in annotations - how2matplotlib.com')
plt.show()
Output:
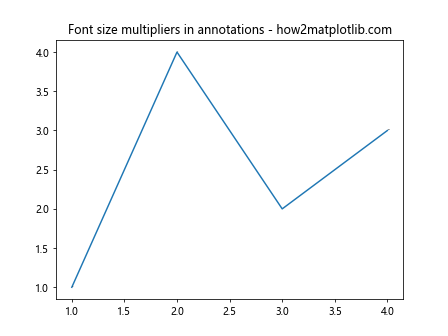
在这个例子中,我们使用0.8、1和1.5作为倍数来设置注释文本的字体大小。这种方法可以让你更精确地控制字体大小的变化。
2. 使用text()函数设置字体大小
除了annotate()函数,text()函数也是添加文本注释的常用方法。它同样支持通过fontsize参数设置字体大小。
2.1 基本用法
以下是使用text()函数添加注释并设置字体大小的示例:
import matplotlib.pyplot as plt

fig, ax = plt.subplots()
ax.plot([1, 2, 3, 4], [1, 4, 2, 3])
ax.text(2, 4, 'Maximum', fontsize=14)
ax.text(4, 3, 'End point', fontsize=10)

plt.title('Using text() function to add annotations - how2matplotlib.com')
plt.show()
Output:
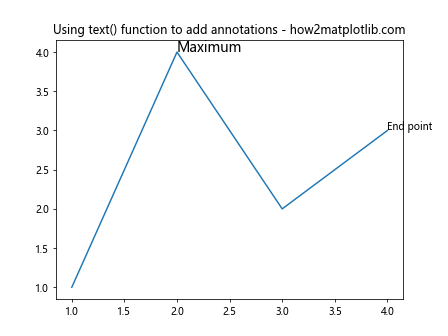
在这个例子中,我们使用text()函数添加了两个文本注释,并分别设置了不同的字体大小。
2.2 使用字典设置多个属性
如果你需要同时设置多个文本属性,可以使用字典来传递这些属性:
import matplotlib.pyplot as plt

fig, ax = plt.subplots()
ax.plot([1, 2, 3, 4], [1, 4, 2, 3])
text_props = {'fontsize': 12, 'color': 'red', 'weight': 'bold'}
ax.text(2, 4, 'Important point', **text_props)

plt.title('Setting multiple text properties - how2matplotlib.com')
plt.show()
Output:
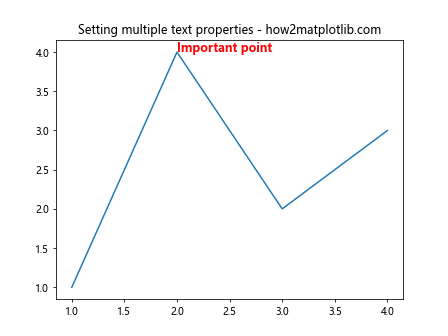
这个例子展示了如何使用字典来同时设置字体大小、颜色和粗细等多个属性。
3. 全局字体设置
有时候,你可能想要为整个图表设置一个统一的字体大小。Matplotlib提供了几种方法来实现这一点。
3.1 使用rcParams
rcParams是Matplotlib的全局配置字典,我们可以通过它来设置默认的字体大小:
import matplotlib.pyplot as plt

plt.rcParams['font.size'] = 14

fig, ax = plt.subplots()
ax.plot([1, 2, 3, 4], [1, 4, 2, 3])
ax.annotate('Note', xy=(2, 4))
ax.text(4, 3, 'End')

plt.title('Global font size setting - how2matplotlib.com')
plt.show()
Output:
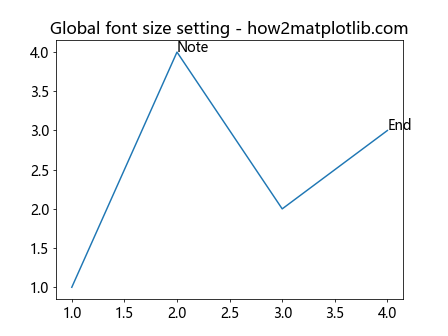
这个例子设置了全局字体大小为14点。注意,这会影响图表中的所有文本,包括标题、轴标签等。
3.2 使用style sheets
Matplotlib的样式表提供了一种更全面的方式来设置图表的样式,包括字体大小:
import matplotlib.pyplot as plt

plt.style.use('seaborn-v0_8-poster')

fig, ax = plt.subplots()
ax.plot([1, 2, 3, 4], [1, 4, 2, 3])
ax.annotate('Peak', xy=(2, 4))

plt.title('Using style sheets to set font size - how2matplotlib.com')
plt.show()
Output:
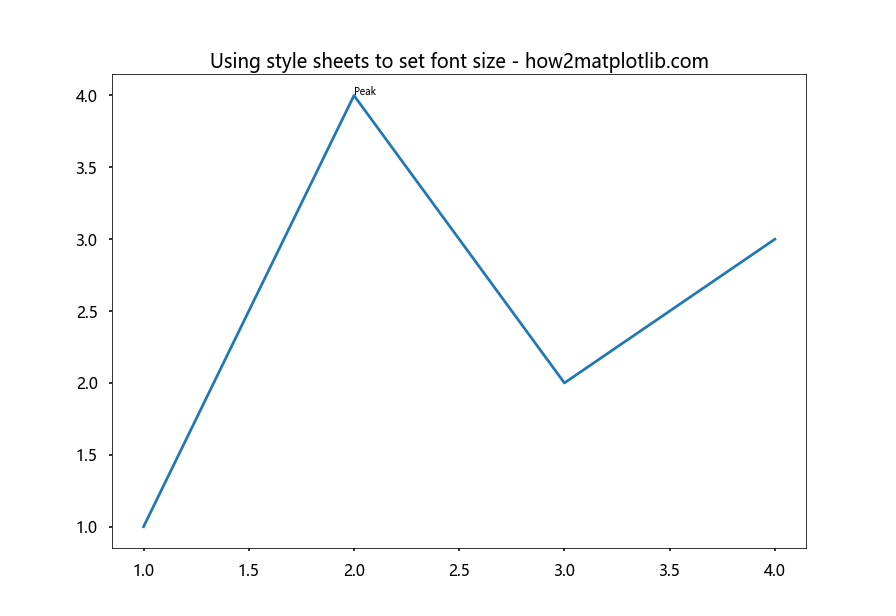
在这个例子中,我们使用了’seaborn-v0_8-poster’样式,它会设置较大的字体大小,适合用于海报或演示。
4. 动态调整字体大小
在某些情况下,你可能需要根据图表的大小或其他因素动态调整字体大小。
4.1 根据图表大小调整
以下是一个根据图表大小动态调整字体大小的例子:
import matplotlib.pyplot as plt

def adjust_fontsize(fig, base_size=12):
    width, height = fig.get_size_inches()
    size_factor = (width * height) / (8 * 6)  # 假设8x6是标准大小
    return base_size * size_factor

fig, ax = plt.subplots(figsize=(10, 8))
ax.plot([1, 2, 3, 4], [1, 4, 2, 3])

fontsize = adjust_fontsize(fig)
ax.annotate('Dynamic size', xy=(2, 4), fontsize=fontsize)

plt.title('Dynamic font size adjustment - how2matplotlib.com')
plt.show()
Output:
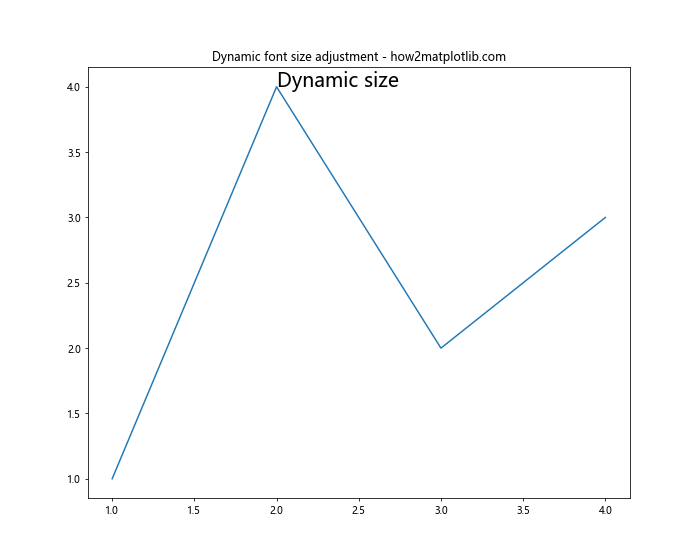
这个函数根据图表的实际大小相对于标准大小(8×6英寸)的比例来调整字体大小。
4.2 根据数据范围调整
有时,你可能想根据数据的范围来调整注释的字体大小:
import matplotlib.pyplot as plt
import numpy as np

def font_size_from_data_range(data, min_size=8, max_size=20):
    data_range = np.ptp(data)
    return min_size + (max_size - min_size) * (data_range / 100)

x = np.linspace(0, 10, 100)
y = np.sin(x)

fig, ax = plt.subplots()
ax.plot(x, y)

fontsize = font_size_from_data_range(y)
ax.annotate(f'Font size: {fontsize:.1f}', xy=(5, 0), fontsize=fontsize)

plt.title('Font size based on data range - how2matplotlib.com')
plt.show()
Output:
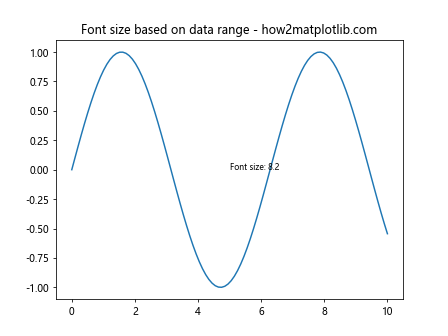
这个例子中的函数根据数据的范围计算字体大小,范围越大,字体越大。
5. 处理多个注释
当图表中有多个注释时,管理它们的字体大小可能会变得复杂。以下是一些处理多个注释的技巧。
5.1 使用循环设置字体大小
如果你有多个需要相同样式的注释,可以使用循环来设置它们:
import matplotlib.pyplot as plt

fig, ax = plt.subplots()
ax.plot([1, 2, 3, 4, 5], [2, 3, 5, 4, 6])

annotations = [
    ('Point A', (1, 2)),
    ('Point B', (3, 5)),
    ('Point C', (5, 6))
]

for text, (x, y) in annotations:
    ax.annotate(text, xy=(x, y), fontsize=12, xytext=(0, 10),
                textcoords='offset points', ha='center')

plt.title('Multiple annotations with consistent style - how2matplotlib.com')
plt.show()
Output:
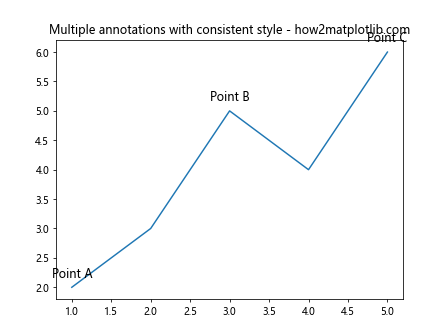
这个例子展示了如何使用循环为多个注释设置相同的字体大小和样式。
5.2 根据重要性设置不同大小
有时,你可能想根据注释的重要性设置不同的字体大小:
import matplotlib.pyplot as plt

fig, ax = plt.subplots()
ax.plot([1, 2, 3, 4, 5], [2, 3, 5, 4, 6])

annotations = [
    ('Major point', (3, 5), 16),
    ('Secondary point', (1, 2), 12),
    ('Minor detail', (5, 6), 8)
]

for text, (x, y), size in annotations:
    ax.annotate(text, xy=(x, y), fontsize=size)

plt.title('Annotations with varying importance - how2matplotlib.com')
plt.show()
Output:
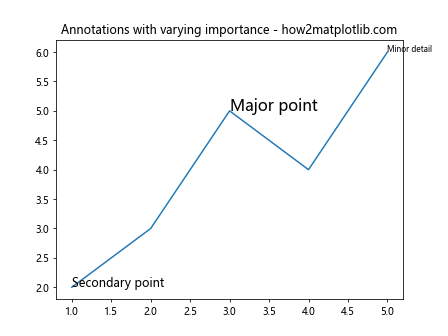
在这个例子中,我们为每个注释指定了不同的字体大小,以反映其重要性。
6. 字体大小与其他属性的结合
字体大小通常需要与其他文本属性结合使用,以达到最佳的视觉效果。
6.1 结合字体样式
以下是一个结合字体大小和样式的例子:
import matplotlib.pyplot as plt

fig, ax = plt.subplots()
ax.plot([1, 2, 3, 4], [1, 4, 2, 3])

ax.annotate('Bold', xy=(1, 1), fontsize=12, fontweight='bold')
ax.annotate('Italic', xy=(2, 4), fontsize=14, fontstyle='italic')
ax.annotate('Both', xy=(4, 3), fontsize=16, fontweight='bold', fontstyle='italic')

plt.title('Combining font size with other styles - how2matplotlib.com')
plt.show()
Output:
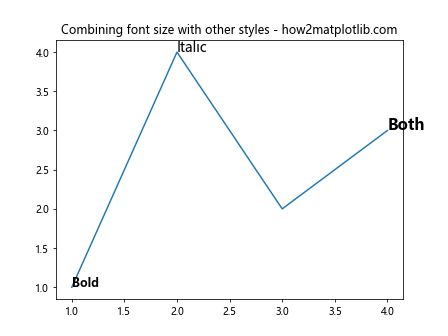
这个例子展示了如何将字体大小与粗体和斜体样式结合使用。
6.2 使用自定义字体
如果你想使用自定义字体,可以结合字体大小设置:
import matplotlib.pyplot as plt
from matplotlib import font_manager

# 添加自定义字体(请确保你有这个字体文件)
font_path = '/path/to/your/custom/font.ttf'
custom_font = font_manager.FontProperties(fname=font_path)

fig, ax = plt.subplots()
ax.plot([1, 2, 3, 4], [1, 4, 2, 3])

ax.annotate('Custom Font', xy=(2, 4), fontsize=16, fontproperties=custom_font)

plt.title('Using custom font with size setting - how2matplotlib.com')
plt.show()
这个例子展示了如何使用自定义字体并设置其大小。注意,你需要有相应的字体文件并指定正确的路径。
7. 处理特殊情况
有时,你可能会遇到一些特殊情况,需要特别处理字体大小。
7.1 处理长文本
当注释文本较长时,你可能需要调整字体大小或使用换行:
import matplotlib.pyplot as plt
import textwrap

fig, ax = plt.subplots()
ax.plot([1, 2, 3, 4], [1, 4, 2, 3])

long_text = "This is a very long annotation that needs to be wrapped to fit nicely in the plot"
wrapped_text = textwrap.fill(long_text, width=20)

ax.annotate(wrapped_text, xy=(2, 4), fontsize=10, ha='center', va='center')

plt.title('Handling long text in annotations - how2matplotlib.com')
plt.show()
Output:
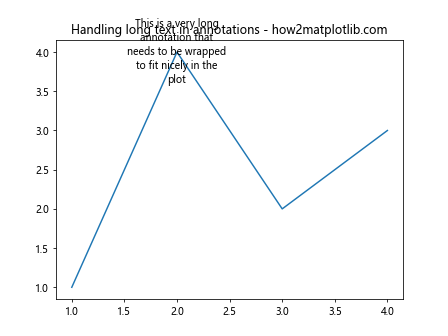
这个例子使用textwrap模块来换行长文本,并使用较小的字体大小来适应图表。
7.2 处理重叠注释
当多个注释可能重叠时,你可以使用不同的字体大小和位置来避免冲突:
import matplotlib.pyplot as plt

fig, ax = plt.subplots()
ax.plot([1, 2, 3, 4], [1, 4, 2, 3])

ax.annotate('Point A', xy=(2, 4), fontsize=12, xytext=(0, 10),
            textcoords='offset points',ha='center')
ax.annotate('Point B', xy=(2.1, 3.9), fontsize=10, xytext=(10, -10),
            textcoords='offset points', ha='left')

plt.title('Avoiding overlapping annotations - how2matplotlib.com')
plt.show()
Output:
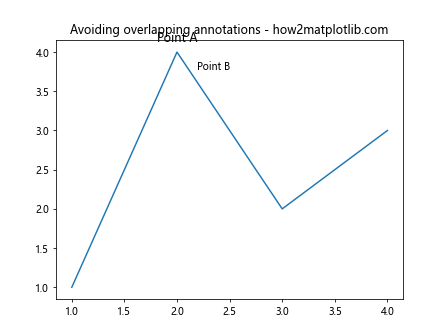
在这个例子中,我们通过调整字体大小和注释的位置来避免两个靠近的点的注释重叠。
8. 自适应字体大小
在某些情况下,你可能希望字体大小能够根据图表的大小自动调整。这里有一个更复杂的例子,展示了如何实现这一点:
import matplotlib.pyplot as plt

def adaptive_fontsize(fig, base_size=12, min_size=8, max_size=24):
    width, height = fig.get_size_inches()
    area = width * height
    fontsize = base_size * (area / (8 * 6)) ** 0.5  # 8x6 is the default figure size
    return max(min_size, min(fontsize, max_size))

fig, ax = plt.subplots(figsize=(10, 8))
ax.plot([1, 2, 3, 4], [1, 4, 2, 3])

fontsize = adaptive_fontsize(fig)
ax.annotate(f'Adaptive size: {fontsize:.1f}', xy=(2, 4), fontsize=fontsize)

plt.title('Adaptive font size based on figure size - how2matplotlib.com')
plt.show()
Output:
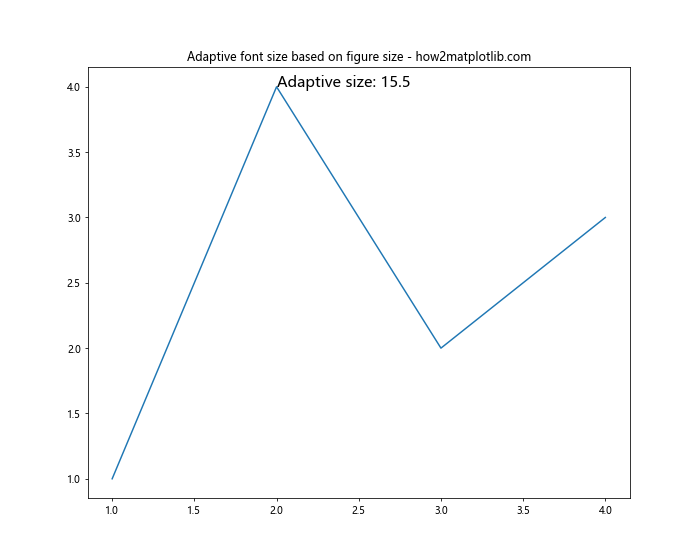
这个函数计算一个自适应的字体大小,基于图表的面积,并限制在最小和最大值之间。这样可以确保注释在不同大小的图表中都保持可读性。
9. 在子图中设置字体大小
当你的图表包含多个子图时,可能需要为每个子图单独设置字体大小:
import matplotlib.pyplot as plt

fig, (ax1, ax2) = plt.subplots(1, 2, figsize=(12, 5))

ax1.plot([1, 2, 3, 4], [1, 4, 2, 3])
ax1.annotate('Subplot 1', xy=(2, 4), fontsize=14)

ax2.plot([1, 2, 3, 4], [3, 1, 4, 2])
ax2.annotate('Subplot 2', xy=(2, 4), fontsize=10)

fig.suptitle('Different font sizes in subplots - how2matplotlib.com', fontsize=16)
plt.show()
Output:
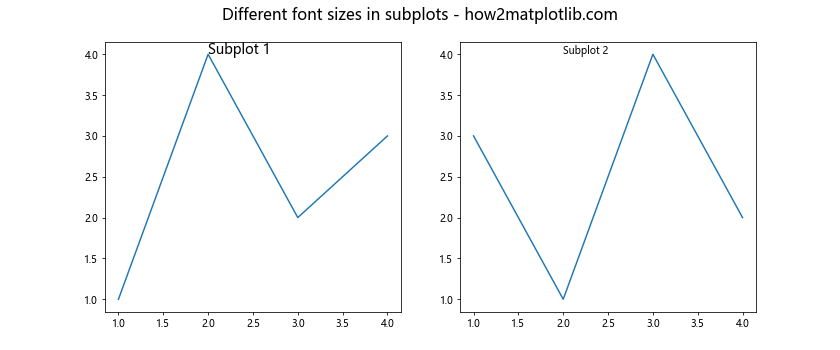
这个例子展示了如何在不同的子图中使用不同的字体大小。
10. 使用LaTeX渲染数学公式
Matplotlib支持使用LaTeX渲染数学公式。当你需要在注释中包含复杂的数学表达式时,这个功能非常有用:
import matplotlib.pyplot as plt

plt.rcParams['text.usetex'] = True  # 启用LaTeX渲染

fig, ax = plt.subplots()
ax.plot([1, 2, 3, 4], [1, 4, 2, 3])

ax.annotate(r'\frac{d}{dx}(x^2) = 2x', xy=(2, 4), fontsize=16)

plt.title('LaTeX rendering in annotations - how2matplotlib.com')
plt.show()
这个例子展示了如何在注释中使用LaTeX渲染数学公式,并设置其字体大小。注意,你需要在系统中安装LaTeX才能使用这个功能。
11. 动态调整字体大小以适应可用空间
有时,你可能希望注释的字体大小能够自动调整以适应可用的空间。以下是一个实现这一功能的高级示例:
import matplotlib.pyplot as plt
from matplotlib.patches import Rectangle

def fit_text(ax, text, xy, width, height, max_fontsize=20, min_fontsize=6):
    fontsize = max_fontsize
    bbox = dict(facecolor='white', edgecolor='none', alpha=0.7)

    while fontsize >= min_fontsize:
        t = ax.text(xy[0], xy[1], text, fontsize=fontsize, bbox=bbox, ha='center', va='center')
        renderer = ax.figure.canvas.get_renderer()
        bbox = t.get_window_extent(renderer=renderer).transformed(ax.transData.inverted())

        if bbox.width <= width and bbox.height <= height:
            return t

        fontsize -= 1
        t.remove()

    return ax.text(xy[0], xy[1], text, fontsize=min_fontsize, bbox=bbox, ha='center', va='center')

fig, ax = plt.subplots()
ax.plot([1, 2, 3, 4], [1, 4, 2, 3])

# 添加一个矩形区域来限制注释的大小
rect = Rectangle((1.5, 3.5), 1, 1, fill=False, edgecolor='red')
ax.add_patch(rect)

fit_text(ax, "Adaptive\nAnnotation", (2, 4), 1, 1)

plt.title('Adaptive font size to fit available space - how2matplotlib.com')
plt.show()
Output:
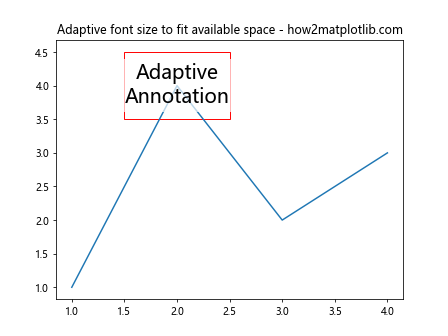
这个例子定义了一个fit_text函数,它会尝试不同的字体大小,直到找到一个适合指定区域的大小。这对于在有限的空间内放置注释非常有用。
总结
在Matplotlib中设置注释文本的字体大小是一个看似简单但实际上可以非常灵活和强大的功能。通过本文介绍的各种方法,你可以:
- 使用
annotate()和text()函数直接设置字体大小 - 利用全局设置来统一管理字体大小
- 根据图表大小或数据范围动态调整字体大小
- 处理多个注释时的字体大小设置
- 将字体大小与其他文本属性结合使用
- 处理长文本和重叠注释等特殊情况
- 实现自适应字体大小以适应不同的图表大小
- 在子图中单独设置字体大小
- 使用LaTeX渲染包含数学公式的注释
- 动态调整字体大小以适应可用空间
通过灵活运用这些技巧,你可以创建出既美观又信息丰富的数据可视化图表。记住,合适的字体大小不仅可以提高图表的可读性,还能突出重要信息,使你的数据故事更加引人入胜。在实际应用中,可能需要多次尝试和调整才能找到最佳的字体大小设置,这需要结合具体的数据、图表类型和目标受众来考虑。
最后,建议在设置字体大小时始终考虑图表的整体平衡和美观。一个好的数据可视化不仅要准确传达信息,还要在视觉上吸引读者。通过合理使用字体大小,你可以引导读者的注意力,强调关键点,并确保你的图表在各种显示设备上都能清晰可读。希望本文的内容能够帮助你在Matplotlib中更好地控制和利用注释文本的字体大小,创作出更加出色的数据可视化作品。
 极客教程
极客教程