Matplotlib绘制各种形状的完整指南
参考:How to Draw Shapes in Matplotlib with Python
Matplotlib是Python中最流行的数据可视化库之一,它提供了强大的绘图功能,包括绘制各种形状。本文将详细介绍如何使用Matplotlib绘制各种形状,包括线条、矩形、圆形、多边形等。我们将通过简单易懂的示例代码来展示每种形状的绘制方法,帮助你掌握Matplotlib中绘制形状的技巧。
1. 绘制线条
线条是最基本的形状之一,Matplotlib提供了多种方法来绘制线条。
1.1 使用plot()函数绘制直线
最简单的绘制线条的方法是使用plot()函数。以下是一个简单的示例:
import matplotlib.pyplot as plt

plt.figure(figsize=(8, 6))
plt.plot([0, 1], [0, 1], label='Line from (0,0) to (1,1)')
plt.title('How to Draw a Line in Matplotlib - how2matplotlib.com')
plt.xlabel('X-axis')
plt.ylabel('Y-axis')
plt.legend()
plt.grid(True)
plt.show()
Output:
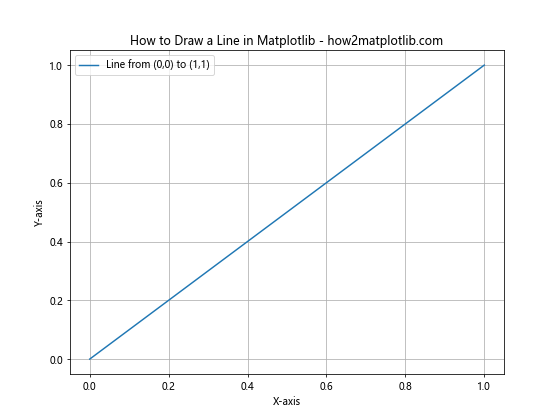
这段代码绘制了一条从(0,0)到(1,1)的直线。plot()函数接受两个列表作为参数,分别表示x坐标和y坐标。
1.2 使用axvline()和axhline()绘制垂直和水平线
要绘制垂直和水平线,可以使用axvline()和axhline()函数:
import matplotlib.pyplot as plt

fig, ax = plt.subplots(figsize=(8, 6))
ax.axvline(x=0.5, color='r', linestyle='--', label='Vertical line')
ax.axhline(y=0.5, color='g', linestyle=':', label='Horizontal line')
ax.set_title('Vertical and Horizontal Lines - how2matplotlib.com')
ax.set_xlabel('X-axis')
ax.set_ylabel('Y-axis')
ax.legend()
ax.grid(True)
plt.show()
Output:
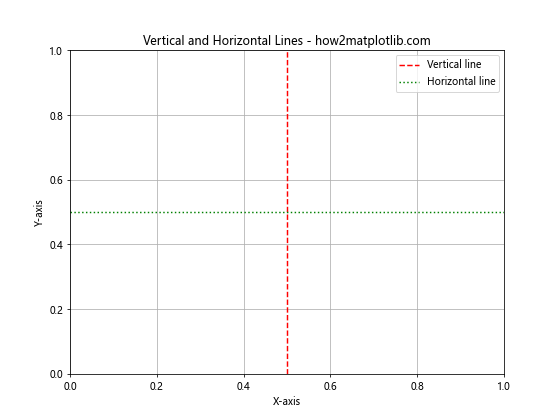
这个例子展示了如何绘制垂直线和水平线,并设置不同的颜色和线型。
1.3 使用Line2D对象绘制自定义线条
对于更复杂的线条,可以使用Line2D对象:
import matplotlib.pyplot as plt
from matplotlib.lines import Line2D

fig, ax = plt.subplots(figsize=(8, 6))
line = Line2D([0, 1], [0, 1], linewidth=2, color='blue', linestyle='-.')
ax.add_line(line)
ax.set_xlim(0, 1)
ax.set_ylim(0, 1)
ax.set_title('Custom Line using Line2D - how2matplotlib.com')
ax.set_xlabel('X-axis')
ax.set_ylabel('Y-axis')
plt.show()
Output:
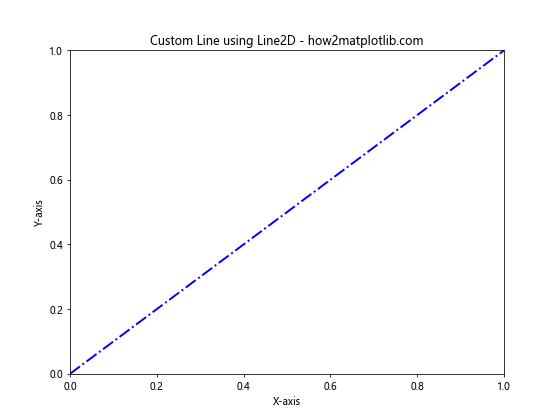
这个例子创建了一个Line2D对象,并将其添加到坐标轴中。这种方法允许你更精细地控制线条的属性。
2. 绘制矩形
矩形是另一种常见的形状,Matplotlib提供了多种方法来绘制矩形。
2.1 使用Rectangle对象绘制矩形
使用Rectangle对象是绘制矩形最直接的方法:
import matplotlib.pyplot as plt
from matplotlib.patches import Rectangle

fig, ax = plt.subplots(figsize=(8, 6))
rect = Rectangle((0.2, 0.2), 0.6, 0.4, facecolor='cyan', edgecolor='blue', alpha=0.5)
ax.add_patch(rect)
ax.set_xlim(0, 1)
ax.set_ylim(0, 1)
ax.set_title('Rectangle using Rectangle object - how2matplotlib.com')
ax.set_xlabel('X-axis')
ax.set_ylabel('Y-axis')
plt.show()
Output:
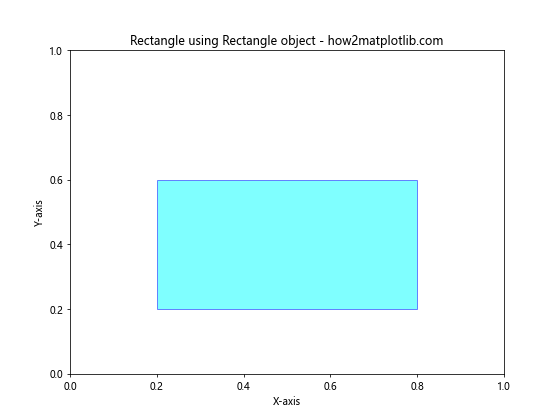
这个例子创建了一个Rectangle对象,并将其添加到坐标轴中。Rectangle的参数包括左下角坐标、宽度和高度。
2.2 使用bar()函数绘制矩形
bar()函数通常用于绘制条形图,但也可以用来绘制单个矩形:
import matplotlib.pyplot as plt

fig, ax = plt.subplots(figsize=(8, 6))
ax.bar(0.5, 0.6, width=0.4, bottom=0.2, color='lightgreen', edgecolor='darkgreen', alpha=0.7)
ax.set_xlim(0, 1)
ax.set_ylim(0, 1)
ax.set_title('Rectangle using bar() function - how2matplotlib.com')
ax.set_xlabel('X-axis')
ax.set_ylabel('Y-axis')
plt.show()
Output:
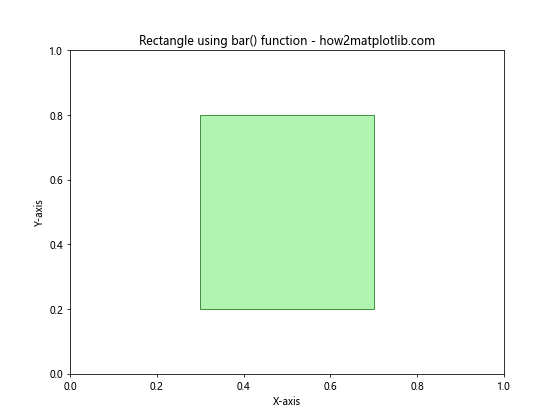
这个例子使用bar()函数绘制了一个矩形。width参数控制矩形的宽度,bottom参数控制矩形的底部位置。
2.3 绘制多个矩形
你可以轻松地绘制多个矩形:
import matplotlib.pyplot as plt
from matplotlib.patches import Rectangle

fig, ax = plt.subplots(figsize=(8, 6))
colors = ['red', 'green', 'blue', 'yellow']
for i in range(4):
    rect = Rectangle((0.1 + i*0.2, 0.1 + i*0.2), 0.1, 0.1, facecolor=colors[i], edgecolor='black')
    ax.add_patch(rect)
ax.set_xlim(0, 1)
ax.set_ylim(0, 1)
ax.set_title('Multiple Rectangles - how2matplotlib.com')
ax.set_xlabel('X-axis')
ax.set_ylabel('Y-axis')
plt.show()
Output:
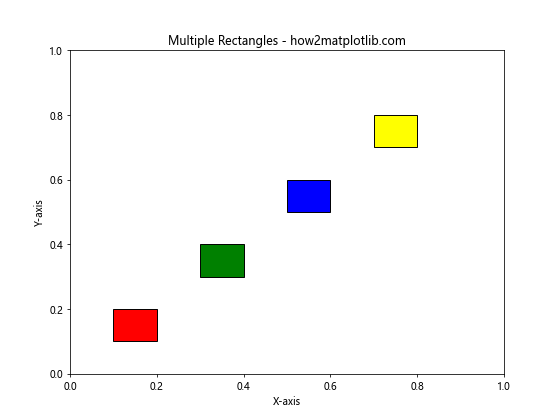
这个例子展示了如何在一个图中绘制多个不同颜色的矩形。
3. 绘制圆形
圆形是另一种常见的形状,Matplotlib提供了多种方法来绘制圆形。
3.1 使用Circle对象绘制圆形
使用Circle对象是绘制圆形最直接的方法:
import matplotlib.pyplot as plt
from matplotlib.patches import Circle

fig, ax = plt.subplots(figsize=(8, 6))
circle = Circle((0.5, 0.5), 0.3, facecolor='pink', edgecolor='red', alpha=0.7)
ax.add_patch(circle)
ax.set_xlim(0, 1)
ax.set_ylim(0, 1)
ax.set_title('Circle using Circle object - how2matplotlib.com')
ax.set_xlabel('X-axis')
ax.set_ylabel('Y-axis')
plt.show()
Output:
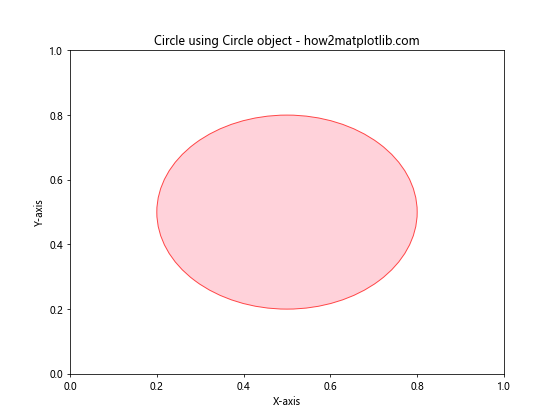
这个例子创建了一个Circle对象,并将其添加到坐标轴中。Circle的参数包括圆心坐标和半径。
3.2 使用scatter()函数绘制圆点
scatter()函数通常用于绘制散点图,但也可以用来绘制单个圆点:
import matplotlib.pyplot as plt

fig, ax = plt.subplots(figsize=(8, 6))
ax.scatter(0.5, 0.5, s=5000, c='purple', alpha=0.5)
ax.set_xlim(0, 1)
ax.set_ylim(0, 1)
ax.set_title('Circle using scatter() function - how2matplotlib.com')
ax.set_xlabel('X-axis')
ax.set_ylabel('Y-axis')
plt.show()
Output:
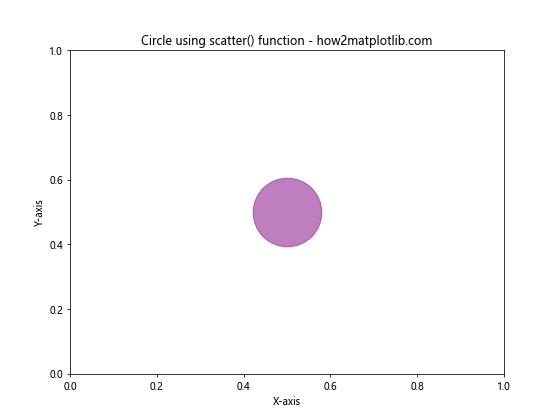
这个例子使用scatter()函数绘制了一个大圆点。s参数控制圆点的大小。
3.3 绘制多个圆形
你可以轻松地绘制多个圆形:
import matplotlib.pyplot as plt
from matplotlib.patches import Circle

fig, ax = plt.subplots(figsize=(8, 6))
colors = ['red', 'green', 'blue', 'yellow']
for i in range(4):
    circle = Circle((0.2 + i*0.2, 0.5), 0.1, facecolor=colors[i], edgecolor='black')
    ax.add_patch(circle)
ax.set_xlim(0, 1)
ax.set_ylim(0, 1)
ax.set_title('Multiple Circles - how2matplotlib.com')
ax.set_xlabel('X-axis')
ax.set_ylabel('Y-axis')
plt.show()
Output:
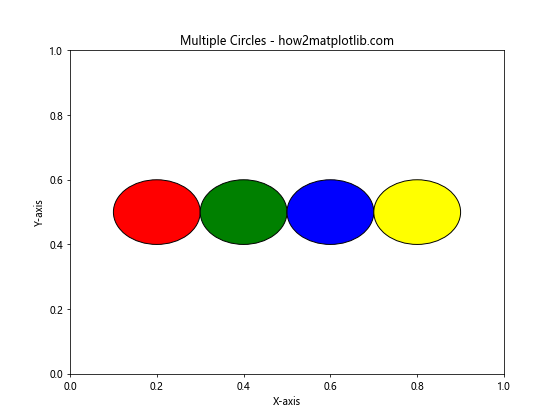
这个例子展示了如何在一个图中绘制多个不同颜色的圆形。
4. 绘制椭圆
椭圆是圆的一种推广,Matplotlib提供了Ellipse对象来绘制椭圆。
4.1 使用Ellipse对象绘制椭圆
import matplotlib.pyplot as plt
from matplotlib.patches import Ellipse

fig, ax = plt.subplots(figsize=(8, 6))
ellipse = Ellipse((0.5, 0.5), 0.6, 0.3, angle=30, facecolor='yellow', edgecolor='orange', alpha=0.7)
ax.add_patch(ellipse)
ax.set_xlim(0, 1)
ax.set_ylim(0, 1)
ax.set_title('Ellipse using Ellipse object - how2matplotlib.com')
ax.set_xlabel('X-axis')
ax.set_ylabel('Y-axis')
plt.show()
Output:
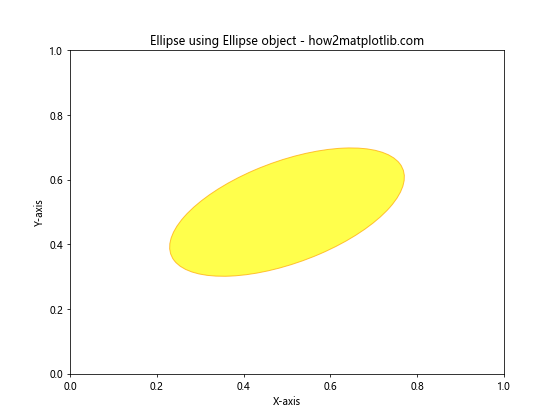
这个例子创建了一个Ellipse对象,并将其添加到坐标轴中。Ellipse的参数包括中心坐标、宽度、高度和旋转角度。
4.2 绘制多个椭圆
你可以轻松地绘制多个椭圆:
import matplotlib.pyplot as plt
from matplotlib.patches import Ellipse

fig, ax = plt.subplots(figsize=(8, 6))
colors = ['red', 'green', 'blue', 'yellow']
for i in range(4):
    ellipse = Ellipse((0.5, 0.5), 0.8-i*0.2, 0.4-i*0.1, angle=i*30, facecolor=colors[i], edgecolor='black', alpha=0.5)
    ax.add_patch(ellipse)
ax.set_xlim(0, 1)
ax.set_ylim(0, 1)
ax.set_title('Multiple Ellipses - how2matplotlib.com')
ax.set_xlabel('X-axis')
ax.set_ylabel('Y-axis')
plt.show()
Output:
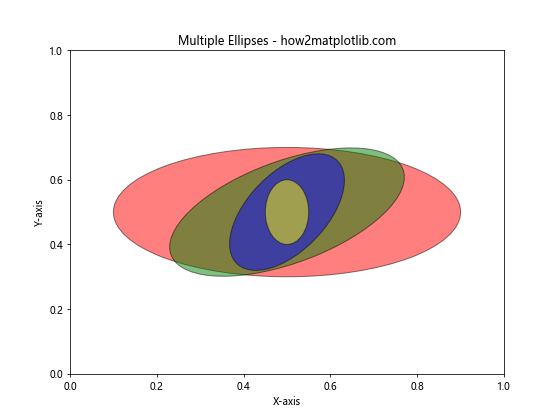
这个例子展示了如何在一个图中绘制多个不同大小、颜色和旋转角度的椭圆。
5. 绘制多边形
多边形是由多个直线段连接而成的封闭图形。Matplotlib提供了Polygon对象来绘制多边形。
5.1 使用Polygon对象绘制三角形
import matplotlib.pyplot as plt
from matplotlib.patches import Polygon

fig, ax = plt.subplots(figsize=(8, 6))
triangle = Polygon([(0.2, 0.2), (0.8, 0.2), (0.5, 0.8)], facecolor='lightblue', edgecolor='blue')
ax.add_patch(triangle)
ax.set_xlim(0, 1)
ax.set_ylim(0, 1)
ax.set_title('Triangle using Polygon object - how2matplotlib.com')
ax.set_xlabel('X-axis')
ax.set_ylabel('Y-axis')
plt.show()
Output:
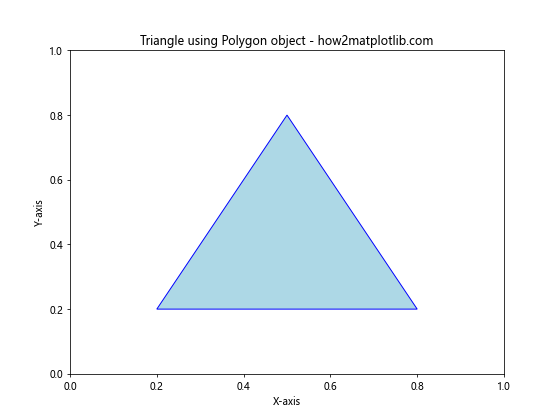
这个例子创建了一个Polygon对象来绘制三角形,并将其添加到坐标轴中。Polygon的参数是一个包含顶点坐标的列表。
5.2 绘制正多边形
你可以使用RegularPolygon对象来绘制正多边形:
import matplotlib.pyplot as plt
from matplotlib.patches import RegularPolygon

fig, ax = plt.subplots(figsize=(8, 6))
hexagon = RegularPolygon((0.5, 0.5), 6, 0.3, facecolor='lightgreen', edgecolor='green')
ax.add_patch(hexagon)
ax.set_xlim(0, 1)
ax.set_ylim(0, 1)
ax.set_title('Regular Hexagon - how2matplotlib.com')
ax.set_xlabel('X-axis')
ax.set_ylabel('Y-axis')
plt.show()
这个例子创建了一个正六边形。RegularPolygon的参数包括中心坐标、边数和外接圆半径。
5.3 绘制不规则多边形
你可以使用Polygon对象来绘制任意的不规则多边形:
import matplotlib.pyplot as plt
from matplotlib.patches import Polygon

fig, ax = plt.subplots(figsize=(8, 6))
polygon = Polygon([(0.1, 0.1), (0.4, 0.2), (0.7, 0.5), (0.8, 0.7), (0.5, 0.9), (0.2, 0.7)],
                  facecolor='pink', edgecolor='red', alpha=0.7)
ax.add_patch(polygon)
ax.set_xlim(0, 1)
ax.set_ylim(0, 1)
ax.set_title('Irregular Polygon - how2matplotlib.com')
ax.set_xlabel('X-axis')
ax.set_ylabel('Y-axis')
plt.show()
Output:
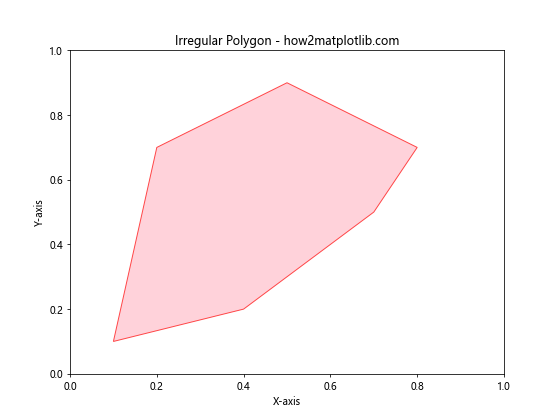
这个例子展示了如何绘制一个不规则的六边形。
6. 绘制弧形
弧形是圆的一部分,Matplotlib提供了Arc对象来绘制弧形。
6.1 使用Arc对象绘制弧形
import matplotlib.pyplot as plt
from matplotlib.patches import Arc

fig, ax = plt.subplots(figsize=(8, 6))
arc = Arc((0.5, 0.5), 0.6, 0.4, angle=0, theta1=0, theta2=270, linewidth=2, color='purple')
ax.add_patch(arc)
ax.set_xlim(0, 1)
ax.set_ylim(0, 1)
ax.set_title('Arc using Arc object - how2matplotlib.com')
ax.set_xlabel('X-axis')
ax.set_ylabel('Y-axis')
plt.show()
Output:
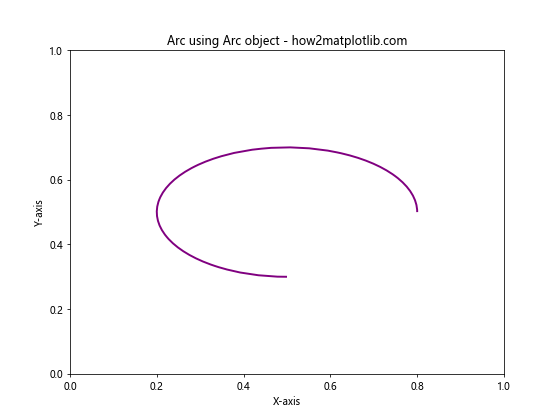
这个例子创建了一个Arc对象,并将其添加到坐标轴中。Arc的参数包括中心坐标、宽度、高度、旋转角度、起始角度和结束角度。
6.2 绘制多个弧形
你可以轻松地绘制多个弧形:
import matplotlib.pyplot as plt
from matplotlib.patches import Arc

fig, ax = plt.subplots(figsize=(8, 6))
colors = ['red', 'green', 'blue', 'yellow']
for i in range(4):
    arc = Arc((0.5, 0.5), 0.8-i*0.1, 0.8-i*0.1, angle=0, theta1=i*90, theta2=(i+1)*90,
              linewidth=2, color=colors[i])
    ax.add_patch(arc)
ax.set_xlim(0, 1)
ax.set_ylim(0, 1)
ax.set_title('Multiple Arcs - how2matplotlib.com')
ax.set_xlabel('X-axis')
ax.set_ylabel('Y-axis')
plt.show()
Output:
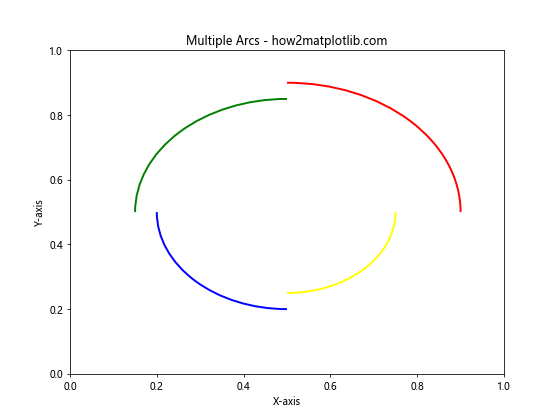
这个例子展示了如何在一个图中绘制多个不同颜色和角度的弧形。
7. 绘制箭头
箭头是一种特殊的形状,通常用于指示方向。Matplotlib提供了多种方法来绘制箭头。
7.1 使用arrow()函数绘制箭头
import matplotlib.pyplot as plt

fig, ax = plt.subplots(figsize=(8, 6))
ax.arrow(0.2, 0.2, 0.6, 0.6, head_width=0.05, head_length=0.1, fc='orange', ec='red')
ax.set_xlim(0, 1)
ax.set_ylim(0, 1)
ax.set_title('Arrow using arrow() function - how2matplotlib.com')
ax.set_xlabel('X-axis')
ax.set_ylabel('Y-axis')
plt.show()
Output:
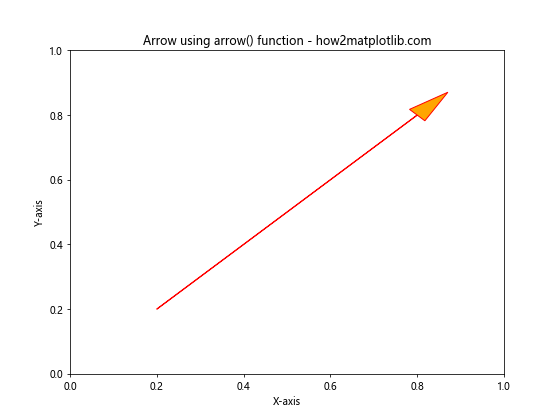
这个例子使用arrow()函数绘制了一个箭头。参数包括起点坐标、箭头的x方向和y方向长度、箭头头部的宽度和长度。
7.2 使用FancyArrowPatch对象绘制箭头
对于更复杂的箭头,可以使用FancyArrowPatch对象:
import matplotlib.pyplot as plt
from matplotlib.patches import FancyArrowPatch

fig, ax = plt.subplots(figsize=(8, 6))
arrow = FancyArrowPatch((0.2, 0.2), (0.8, 0.8),
                        arrowstyle='->',
                        mutation_scale=20,
                        color='purple')
ax.add_patch(arrow)
ax.set_xlim(0, 1)
ax.set_ylim(0, 1)
ax.set_title('Arrow using FancyArrowPatch - how2matplotlib.com')
ax.set_xlabel('X-axis')
ax.set_ylabel('Y-axis')
plt.show()
Output:
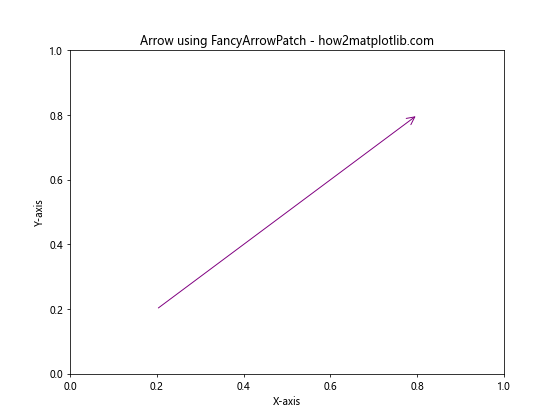
这个例子创建了一个FancyArrowPatch对象,它提供了更多的自定义选项,如箭头样式和大小。
8. 绘制文本和注释
虽然文本和注释不是严格意义上的”形状”,但它们经常与其他形状一起使用来增强图表的信息量。
8.1 使用text()函数添加文本
import matplotlib.pyplot as plt

fig, ax = plt.subplots(figsize=(8, 6))
ax.text(0.5, 0.5, 'Hello, how2matplotlib.com!',
        fontsize=20, ha='center', va='center',
        bbox=dict(facecolor='white', edgecolor='black', boxstyle='round'))
ax.set_xlim(0, 1)
ax.set_ylim(0, 1)
ax.set_title('Text in Matplotlib - how2matplotlib.com')
ax.set_xlabel('X-axis')
ax.set_ylabel('Y-axis')
plt.show()
Output:
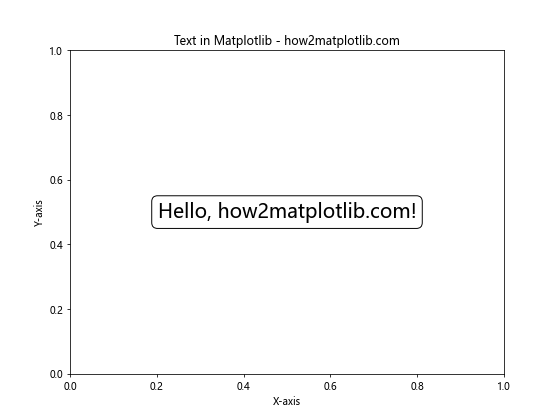
这个例子使用text()函数在图中添加了文本。你可以设置文本的位置、大小、对齐方式,甚至可以给文本添加边框。
8.2 使用annotate()函数添加注释
import matplotlib.pyplot as plt

fig, ax = plt.subplots(figsize=(8, 6))
ax.plot([0.2, 0.8], [0.2, 0.8], 'ro')
ax.annotate('Point of Interest', xy=(0.8, 0.8), xytext=(0.6, 0.6),
            arrowprops=dict(facecolor='black', shrink=0.05),
            fontsize=12, ha='right', va='bottom')
ax.set_xlim(0, 1)
ax.set_ylim(0, 1)
ax.set_title('Annotation in Matplotlib - how2matplotlib.com')
ax.set_xlabel('X-axis')
ax.set_ylabel('Y-axis')
plt.show()
Output:
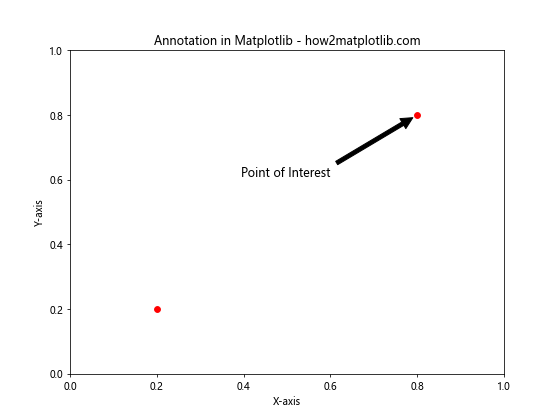
这个例子使用annotate()函数添加了一个带箭头的注释。你可以指定注释的目标位置和文本位置,以及箭头的样式。
9. 组合多种形状
在实际应用中,我们经常需要组合多种形状来创建复杂的图形。
9.1 创建简单的人脸图
import matplotlib.pyplot as plt
from matplotlib.patches import Circle, Wedge

fig, ax = plt.subplots(figsize=(8, 6))

# 脸
face = Circle((0.5, 0.5), 0.4, facecolor='yellow', edgecolor='black')
ax.add_patch(face)

# 眼睛
left_eye = Circle((0.35, 0.6), 0.05, facecolor='white', edgecolor='black')
right_eye = Circle((0.65, 0.6), 0.05, facecolor='white', edgecolor='black')
ax.add_patch(left_eye)
ax.add_patch(right_eye)

# 嘴巴
mouth = Wedge((0.5, 0.4), 0.2, 180, 0, facecolor='red', edgecolor='black')
ax.add_patch(mouth)

ax.set_xlim(0, 1)
ax.set_ylim(0, 1)
ax.set_title('Simple Face using Shapes - how2matplotlib.com')
ax.set_xlabel('X-axis')
ax.set_ylabel('Y-axis')
ax.axis('off')
plt.show()
Output:
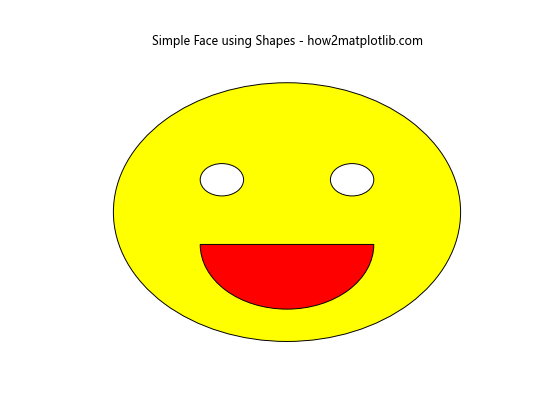
这个例子展示了如何组合圆形和楔形来创建一个简单的笑脸图。
9.2 创建简单的房子图
import matplotlib.pyplot as plt
from matplotlib.patches import Rectangle, Polygon, Circle

fig, ax = plt.subplots(figsize=(8, 6))

# 房子主体
house = Rectangle((0.2, 0.1), 0.6, 0.5, facecolor='lightblue', edgecolor='blue')
ax.add_patch(house)

# 屋顶
roof = Polygon([(0.1, 0.6), (0.5, 0.9), (0.9, 0.6)], facecolor='red', edgecolor='darkred')
ax.add_patch(roof)

# 门
door = Rectangle((0.45, 0.1), 0.1, 0.2, facecolor='brown', edgecolor='black')
ax.add_patch(door)

# 窗户
window = Rectangle((0.3, 0.3), 0.1, 0.1, facecolor='white', edgecolor='black')
ax.add_patch(window)

# 太阳
sun = Circle((0.8, 0.8), 0.1, facecolor='yellow', edgecolor='orange')
ax.add_patch(sun)

ax.set_xlim(0, 1)
ax.set_ylim(0, 1)
ax.set_title('Simple House using Shapes - how2matplotlib.com')
ax.set_xlabel('X-axis')
ax.set_ylabel('Y-axis')
ax.axis('off')
plt.show()
Output:
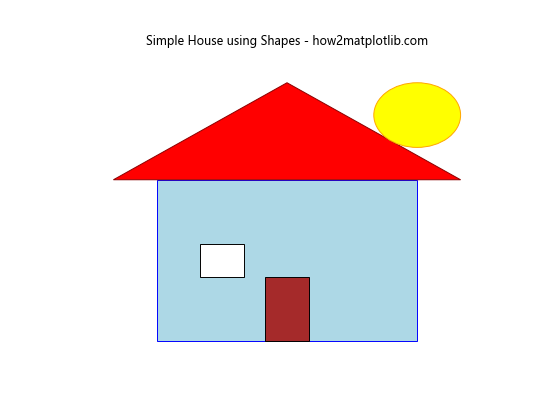
这个例子展示了如何组合矩形、多边形和圆形来创建一个简单的房子图。
10. 总结
在本文中,我们详细介绍了如何使用Matplotlib绘制各种形状,包括线条、矩形、圆形、椭圆、多边形、弧形和箭头。我们还讨论了如何添加文本和注释,以及如何组合多种形状来创建复杂的图形。
通过这些示例,你应该能够掌握使用Matplotlib绘制各种形状的基本技巧。记住,实践是提高技能的最好方法。尝试修改这些示例,创建你自己的图形,探索Matplotlib提供的更多功能。
Matplotlib是一个功能强大的库,本文只涵盖了其中的一小部分功能。随着你对Matplotlib的深入学习,你将能够创建更复杂、更精美的图形和可视化效果。
 极客教程
极客教程