Matplotlib中如何生成子图:全面指南与实例
参考:How to Generate Subplots With Matplotlib
Matplotlib是Python中最流行的数据可视化库之一,它提供了强大的绘图功能。在数据分析和科学研究中,我们经常需要在同一个图形窗口中展示多个相关的图表。这时,Matplotlib的子图(subplots)功能就显得尤为重要。本文将详细介绍如何使用Matplotlib生成子图,包括基本概念、常用方法、布局技巧以及高级应用。
1. 子图的基本概念
子图是指在一个图形窗口中包含多个独立的绘图区域。每个子图可以展示不同的数据或图表类型,使得我们能够在一个视图中比较和分析多个相关的数据集。
1.1 创建基本子图
最简单的创建子图的方法是使用plt.subplot()函数。这个函数接受三个参数:行数、列数和子图索引。
import matplotlib.pyplot as plt
import numpy as np

# 创建数据
x = np.linspace(0, 10, 100)
y1 = np.sin(x)
y2 = np.cos(x)

# 创建2x1的子图布局
plt.subplot(2, 1, 1)
plt.plot(x, y1)
plt.title('Sine Wave - how2matplotlib.com')

plt.subplot(2, 1, 2)
plt.plot(x, y2)
plt.title('Cosine Wave - how2matplotlib.com')

plt.tight_layout()
plt.show()
Output:
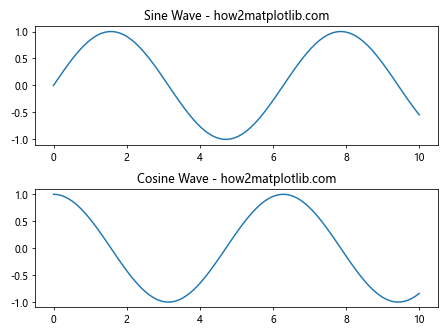
在这个例子中,我们创建了一个2行1列的子图布局。第一个子图显示正弦波,第二个子图显示余弦波。plt.tight_layout()函数用于自动调整子图之间的间距。
1.2 使用plt.subplots()函数
plt.subplots()函数提供了一种更方便的方式来创建子图。它返回一个图形对象和一个包含所有子图的数组。
import matplotlib.pyplot as plt
import numpy as np

# 创建2x2的子图布局
fig, axs = plt.subplots(2, 2)

# 生成数据
x = np.linspace(0, 10, 100)
y1 = np.sin(x)
y2 = np.cos(x)
y3 = np.tan(x)
y4 = np.exp(x)

# 在每个子图中绘制不同的函数
axs[0, 0].plot(x, y1)
axs[0, 0].set_title('Sine - how2matplotlib.com')

axs[0, 1].plot(x, y2)
axs[0, 1].set_title('Cosine - how2matplotlib.com')

axs[1, 0].plot(x, y3)
axs[1, 0].set_title('Tangent - how2matplotlib.com')

axs[1, 1].plot(x, y4)
axs[1, 1].set_title('Exponential - how2matplotlib.com')

plt.tight_layout()
plt.show()
Output:
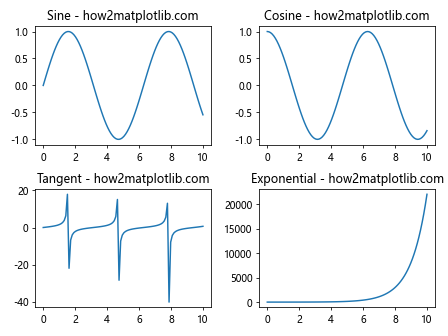
这个例子创建了一个2×2的子图网格,每个子图显示不同的数学函数。
2. 子图布局技巧
2.1 调整子图大小和间距
我们可以使用figsize参数来设置整个图形的大小,使用gridspec_kw参数来调整子图之间的间距。
import matplotlib.pyplot as plt
import numpy as np

# 创建3x3的子图布局,设置图形大小和子图间距
fig, axs = plt.subplots(3, 3, figsize=(12, 10),
                        gridspec_kw={'hspace': 0.4, 'wspace': 0.3})

# 生成一些随机数据
for i in range(3):
    for j in range(3):
        data = np.random.rand(10)
        axs[i, j].bar(range(10), data)
        axs[i, j].set_title(f'Plot {i*3+j+1} - how2matplotlib.com')

plt.show()
Output:
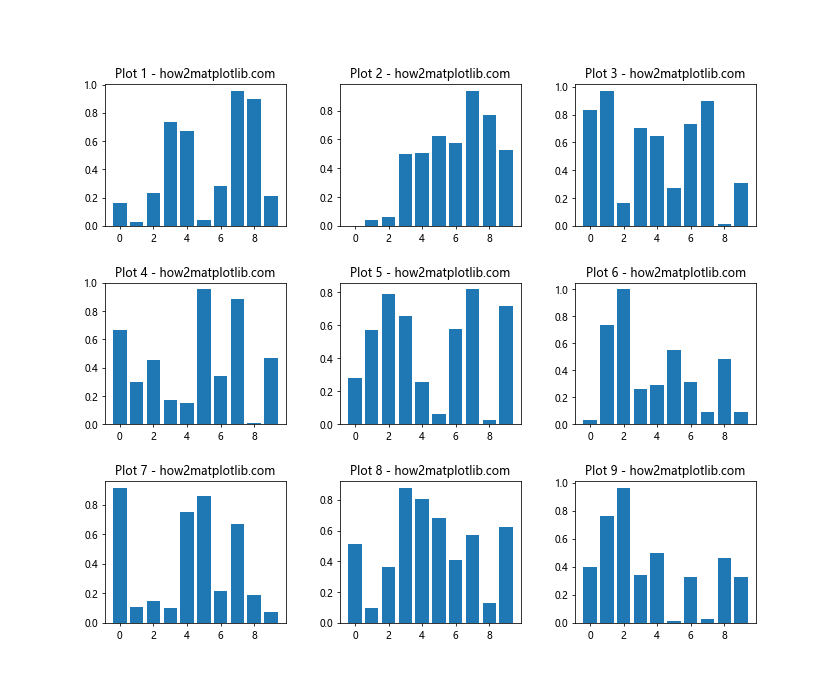
这个例子创建了一个3×3的子图网格,设置了整体图形大小为12×10英寸,并调整了子图之间的水平和垂直间距。
2.2 不规则子图布局
有时我们需要创建不规则的子图布局,这时可以使用gridspec模块。
import matplotlib.pyplot as plt
import matplotlib.gridspec as gridspec

fig = plt.figure(figsize=(12, 8))
gs = gridspec.GridSpec(3, 3)

ax1 = fig.add_subplot(gs[0, :])
ax1.set_title('Spanning all columns - how2matplotlib.com')

ax2 = fig.add_subplot(gs[1, :-1])
ax2.set_title('Spanning 2 columns - how2matplotlib.com')

ax3 = fig.add_subplot(gs[1:, -1])
ax3.set_title('Spanning 2 rows - how2matplotlib.com')

ax4 = fig.add_subplot(gs[-1, 0])
ax4.set_title('Bottom left - how2matplotlib.com')

ax5 = fig.add_subplot(gs[-1, -2])
ax5.set_title('Bottom center - how2matplotlib.com')

plt.tight_layout()
plt.show()
Output:
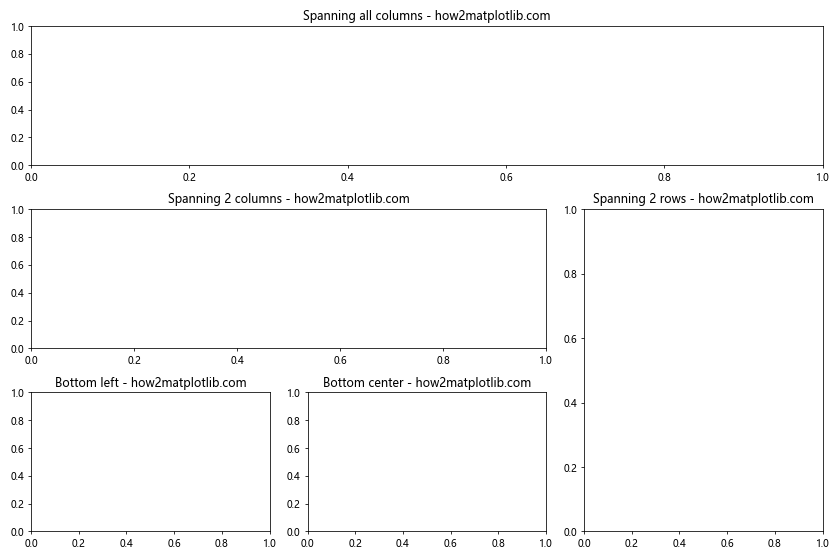
这个例子展示了如何创建一个不规则的子图布局,包括跨越多行或多列的子图。
3. 子图中的数据可视化
3.1 在子图中绘制不同类型的图表
Matplotlib支持多种图表类型,我们可以在不同的子图中绘制不同类型的图表。
import matplotlib.pyplot as plt
import numpy as np

fig, axs = plt.subplots(2, 2, figsize=(10, 8))

# 折线图
x = np.linspace(0, 10, 100)
axs[0, 0].plot(x, np.sin(x))
axs[0, 0].set_title('Line Plot - how2matplotlib.com')

# 散点图
x = np.random.rand(50)
y = np.random.rand(50)
axs[0, 1].scatter(x, y)
axs[0, 1].set_title('Scatter Plot - how2matplotlib.com')

# 柱状图
x = ['A', 'B', 'C', 'D']
y = [3, 7, 2, 5]
axs[1, 0].bar(x, y)
axs[1, 0].set_title('Bar Plot - how2matplotlib.com')

# 饼图
sizes = [15, 30, 45, 10]
axs[1, 1].pie(sizes, labels=['A', 'B', 'C', 'D'], autopct='%1.1f%%')
axs[1, 1].set_title('Pie Chart - how2matplotlib.com')

plt.tight_layout()
plt.show()
Output:
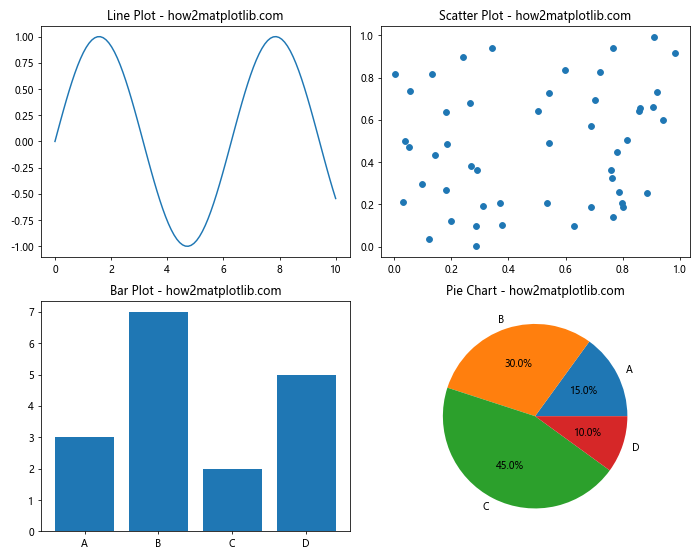
这个例子在2×2的子图布局中分别绘制了折线图、散点图、柱状图和饼图。
3.2 共享坐标轴
在某些情况下,我们可能希望子图之间共享x轴或y轴。
import matplotlib.pyplot as plt
import numpy as np

fig, (ax1, ax2) = plt.subplots(2, 1, sharex=True, figsize=(8, 6))

x = np.linspace(0, 10, 100)
ax1.plot(x, np.sin(x))
ax1.set_title('Sine Wave - how2matplotlib.com')

ax2.plot(x, np.cos(x))
ax2.set_title('Cosine Wave - how2matplotlib.com')

plt.xlabel('X-axis')
plt.tight_layout()
plt.show()
Output:
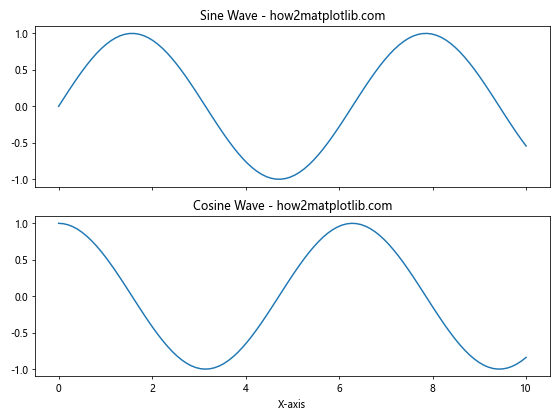
在这个例子中,我们创建了两个垂直排列的子图,它们共享x轴。这在比较具有相同x轴范围的不同数据集时非常有用。
4. 子图的样式和格式化
4.1 设置子图标题和轴标签
为子图添加标题和轴标签可以提高图表的可读性。
import matplotlib.pyplot as plt
import numpy as np

fig, axs = plt.subplots(2, 2, figsize=(10, 8))

for i in range(2):
    for j in range(2):
        x = np.linspace(0, 10, 100)
        y = np.random.rand(100)
        axs[i, j].plot(x, y)
        axs[i, j].set_title(f'Plot {i*2+j+1} - how2matplotlib.com')
        axs[i, j].set_xlabel('X-axis')
        axs[i, j].set_ylabel('Y-axis')

fig.suptitle('Multiple Subplots with Titles and Labels', fontsize=16)
plt.tight_layout()
plt.show()
Output:
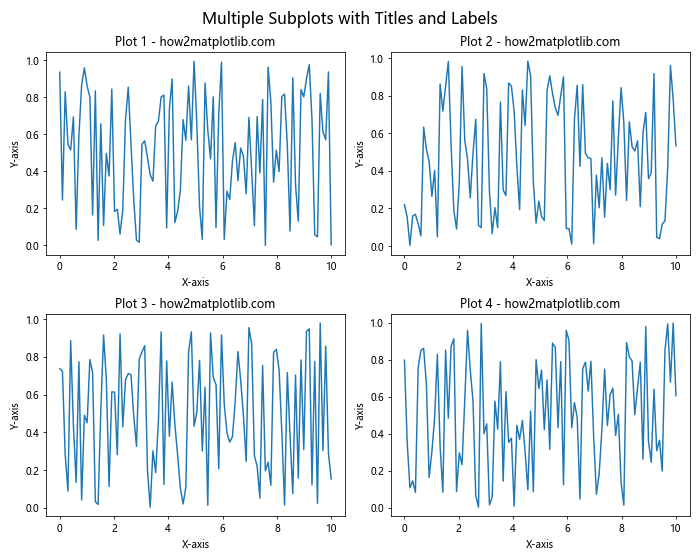
这个例子为每个子图设置了标题、x轴标签和y轴标签,并为整个图形添加了一个总标题。
4.2 自定义子图样式
我们可以自定义子图的各种视觉元素,如颜色、线型、标记等。
import matplotlib.pyplot as plt
import numpy as np

fig, axs = plt.subplots(2, 2, figsize=(10, 8))

x = np.linspace(0, 10, 100)

axs[0, 0].plot(x, np.sin(x), 'r-', linewidth=2)
axs[0, 0].set_title('Red Sine Wave - how2matplotlib.com')

axs[0, 1].plot(x, np.cos(x), 'b--', linewidth=2)
axs[0, 1].set_title('Blue Cosine Wave - how2matplotlib.com')

axs[1, 0].plot(x, np.tan(x), 'g:', linewidth=2)
axs[1, 0].set_title('Green Tangent Wave - how2matplotlib.com')

axs[1, 1].plot(x, x**2, 'm-.', linewidth=2)
axs[1, 1].set_title('Magenta Quadratic Function - how2matplotlib.com')

for ax in axs.flat:
    ax.set_xlabel('X-axis')
    ax.set_ylabel('Y-axis')
    ax.grid(True, linestyle='--', alpha=0.7)

plt.tight_layout()
plt.show()
Output:
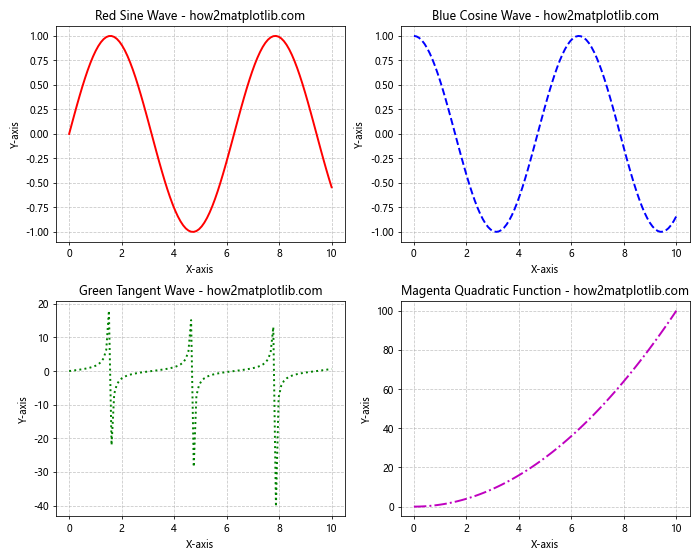
这个例子展示了如何为不同的子图设置不同的线条颜色、样式和粗细,以及如何添加网格线。
5. 高级子图技巧
5.1 子图中的图例
当一个子图中包含多个数据系列时,添加图例可以帮助区分它们。
import matplotlib.pyplot as plt
import numpy as np

fig, (ax1, ax2) = plt.subplots(1, 2, figsize=(12, 5))

x = np.linspace(0, 10, 100)

ax1.plot(x, np.sin(x), label='Sine')
ax1.plot(x, np.cos(x), label='Cosine')
ax1.set_title('Trigonometric Functions - how2matplotlib.com')
ax1.legend()

ax2.plot(x, x**2, label='x^2')
ax2.plot(x, x**3, label='x^3')
ax2.set_title('Polynomial Functions - how2matplotlib.com')
ax2.legend()

for ax in (ax1, ax2):
    ax.set_xlabel('X-axis')
    ax.set_ylabel('Y-axis')

plt.tight_layout()
plt.show()
Output:
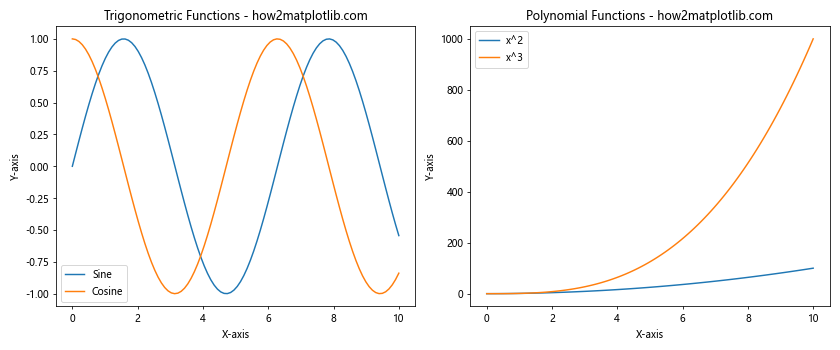
这个例子在两个子图中分别绘制了多个函数,并为每个子图添加了图例。
5.2 在子图中嵌入子图
Matplotlib允许我们在一个子图内部再嵌入一个子图,这在需要展示局部细节时非常有用。
import matplotlib.pyplot as plt
import numpy as np

fig, ax = plt.subplots(figsize=(10, 6))

# 主图
x = np.linspace(0, 10, 100)
y = np.sin(x)
ax.plot(x, y)
ax.set_title('Sine Wave with Embedded Plot - how2matplotlib.com')

# 嵌入的子图
axins = ax.inset_axes([0.5, 0.5, 0.47, 0.47])
axins.plot(x, y)
axins.set_xlim(4, 6)
axins.set_ylim(-0.2, 1)
axins.set_xticklabels([])
axins.set_yticklabels([])

ax.indicate_inset_zoom(axins, edgecolor="black")

plt.show()
Output:
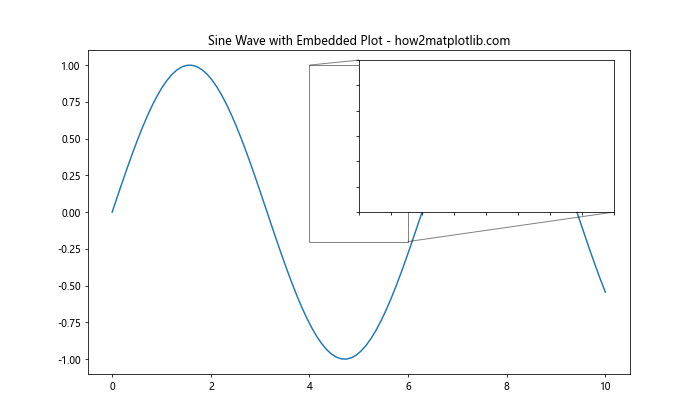
这个例子在主图中嵌入了一个放大的局部区域,使用inset_axes()函数创建嵌入的子图。
5.3 3D子图
Matplotlib还支持创建3D子图,这在可视化三维数据时非常有用。
import matplotlib.pyplot as plt
import numpy as np
from mpl_toolkits.mplot3d import Axes3D

fig = plt.figure(figsize=(12, 5))

# 2D子图
ax1 = fig.add_subplot(121)
x = np.linspace(-5, 5, 100)
y = np.sin(x)
ax1.plot(x, y)
ax1.set_title('2D Sine Wave - how2matplotlib.com')

# 3D子图
ax2 = fig.add_subplot(122, projection='3d')
x = np.linspace(-5, 5, 50)
y = np.linspace(-5, 5, 50)
X, Y = np.meshgrid(x, y)
Z = np.sin(np.sqrt(X**2 + Y**2))
ax2.plot_surface(X, Y, Z, cmap='viridis')
ax2.set_title('3D Sine Wave - how2matplotlib.com')

plt.tight_layout()
plt.show()
Output:
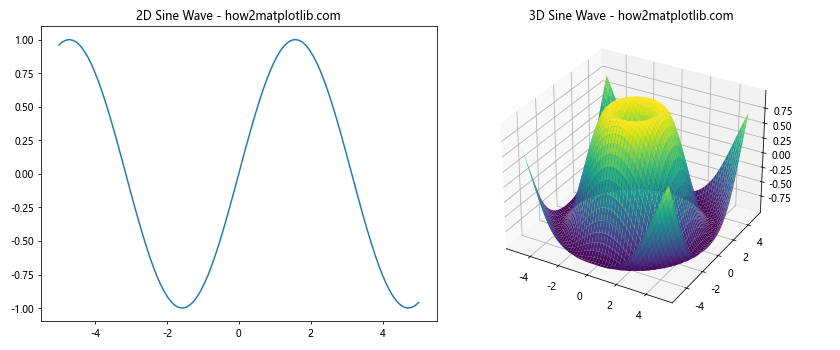
这个例子展示了如何在同一个图形中创建2D和3D子图。3D子图使用projection='3d'参数创建,并使用plot_surface()方法绘制三维曲面。
6. 动态子图
有时我们需要根据数据动态创建子图,而不是预先定义固定数量的子图。
import matplotlib.pyplot as plt
import numpy as np

data = [np.random.normal(0, std, 100) for std in range(1, 5)]

# 动态计算行数和列数
n = len(data)
cols = int(np.ceil(np.sqrt(n)))
rows = int(np.ceil(n / cols))

fig, axs = plt.subplots(rows, cols, figsize=(12, 8))
axs = axs.ravel()  # 将多维数组展平为一维

for i, d in enumerate(data):
    axs[i].hist(d, bins=20)
    axs[i].set_title(f'Std Dev {i+1} - how2matplotlib.com')

# 隐藏多余的子图
for j in range(i+1, len(axs)):
    axs[j].set_visible(False)

plt.tight_layout()
plt.show()
Output:
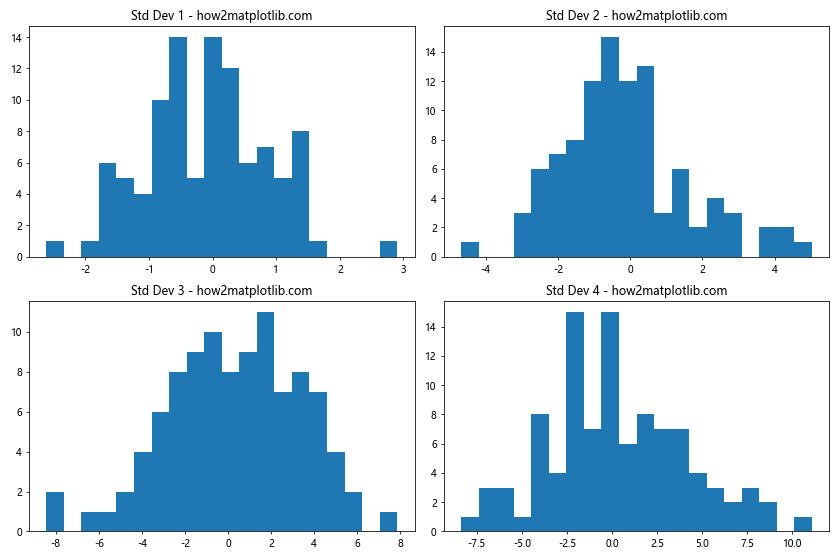
这个例子根据数据的数量动态创建子图。它计算出最佳的行数和列数,并为每个数据集创建一个直方图。多余的子图被隐藏。
7. 子图中的颜色映射
颜色映射可以帮助我们更好地可视化数据的分布或强度。
import matplotlib.pyplot as plt
import numpy as np

fig, axs = plt.subplots(2, 2, figsize=(12, 10))

# 生成2D数据
x = np.linspace(-5, 5, 100)
y = np.linspace(-5, 5, 100)
X, Y = np.meshgrid(x, y)
Z = np.sin(np.sqrt(X**2 + Y**2))

# 不同的颜色映射
cmaps = ['viridis', 'plasma', 'inferno', 'magma']

for ax, cmap in zip(axs.ravel(), cmaps):
    im = ax.imshow(Z, cmap=cmap, extent=[-5, 5, -5, 5])
    ax.set_title(f'{cmap.capitalize()} Colormap - how2matplotlib.com')
    fig.colorbar(im, ax=ax)

plt.tight_layout()
plt.show()
Output:
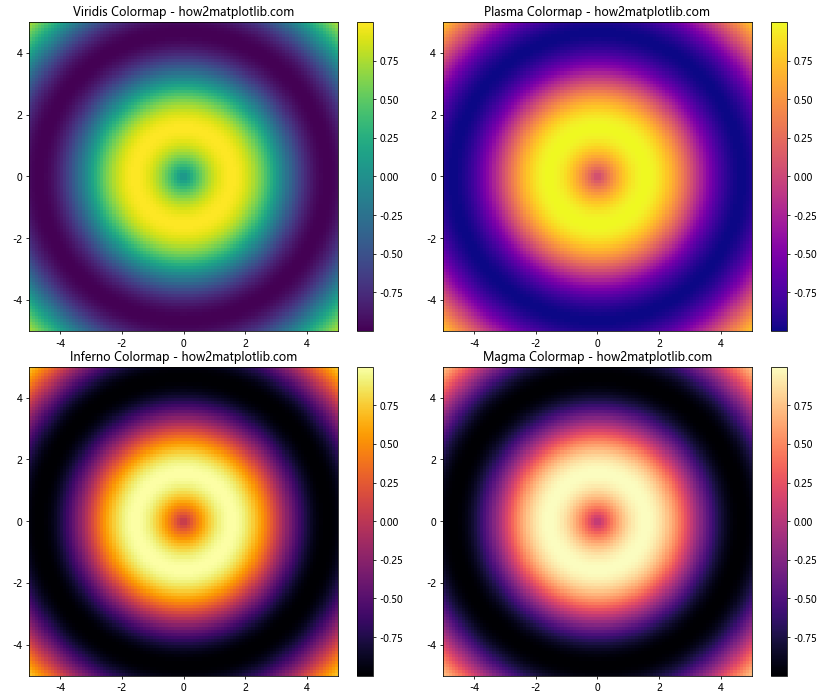
这个例子展示了如何在不同的子图中使用不同的颜色映射来可视化相同的2D数据。
8. 子图中的动画
Matplotlib还支持创建动画,我们可以在子图中展示动态变化的数据。
import matplotlib.pyplot as plt
import matplotlib.animation as animation
import numpy as np

fig, (ax1, ax2) = plt.subplots(1, 2, figsize=(12, 5))

x = np.linspace(0, 2*np.pi, 100)
line1, = ax1.plot(x, np.sin(x))
line2, = ax2.plot(x, np.cos(x))

ax1.set_title('Sine Wave - how2matplotlib.com')
ax2.set_title('Cosine Wave - how2matplotlib.com')

def animate(i):
    line1.set_ydata(np.sin(x + i/10))
    line2.set_ydata(np.cos(x + i/10))
    return line1, line2

ani = animation.FuncAnimation(fig, animate, frames=100, interval=50, blit=True)

plt.tight_layout()
plt.show()
Output:
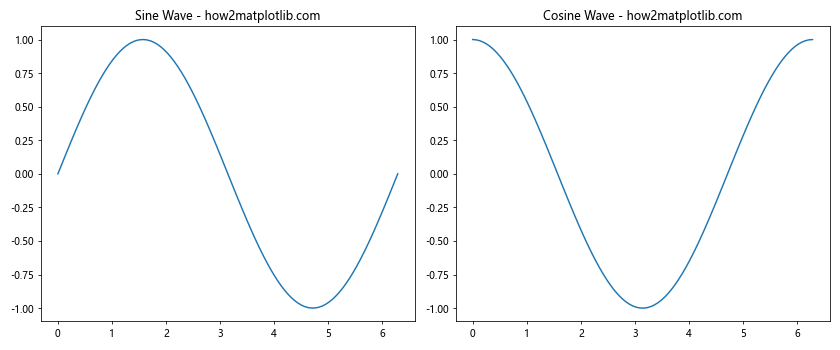
这个例子创建了一个动画,展示了正弦波和余弦波随时间变化的情况。
9. 子图中的交互性
我们可以为子图添加交互性,允许用户与图表进行交互。
import matplotlib.pyplot as plt
from matplotlib.widgets import Slider
import numpy as np

fig, (ax1, ax2) = plt.subplots(2, 1, figsize=(8, 8))
plt.subplots_adjust(bottom=0.25)

t = np.linspace(0, 1, 1000)
a0, f0 = 5, 3
s = a0 * np.sin(2 * np.pi * f0 * t)

l1, = ax1.plot(t, s, lw=2)
ax1.set_title('Sine Wave - how2matplotlib.com')

l2, = ax2.plot(t, np.cumsum(s), lw=2)
ax2.set_title('Cumulative Sum - how2matplotlib.com')

ax_freq = plt.axes([0.25, 0.1, 0.65, 0.03])
ax_amp = plt.axes([0.25, 0.15, 0.65, 0.03])

s_freq = Slider(ax_freq, 'Freq', 0.1, 30.0, valinit=f0)
s_amp = Slider(ax_amp, 'Amp', 0.1, 10.0, valinit=a0)

def update(val):
    amp = s_amp.val
    freq = s_freq.val
    l1.set_ydata(amp * np.sin(2 * np.pi * freq * t))
    l2.set_ydata(np.cumsum(amp * np.sin(2 * np.pi * freq * t)))
    fig.canvas.draw_idle()

s_freq.on_changed(update)
s_amp.on_changed(update)

plt.show()
Output:
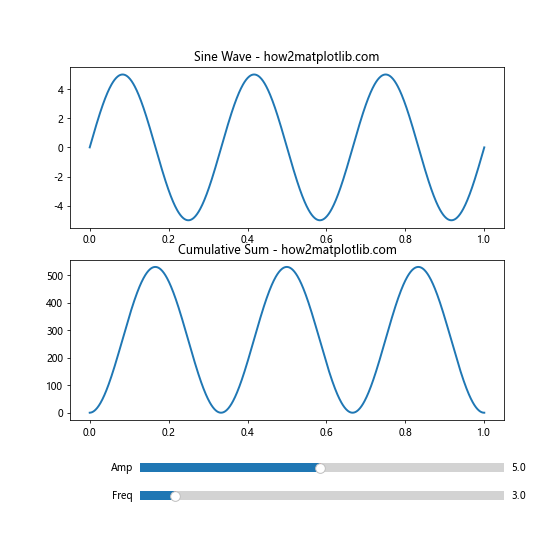
这个例子创建了一个交互式图表,用户可以通过滑块调整正弦波的频率和振幅,同时观察其累积和的变化。
10. 保存子图
最后,我们可能需要将创建的子图保存为图像文件。
import matplotlib.pyplot as plt
import numpy as np

fig, axs = plt.subplots(2, 2, figsize=(10, 8))

for i in range(2):
    for j in range(2):
        x = np.linspace(0, 10, 100)
        y = np.random.rand(100)
        axs[i, j].plot(x, y)
        axs[i, j].set_title(f'Plot {i*2+j+1} - how2matplotlib.com')

plt.tight_layout()

# 保存图像
plt.savefig('subplots_example.png', dpi=300, bbox_inches='tight')
plt.show()
Output:
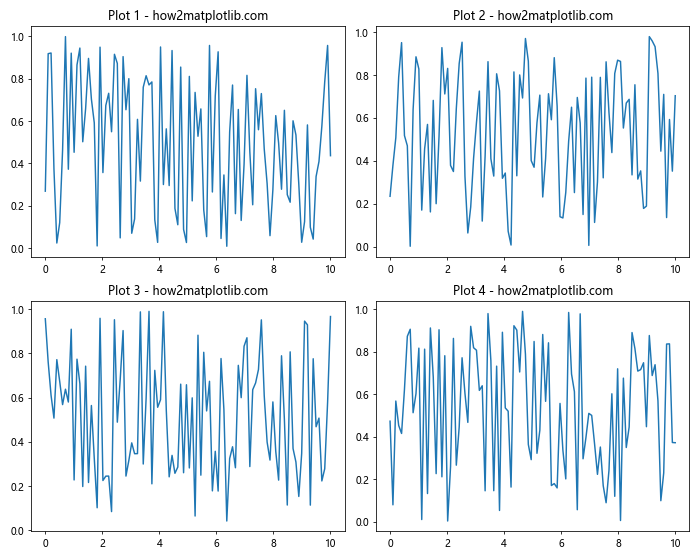
这个例子展示了如何将创建的子图保存为高质量的PNG图像文件。dpi参数控制图像的分辨率,bbox_inches='tight'确保图像边缘没有多余的空白。
结论
Matplotlib的子图功能为数据可视化提供了强大而灵活的工具。通过本文介绍的各种技巧和方法,你可以创建复杂的多图布局,展示丰富的数据内容,并进行深入的数据分析和比较。从基本的子图创建到高级的布局技巧,从静态图表到动态交互,Matplotlib都能满足各种可视化需求。掌握这些技巧将大大提升你的数据可视化能力,帮助你更有效地传达数据洞察。
记住,创建有效的数据可视化不仅仅是技术问题,还需要考虑数据的特性、受众的需求以及你想要传达的信息。合理使用子图可以帮助你组织和呈现复杂的数据关系,使你的数据故事更加清晰和有说服力。随着实践的增加,你将能够更加自如地运用这些技巧,创造出既美观又富有洞察力的数据可视化作品。
 极客教程
极客教程