Matplotlib中创建多个子图的全面指南
参考:How to Create Multiple Subplots in Matplotlib
Matplotlib是Python中最流行的数据可视化库之一,它提供了强大的工具来创建各种类型的图表和绘图。在数据分析和科学研究中,我们经常需要在同一个图形窗口中展示多个相关的图表。这就需要用到Matplotlib中的子图(subplots)功能。本文将全面介绍如何在Matplotlib中创建和使用多个子图,帮助你更好地展示和比较数据。
1. 子图的基本概念
在Matplotlib中,子图是指在一个图形窗口中创建的多个独立的绘图区域。每个子图可以包含自己的坐标轴、标题和数据。使用子图可以让我们在一个窗口中同时展示多个相关的图表,方便比较和分析数据。
创建子图的最基本方法是使用plt.subplot()函数。这个函数接受三个参数:行数、列数和子图索引。例如:
import matplotlib.pyplot as plt
import numpy as np

# 创建数据
x = np.linspace(0, 10, 100)
y1 = np.sin(x)
y2 = np.cos(x)

# 创建2x1的子图布局
plt.subplot(2, 1, 1)
plt.plot(x, y1)
plt.title('Sine Wave - how2matplotlib.com')

plt.subplot(2, 1, 2)
plt.plot(x, y2)
plt.title('Cosine Wave - how2matplotlib.com')

plt.tight_layout()
plt.show()
Output:
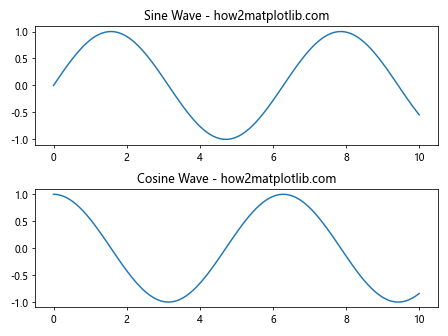
在这个例子中,我们创建了一个2行1列的子图布局。第一个子图显示正弦波,第二个子图显示余弦波。plt.tight_layout()函数用于自动调整子图之间的间距,使布局更加紧凑。
2. 使用plt.subplots()创建子图
虽然plt.subplot()函数很有用,但当需要创建多个子图时,使用plt.subplots()函数会更加方便。这个函数可以一次性创建多个子图,并返回图形对象和子图数组。
import matplotlib.pyplot as plt
import numpy as np

# 创建数据
x = np.linspace(0, 10, 100)
y1 = np.sin(x)
y2 = np.cos(x)
y3 = np.tan(x)

# 创建2x2的子图布局
fig, axs = plt.subplots(2, 2, figsize=(10, 8))

axs[0, 0].plot(x, y1)
axs[0, 0].set_title('Sine Wave - how2matplotlib.com')

axs[0, 1].plot(x, y2)
axs[0, 1].set_title('Cosine Wave - how2matplotlib.com')

axs[1, 0].plot(x, y3)
axs[1, 0].set_title('Tangent Wave - how2matplotlib.com')

axs[1, 1].plot(x, y1 + y2)
axs[1, 1].set_title('Sine + Cosine - how2matplotlib.com')

plt.tight_layout()
plt.show()
Output:
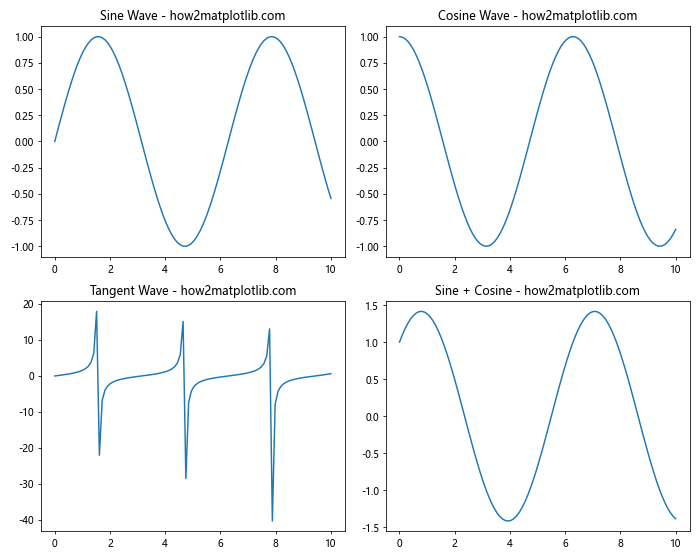
在这个例子中,我们创建了一个2×2的子图布局。fig是整个图形对象,axs是一个包含所有子图的二维数组。我们可以通过索引来访问每个子图并在其上绘制数据。
3. 调整子图布局
有时候,我们可能需要更灵活的子图布局。Matplotlib提供了gridspec模块,允许我们创建复杂的子图布局。
import matplotlib.pyplot as plt
import matplotlib.gridspec as gridspec
import numpy as np

# 创建数据
x = np.linspace(0, 10, 100)
y1 = np.sin(x)
y2 = np.cos(x)
y3 = np.tan(x)

# 创建自定义布局
fig = plt.figure(figsize=(12, 8))
gs = gridspec.GridSpec(2, 3)

ax1 = fig.add_subplot(gs[0, :2])
ax2 = fig.add_subplot(gs[0, 2])
ax3 = fig.add_subplot(gs[1, :])

ax1.plot(x, y1)
ax1.set_title('Sine Wave - how2matplotlib.com')

ax2.plot(x, y2)
ax2.set_title('Cosine Wave - how2matplotlib.com')

ax3.plot(x, y3)
ax3.set_title('Tangent Wave - how2matplotlib.com')

plt.tight_layout()
plt.show()
Output:
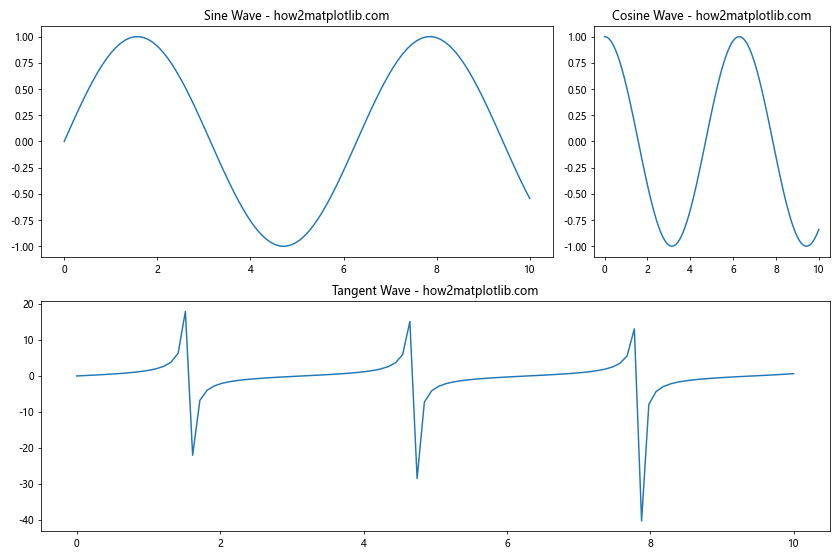
在这个例子中,我们使用gridspec创建了一个2行3列的网格,然后自定义了子图的位置和大小。第一个子图占据了第一行的前两列,第二个子图占据第一行的最后一列,第三个子图占据整个第二行。
4. 共享轴
当我们有多个子图时,有时希望它们共享相同的x轴或y轴。Matplotlib提供了简单的方法来实现这一点。
import matplotlib.pyplot as plt
import numpy as np

# 创建数据
x = np.linspace(0, 10, 100)
y1 = np.sin(x)
y2 = np.cos(x)

# 创建共享x轴的子图
fig, (ax1, ax2) = plt.subplots(2, 1, sharex=True, figsize=(8, 6))

ax1.plot(x, y1)
ax1.set_title('Sine Wave - how2matplotlib.com')

ax2.plot(x, y2)
ax2.set_title('Cosine Wave - how2matplotlib.com')

plt.tight_layout()
plt.show()
Output:
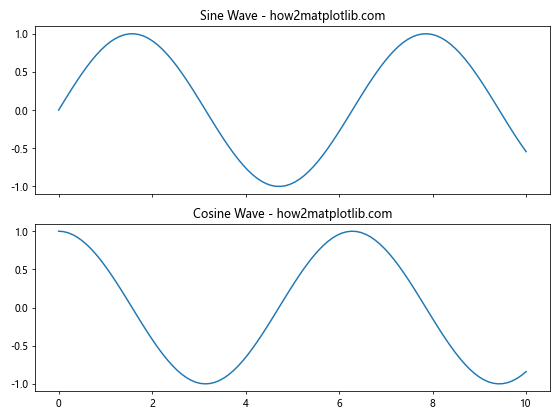
在这个例子中,我们创建了两个垂直排列的子图,它们共享相同的x轴。这样可以节省空间,并使比较不同数据集更加容易。
5. 子图中的子图
Matplotlib还允许我们在子图中创建更多的子图,这对于创建复杂的嵌套布局非常有用。
import matplotlib.pyplot as plt
import numpy as np

# 创建数据
x = np.linspace(0, 10, 100)
y1 = np.sin(x)
y2 = np.cos(x)
y3 = np.tan(x)

# 创建主子图
fig, (ax1, ax2) = plt.subplots(1, 2, figsize=(12, 5))

ax1.plot(x, y1)
ax1.set_title('Sine Wave - how2matplotlib.com')

# 在右侧子图中创建更多子图
gs = ax2.get_gridspec()
subgs = gs[1].subgridspec(2, 2)

for i, (row, col) in enumerate([(0, 0), (0, 1), (1, 0), (1, 1)]):
    subax = fig.add_subplot(subgs[row, col])
    subax.plot(x, y2 + i*0.5)
    subax.set_title(f'Cosine Wave {i+1} - how2matplotlib.com')

plt.tight_layout()
plt.show()
Output:
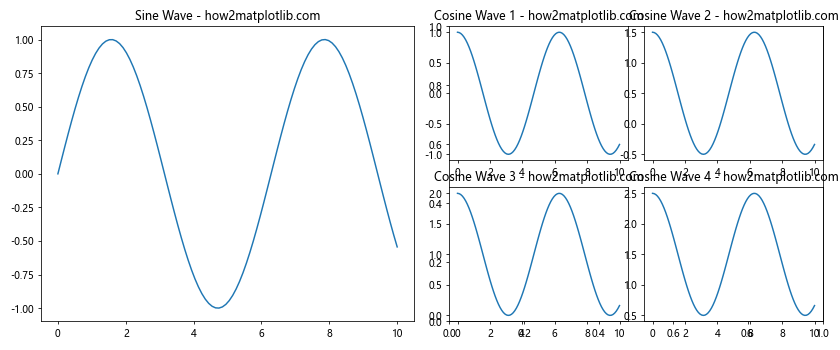
在这个例子中,我们创建了两个主要的子图。在右侧的子图中,我们又创建了一个2×2的子图网格,展示了余弦波的不同变体。
6. 不同类型的图表组合
子图的一个强大功能是可以在同一个图形窗口中组合不同类型的图表。这对于展示多维数据或不同角度的数据分析结果非常有用。
import matplotlib.pyplot as plt
import numpy as np

# 创建数据
x = np.linspace(0, 10, 100)
y1 = np.sin(x)
y2 = np.random.normal(0, 1, 100)

# 创建2x2的子图布局
fig, ((ax1, ax2), (ax3, ax4)) = plt.subplots(2, 2, figsize=(12, 10))

# 线图
ax1.plot(x, y1)
ax1.set_title('Line Plot - how2matplotlib.com')

# 散点图
ax2.scatter(x, y2)
ax2.set_title('Scatter Plot - how2matplotlib.com')

# 柱状图
ax3.bar(x[::10], y1[::10])
ax3.set_title('Bar Plot - how2matplotlib.com')

# 直方图
ax4.hist(y2, bins=20)
ax4.set_title('Histogram - how2matplotlib.com')

plt.tight_layout()
plt.show()
Output:
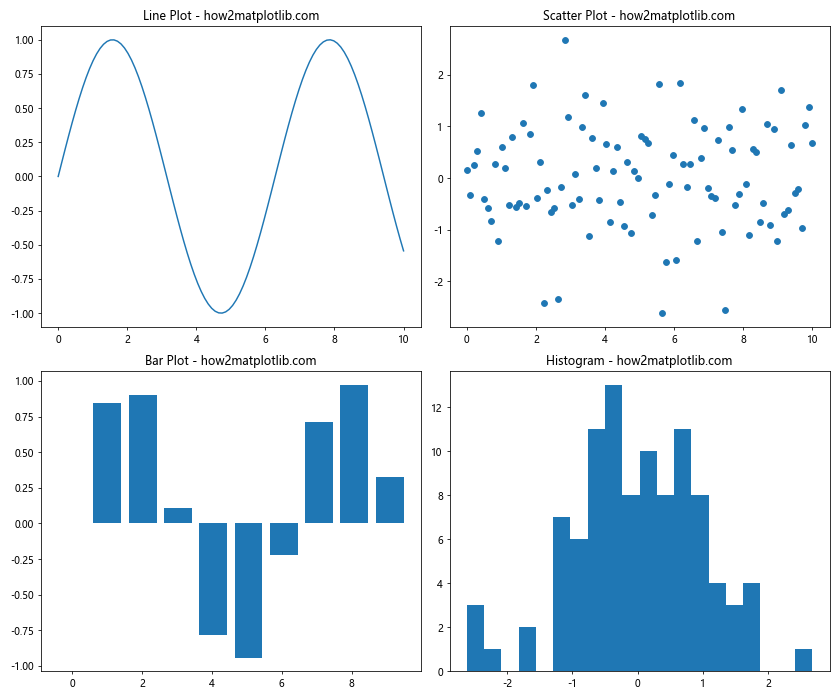
这个例子展示了如何在一个图形窗口中组合线图、散点图、柱状图和直方图。这种组合可以帮助我们从不同角度理解数据。
7. 自定义子图大小
有时,我们可能希望某些子图比其他子图大或小。Matplotlib允许我们通过调整子图的相对大小来实现这一点。
import matplotlib.pyplot as plt
import numpy as np

# 创建数据
x = np.linspace(0, 10, 100)
y1 = np.sin(x)
y2 = np.cos(x)

# 创建具有不同大小的子图
fig = plt.figure(figsize=(12, 8))
gs = fig.add_gridspec(3, 3)

ax1 = fig.add_subplot(gs[0, :])
ax2 = fig.add_subplot(gs[1:, 0])
ax3 = fig.add_subplot(gs[1:, 1:])

ax1.plot(x, y1)
ax1.set_title('Large Sine Wave - how2matplotlib.com')

ax2.plot(y2, x)
ax2.set_title('Vertical Cosine Wave - how2matplotlib.com')

ax3.plot(x, y1 + y2)
ax3.set_title('Combined Wave - how2matplotlib.com')

plt.tight_layout()
plt.show()
Output:
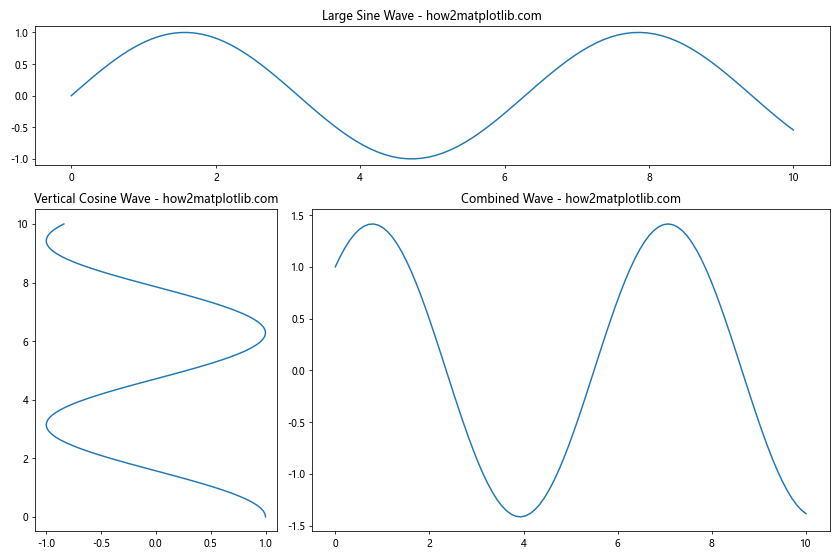
在这个例子中,我们创建了三个不同大小的子图。第一个子图占据了整个顶部行,第二个子图占据了左侧的两个单元格,第三个子图占据了右下角的四个单元格。
8. 添加子图标题和总标题
为了使图表更加清晰和信息丰富,我们可以为每个子图添加标题,并为整个图形添加一个总标题。
import matplotlib.pyplot as plt
import numpy as np

# 创建数据
x = np.linspace(0, 10, 100)
y1 = np.sin(x)
y2 = np.cos(x)

# 创建2x2的子图布局
fig, axs = plt.subplots(2, 2, figsize=(12, 10))

axs[0, 0].plot(x, y1)
axs[0, 0].set_title('Sine Wave - how2matplotlib.com')

axs[0, 1].plot(x, y2)
axs[0, 1].set_title('Cosine Wave - how2matplotlib.com')

axs[1, 0].plot(x, y1 ** 2)
axs[1, 0].set_title('Squared Sine Wave - how2matplotlib.com')

axs[1, 1].plot(x, y2 ** 2)
axs[1, 1].set_title('Squared Cosine Wave - how2matplotlib.com')

# 添加总标题
fig.suptitle('Trigonometric Functions and Their Squares - how2matplotlib.com', fontsize=16)

plt.tight_layout()
plt.show()
Output:
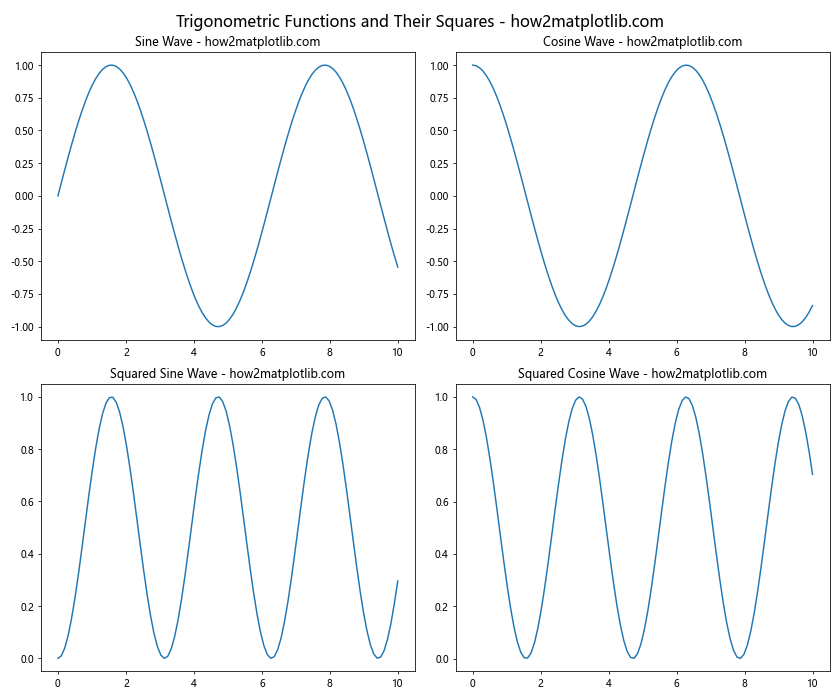
在这个例子中,我们为每个子图添加了标题,并使用fig.suptitle()为整个图形添加了一个总标题。这有助于观众快速理解图表的整体主题和各个部分的内容。
9. 调整子图间距
默认情况下,Matplotlib会自动调整子图之间的间距。但有时我们可能需要手动调整这些间距以获得更好的视觉效果。
import matplotlib.pyplot as plt
import numpy as np

# 创建数据
x = np.linspace(0, 10, 100)
y1 = np.sin(x)
y2 = np.cos(x)

# 创建2x2的子图布局
fig, axs = plt.subplots(2, 2, figsize=(12, 10))

axs[0, 0].plot(x, y1)
axs[0, 0].set_title('Sine Wave - how2matplotlib.com')

axs[0, 1].plot(x, y2)
axs[0, 1].set_title('Cosine Wave - how2matplotlib.com')

axs[1, 0].plot(x, y1 ** 2)
axs[1, 0].set_title('Squared Sine Wave - how2matplotlib.com')

axs[1, 1].plot(x, y2 ** 2)
axs[1, 1].set_title('Squared Cosine Wave - how2matplotlib.com')

# 调整子图间距
plt.subplots_adjust(wspace=0.3, hspace=0.3)

plt.show()
Output:
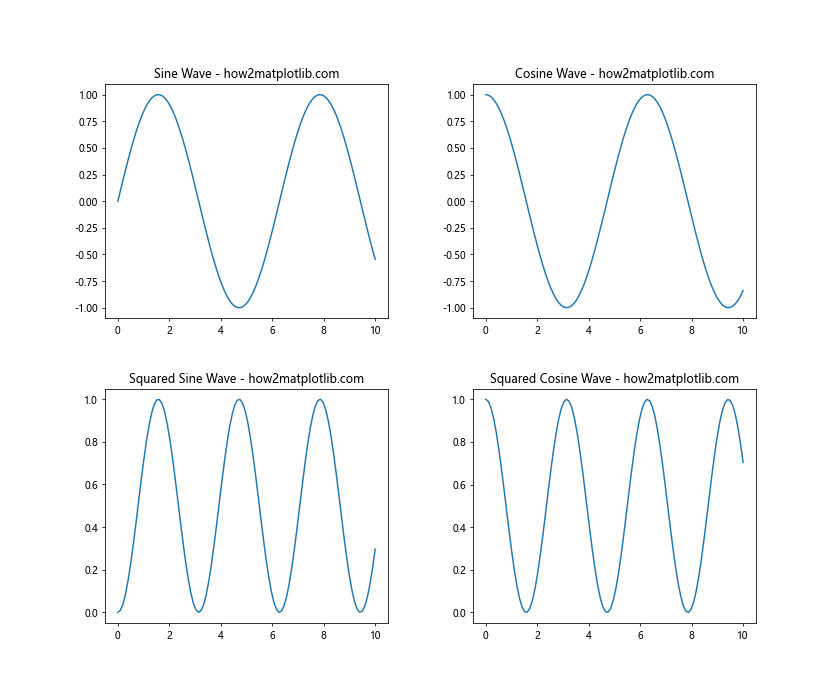
在这个例子中,我们使用plt.subplots_adjust()函数来调整子图之间的水平间距(wspace)和垂直间距(hspace)。这允许我们精细控制图表的布局。
10. 在子图中添加图例
当一个子图中包含多条线或多个数据系列时,添加图例可以帮助观众理解每条线代表的含义。
import matplotlib.pyplot as plt
import numpy as np

# 创建数据
x = np.linspace(0, 10, 100)
y1 = np.sin(x)
y2 = np.cos(x)
y3 = np.tan(x)

# 创建2x2的子图布局
fig, axs = plt.subplots(2, 2, figsize=(12, 10))

axs[0, 0].plot(x, y1, label='Sine')
axs[0, 0].plot(x, y2, label='Cosine')
axs[0, 0].set_title('Sine and Cosine - how2matplotlib.com')
axs[0, 0].legend()

axs[0, 1].plot(x, y3, label='Tangent')
axs[0, 1].set_title('Tangent - how2matplotlib.com')
axs[0, 1].legend()

axs[1, 0].plot(x, y1 ** 2, label='Squared Sine')
axs[1, 0].plot(x, y2 ** 2, label='Squared Cosine')
axs[1, 0].set_title('Squared Sine and Cosine - how2matplotlib.com')
axs[1, 0].legend()

axs[1, 1].plot(x, np.abs(y3), label='Absolute Tangent')
axs[1, 1].set_title('Absolute Tangent - how2matplotlib.com')
axs[1, 1].legend()

plt.tight_layout()
plt.show()
Output:
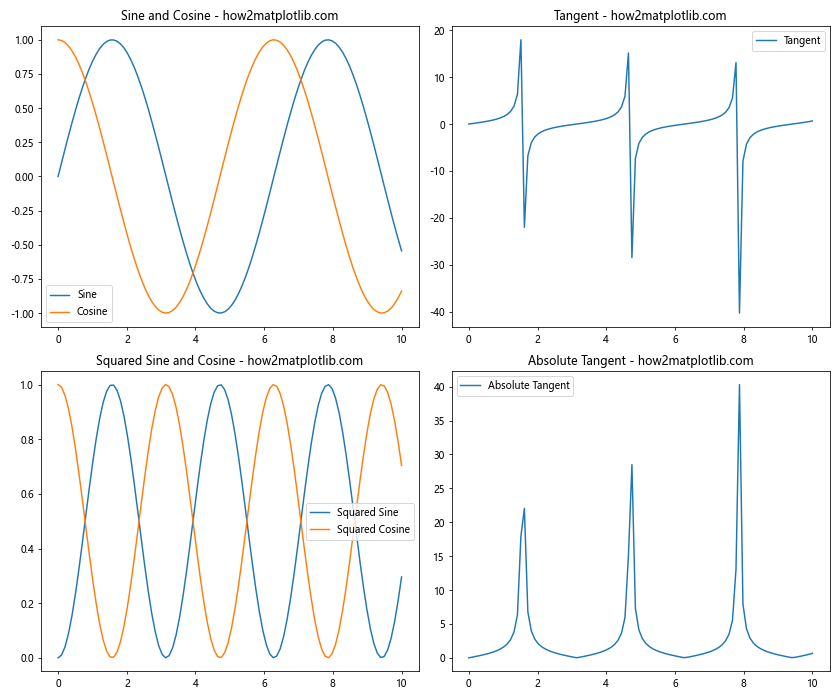
在这个例子中,我们在每个子图中添加了图例。通过为每条线设置label参数,然后调用legend()方法,我们可以轻松地为每个子图添加图例。
11. 使用不同的坐标系
Matplotlib不仅支持常规的笛卡尔坐标系,还支持其他类型的坐标系,如极坐标系。我们可以在不同的子图中使用不同的坐标系来展示数据。
import matplotlib.pyplot as plt
import numpy as np

# 创建数据
theta = np.linspace(0, 2*np.pi, 100)
r = np.sin(4*theta)
x = np.linspace(0, 10, 100)
y = np.sin(x)

# 创建1x2的子图布局
fig, (ax1, ax2) = plt.subplots(1, 2, figsize=(12, 5))

# 笛卡尔坐标系
ax1.plot(x, y)
ax1.set_title('Sine Wave in Cartesian Coordinates - how2matplotlib.com')

# 极坐标系
ax2 = plt.subplot(122, projection='polar')
ax2.plot(theta, r)
ax2.set_title('Rose Curve in Polar Coordinates - how2matplotlib.com')

plt.tight_layout()
plt.show()
Output:
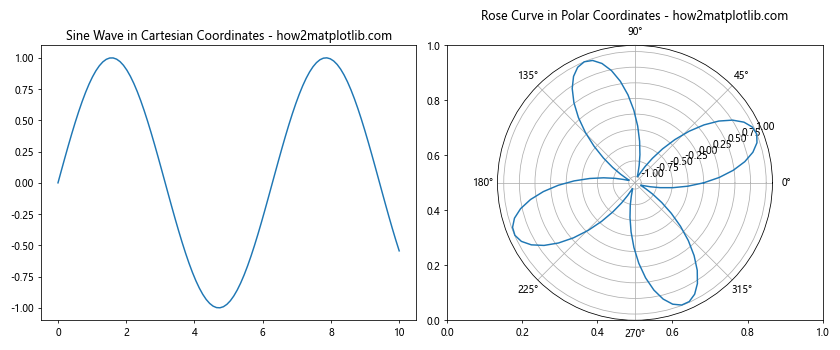
这个例子展示了如何在一个图形中同时使用笛卡尔坐标系和极坐标系。左侧的子图使用常规的笛卡尔坐标系绘制正弦波,而右侧的子图使用极坐标系绘制玫瑰曲线。
12. 3D子图
Matplotlib还支持创建3D图表。我们可以在子图中混合使用2D和3D图表来展示多维数据。
import matplotlib.pyplot as plt
import numpy as np
from mpl_toolkits.mplot3d import Axes3D

# 创建数据
x = np.linspace(-5, 5, 50)
y = np.linspace(-5, 5, 50)
X, Y = np.meshgrid(x, y)
Z = np.sin(np.sqrt(X**2 + Y**2))

# 创建1x2的子图布局
fig = plt.figure(figsize=(12, 5))

# 2D等高线图
ax1 = fig.add_subplot(121)
cs = ax1.contourf(X, Y, Z)
ax1.set_title('2D Contour Plot - how2matplotlib.com')
fig.colorbar(cs, ax=ax1)

# 3D表面图
ax2 = fig.add_subplot(122, projection='3d')
surf = ax2.plot_surface(X, Y, Z, cmap='viridis')
ax2.set_title('3D Surface Plot - how2matplotlib.com')
fig.colorbar(surf, ax=ax2, shrink=0.5, aspect=5)

plt.tight_layout()
plt.show()
Output:
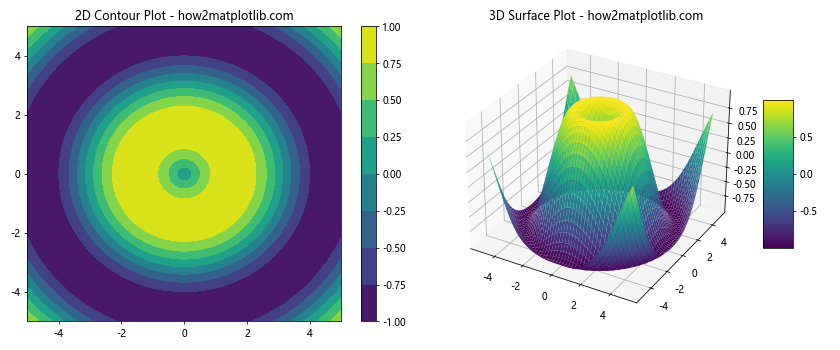
这个例子展示了如何在一个图形中同时使用2D和3D子图。左侧的子图是一个2D等高线图,右侧的子图是一个3D表面图,两者都展示了相同的数据集。
13. 动态子图布局
有时,我们可能需要根据数据的数量动态创建子图。Matplotlib允许我们根据需要灵活地创建子图布局。
import matplotlib.pyplot as plt
import numpy as np

# 创建数据
data = [np.random.normal(0, std, 100) for std in range(1, 6)]

# 计算需要的行数和列数
n = len(data)
cols = 3
rows = (n + cols - 1) // cols

# 创建子图
fig, axs = plt.subplots(rows, cols, figsize=(15, 5*rows))
axs = axs.flatten()  # 将多维数组展平为一维

for i, d in enumerate(data):
    axs[i].hist(d, bins=20)
    axs[i].set_title(f'Histogram {i+1} - how2matplotlib.com')

# 隐藏多余的子图
for i in range(n, len(axs)):
    fig.delaxes(axs[i])

plt.tight_layout()
plt.show()
Output:
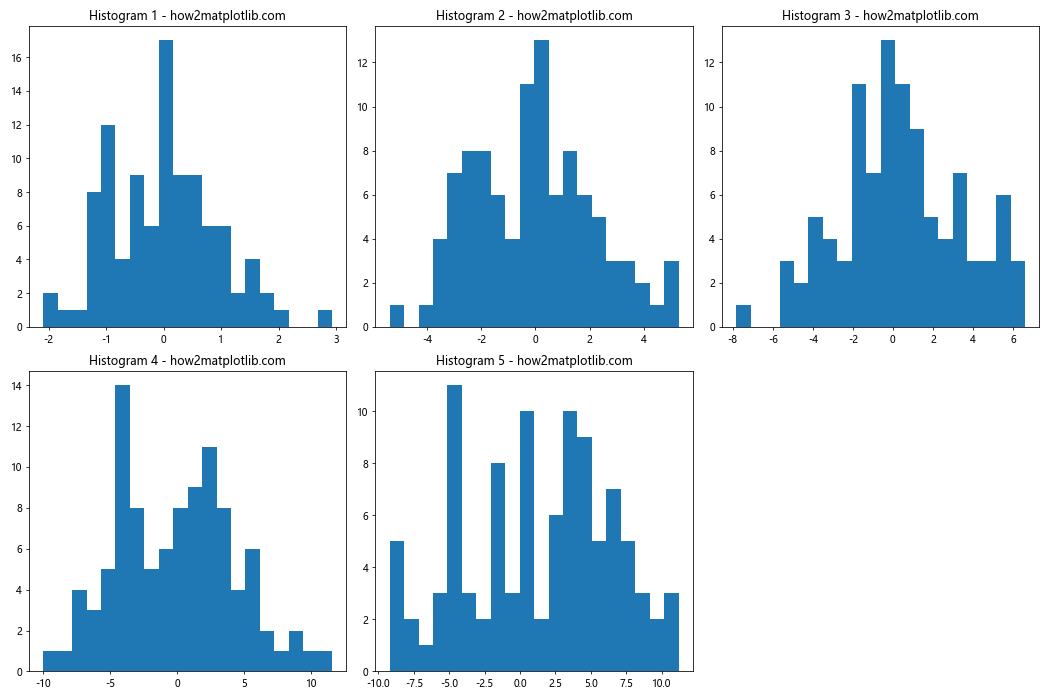
这个例子展示了如何根据数据的数量动态创建子图。我们首先计算需要的行数和列数,然后创建子图。对于多余的子图,我们使用fig.delaxes()方法将其删除。
14. 子图中的图像
Matplotlib不仅可以绘制图表,还可以在子图中显示图像。这对于图像处理和计算机视觉任务非常有用。
import matplotlib.pyplot as plt
import numpy as np

# 创建示例图像
image1 = np.random.rand(100, 100)
image2 = np.random.rand(100, 100)
image3 = np.random.rand(100, 100)

# 创建1x3的子图布局
fig, (ax1, ax2, ax3) = plt.subplots(1, 3, figsize=(15, 5))

# 显示图像
im1 = ax1.imshow(image1, cmap='viridis')
ax1.set_title('Image 1 - how2matplotlib.com')
fig.colorbar(im1, ax=ax1)

im2 = ax2.imshow(image2, cmap='plasma')
ax2.set_title('Image 2 - how2matplotlib.com')
fig.colorbar(im2, ax=ax2)

im3 = ax3.imshow(image3, cmap='inferno')
ax3.set_title('Image 3 - how2matplotlib.com')
fig.colorbar(im3, ax=ax3)

plt.tight_layout()
plt.show()
Output:
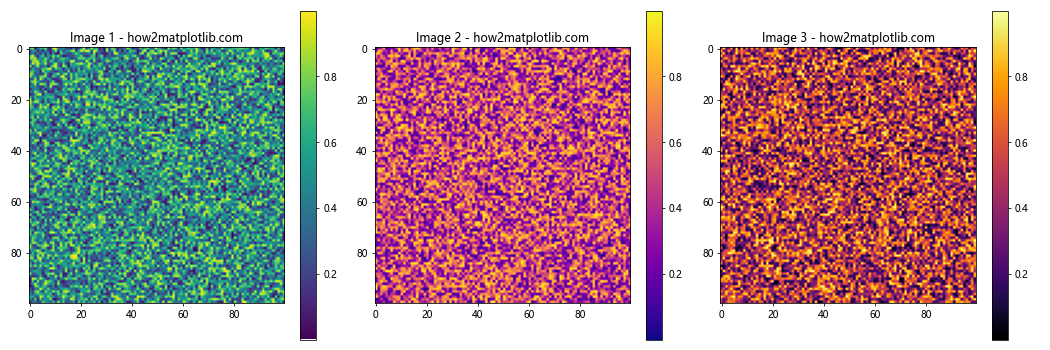
这个例子展示了如何在子图中显示图像。我们创建了三个随机图像,并在三个子图中分别显示它们,每个子图都有自己的颜色映射和颜色条。
15. 子图中的文本注释
有时,我们可能需要在子图中添加文本注释来解释数据或突出显示某些特征。Matplotlib提供了多种方法来添加文本和注释。
import matplotlib.pyplot as plt
import numpy as np

# 创建数据
x = np.linspace(0, 10, 100)
y1 = np.sin(x)
y2 = np.cos(x)

# 创建2x1的子图布局
fig, (ax1, ax2) = plt.subplots(2, 1, figsize=(10, 10))

# 第一个子图
ax1.plot(x, y1)
ax1.set_title('Sine Wave - how2matplotlib.com')
ax1.text(5, 0.5, 'Peak', fontsize=12, ha='center')
ax1.annotate('Trough', xy=(3*np.pi/2, -1), xytext=(8, -0.5),
             arrowprops=dict(facecolor='black', shrink=0.05))

# 第二个子图
ax2.plot(x, y2)
ax2.set_title('Cosine Wave - how2matplotlib.com')
ax2.text(5, -0.5, 'Trough', fontsize=12, ha='center')
ax2.annotate('Peak', xy=(0, 1), xytext=(2, 0.5),
             arrowprops=dict(facecolor='black', shrink=0.05))

plt.tight_layout()
plt.show()
Output:
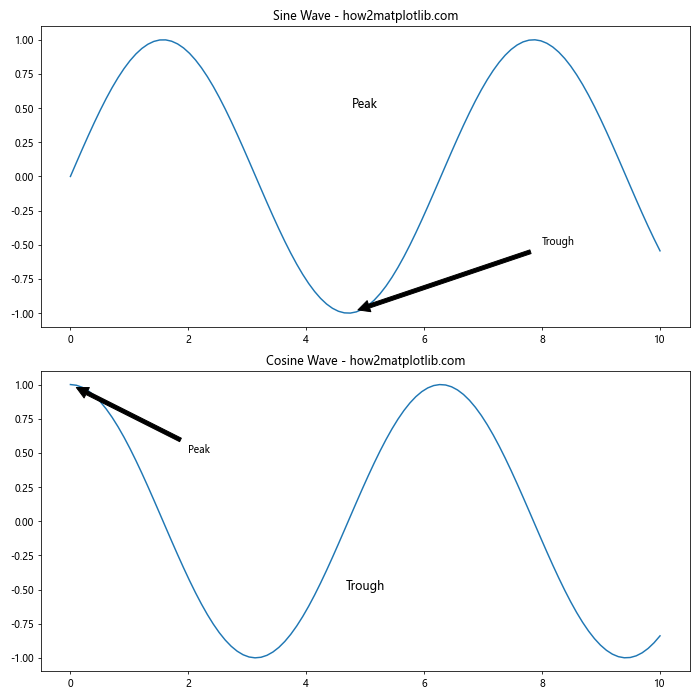
在这个例子中,我们使用text()方法在图表上添加简单的文本,使用annotate()方法添加带箭头的注释。这些注释可以帮助观众更好地理解图表中的重要特征。
结论
通过本文的详细介绍和丰富的示例,我们深入探讨了如何在Matplotlib中创建和使用多个子图。从基本的子图创建到复杂的布局调整,从2D图表到3D可视化,我们涵盖了广泛的主题。这些技术可以帮助你更有效地展示和比较数据,创建信息丰富的可视化效果。
记住,创建好的数据可视化不仅仅是技术问题,还需要考虑数据的特性、目标受众和你想传达的信息。通过练习和实验,你可以掌握这些技巧,并创建出既美观又有洞察力的图表。
无论你是数据科学家、研究人员还是学生,掌握Matplotlib中的多子图技术都将大大提升你的数据可视化能力。希望这篇文章能够帮助你更好地理解和应用这些概念,创建出令人印象深刻的数据可视化作品。
 极客教程
极客教程