Matplotlib中如何创建不同大小的子图:全面指南
参考:How to Create Different Subplot Sizes in Matplotlib
Matplotlib是Python中最流行的数据可视化库之一,它提供了强大而灵活的工具来创建各种类型的图表。在数据分析和科学研究中,我们经常需要在同一个图形中展示多个相关但不同的图表。这就需要用到Matplotlib的子图(subplot)功能。本文将详细介绍如何在Matplotlib中创建不同大小的子图,以满足各种复杂的可视化需求。
1. 子图的基本概念
在开始创建不同大小的子图之前,我们需要先了解子图的基本概念。在Matplotlib中,一个Figure(图形)可以包含多个Axes(坐标轴),每个Axes就是一个子图。通过合理安排这些子图,我们可以在一个Figure中展示多个相关的图表。
以下是一个创建基本子图的示例:
import matplotlib.pyplot as plt
import numpy as np

# 创建一个2x2的子图网格
fig, axs = plt.subplots(2, 2)

# 在每个子图中绘制不同的内容
x = np.linspace(0, 10, 100)
axs[0, 0].plot(x, np.sin(x))
axs[0, 0].set_title('Sine Wave - how2matplotlib.com')

axs[0, 1].plot(x, np.cos(x))
axs[0, 1].set_title('Cosine Wave - how2matplotlib.com')

axs[1, 0].plot(x, np.exp(x))
axs[1, 0].set_title('Exponential - how2matplotlib.com')

axs[1, 1].plot(x, np.log(x))
axs[1, 1].set_title('Logarithm - how2matplotlib.com')

plt.tight_layout()
plt.show()
Output:
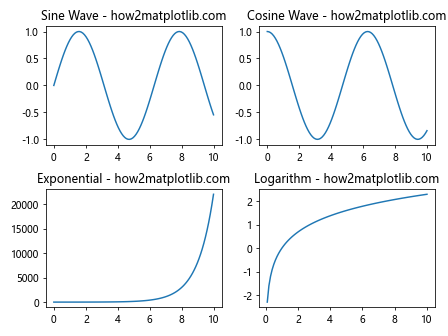
在这个例子中,我们创建了一个2×2的子图网格,每个子图大小相同。plt.subplots(2, 2)函数返回一个Figure对象和一个2×2的Axes数组。我们可以通过索引axs[i, j]来访问每个子图,并在其中绘制不同的内容。
2. 使用gridspec创建不同大小的子图
虽然plt.subplots()函数非常方便,但它创建的子图大小都是相同的。如果我们想要创建不同大小的子图,就需要使用gridspec模块。gridspec允许我们更灵活地定义子图的布局和大小。
以下是一个使用gridspec创建不同大小子图的示例:
import matplotlib.pyplot as plt
import matplotlib.gridspec as gridspec
import numpy as np

fig = plt.figure(figsize=(12, 8))
gs = gridspec.GridSpec(3, 3)

ax1 = fig.add_subplot(gs[0, :])
ax2 = fig.add_subplot(gs[1, :-1])
ax3 = fig.add_subplot(gs[1:, -1])
ax4 = fig.add_subplot(gs[-1, 0])
ax5 = fig.add_subplot(gs[-1, -2])

x = np.linspace(0, 10, 100)
ax1.plot(x, np.sin(x))
ax1.set_title('Sine Wave - how2matplotlib.com')

ax2.plot(x, np.cos(x))
ax2.set_title('Cosine Wave - how2matplotlib.com')

ax3.plot(x, np.exp(x))
ax3.set_title('Exponential - how2matplotlib.com')

ax4.plot(x, np.log(x))
ax4.set_title('Logarithm - how2matplotlib.com')

ax5.plot(x, x**2)
ax5.set_title('Quadratic - how2matplotlib.com')

plt.tight_layout()
plt.show()
Output:
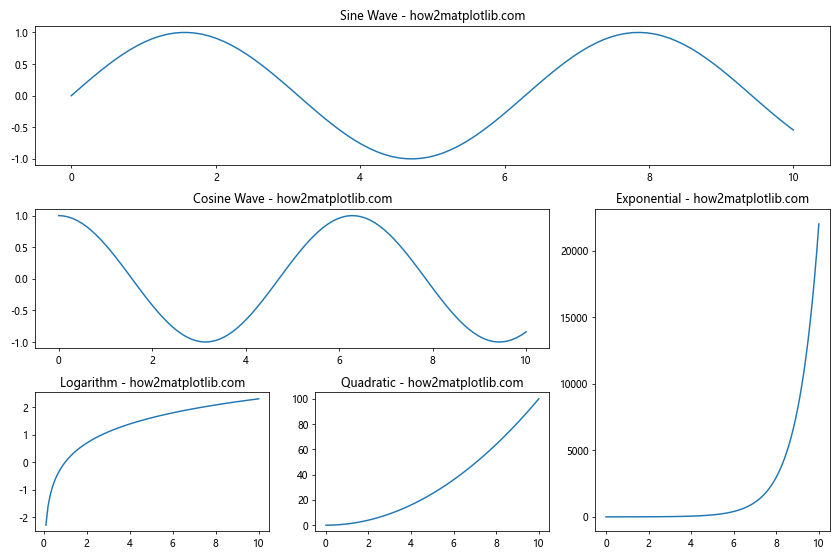
在这个例子中,我们创建了一个3×3的网格,但并没有使用所有的网格单元。我们使用切片语法来定义每个子图占据的网格区域。例如,gs[0, :]表示第一行的所有列,创建了一个跨越整个顶部的大子图。
3. 使用add_gridspec方法
从Matplotlib 3.1版本开始,Figure对象提供了一个add_gridspec方法,这是创建不同大小子图的另一种方便方法。
以下是使用add_gridspec方法的示例:
import matplotlib.pyplot as plt
import numpy as np

fig = plt.figure(figsize=(12, 8))
gs = fig.add_gridspec(3, 3)

ax1 = fig.add_subplot(gs[0, :])
ax2 = fig.add_subplot(gs[1, :-1])
ax3 = fig.add_subplot(gs[1:, -1])
ax4 = fig.add_subplot(gs[-1, 0])
ax5 = fig.add_subplot(gs[-1, -2])

x = np.linspace(0, 10, 100)
ax1.plot(x, np.sin(x))
ax1.set_title('Sine Wave - how2matplotlib.com')

ax2.plot(x, np.cos(x))
ax2.set_title('Cosine Wave - how2matplotlib.com')

ax3.plot(x, np.exp(x))
ax3.set_title('Exponential - how2matplotlib.com')

ax4.plot(x, np.log(x))
ax4.set_title('Logarithm - how2matplotlib.com')

ax5.plot(x, x**2)
ax5.set_title('Quadratic - how2matplotlib.com')

plt.tight_layout()
plt.show()
Output:
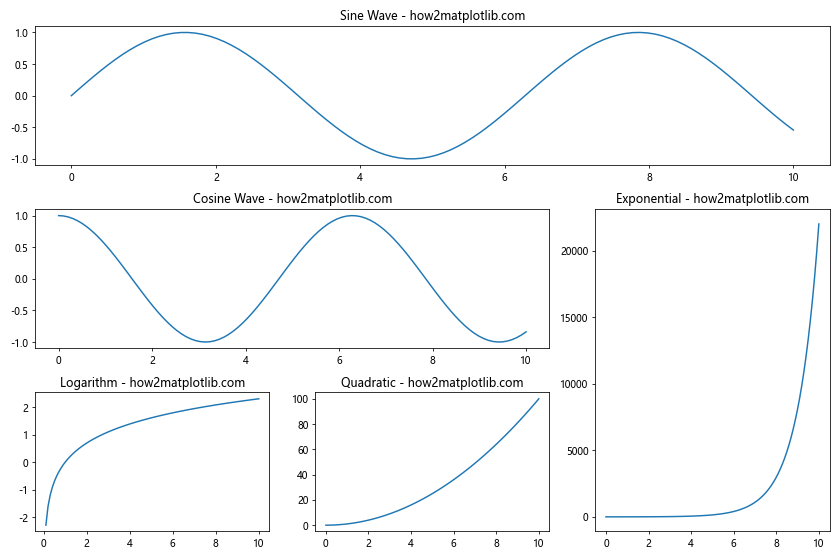
这个方法的优点是不需要导入额外的gridspec模块,代码更加简洁。
4. 使用width_ratios和height_ratios
如果我们想更精确地控制子图的宽度和高度比例,可以使用width_ratios和height_ratios参数。
以下是一个示例:
import matplotlib.pyplot as plt
import numpy as np

fig, axs = plt.subplots(2, 3, figsize=(12, 8),
                        gridspec_kw={'width_ratios': [1, 2, 1],
                                     'height_ratios': [2, 1]})

x = np.linspace(0, 10, 100)

axs[0, 0].plot(x, np.sin(x))
axs[0, 0].set_title('Sine - how2matplotlib.com')

axs[0, 1].plot(x, np.cos(x))
axs[0, 1].set_title('Cosine - how2matplotlib.com')

axs[0, 2].plot(x, np.tan(x))
axs[0, 2].set_title('Tangent - how2matplotlib.com')

axs[1, 0].plot(x, np.exp(x))
axs[1, 0].set_title('Exponential - how2matplotlib.com')

axs[1, 1].plot(x, np.log(x))
axs[1, 1].set_title('Logarithm - how2matplotlib.com')

axs[1, 2].plot(x, x**2)
axs[1, 2].set_title('Quadratic - how2matplotlib.com')

plt.tight_layout()
plt.show()
Output:
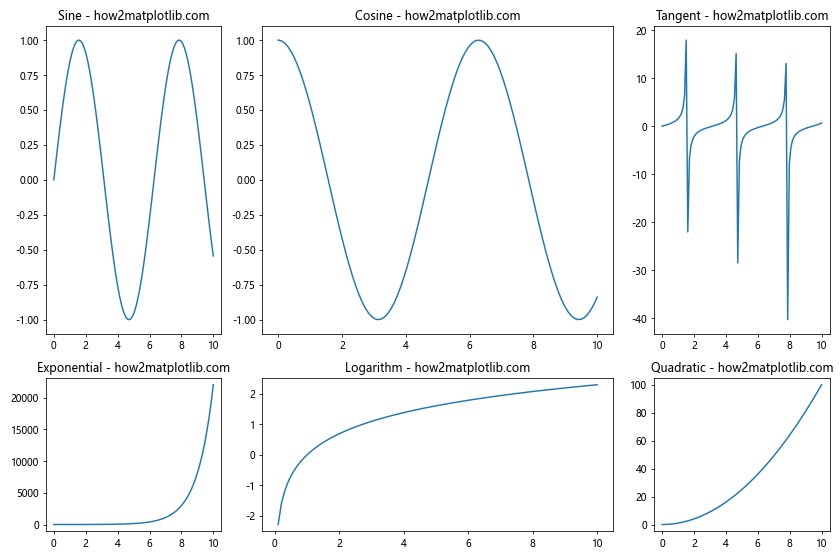
在这个例子中,我们创建了一个2×3的子图网格。width_ratios=[1, 2, 1]指定了列宽的比例为1:2:1,height_ratios=[2, 1]指定了行高的比例为2:1。这样,中间列的子图会比两侧的宽,上面一行的子图会比下面一行的高。
5. 嵌套子图
有时候,我们可能需要在一个子图内再创建子图,这就是嵌套子图。Matplotlib允许我们创建这种复杂的布局。
以下是一个嵌套子图的示例:
import matplotlib.pyplot as plt
import numpy as np

fig = plt.figure(figsize=(12, 8))

# 创建外层子图
gs_outer = fig.add_gridspec(2, 2)

ax1 = fig.add_subplot(gs_outer[0, 0])
ax2 = fig.add_subplot(gs_outer[0, 1])
ax3 = fig.add_subplot(gs_outer[1, 0])

# 在右下角创建嵌套子图
gs_inner = gs_outer[1, 1].subgridspec(2, 2)
ax4 = fig.add_subplot(gs_inner[0, 0])
ax5 = fig.add_subplot(gs_inner[0, 1])
ax6 = fig.add_subplot(gs_inner[1, 0])
ax7 = fig.add_subplot(gs_inner[1, 1])

x = np.linspace(0, 10, 100)

ax1.plot(x, np.sin(x))
ax1.set_title('Sine - how2matplotlib.com')

ax2.plot(x, np.cos(x))
ax2.set_title('Cosine - how2matplotlib.com')

ax3.plot(x, np.tan(x))
ax3.set_title('Tangent - how2matplotlib.com')

ax4.plot(x, np.exp(x))
ax4.set_title('Exp - how2matplotlib.com')

ax5.plot(x, np.log(x))
ax5.set_title('Log - how2matplotlib.com')

ax6.plot(x, x**2)
ax6.set_title('x^2 - how2matplotlib.com')

ax7.plot(x, x**3)
ax7.set_title('x^3 - how2matplotlib.com')

plt.tight_layout()
plt.show()
Output:
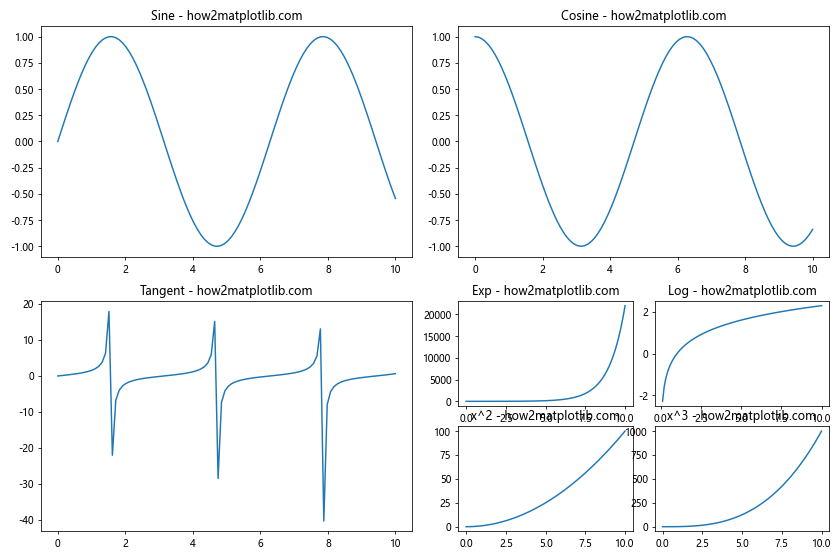
在这个例子中,我们首先创建了一个2×2的外层网格,然后在右下角的子图位置创建了一个2×2的内层网格。这样,我们就在一个图形中创建了7个不同大小的子图。
6. 使用subplot2grid
subplot2grid函数提供了另一种创建不规则子图布局的方法。它允许我们指定子图的起始位置和跨度。
以下是使用subplot2grid的示例:
import matplotlib.pyplot as plt
import numpy as np

fig = plt.figure(figsize=(12, 8))

ax1 = plt.subplot2grid((3, 3), (0, 0), colspan=3)
ax2 = plt.subplot2grid((3, 3), (1, 0), colspan=2)
ax3 = plt.subplot2grid((3, 3), (1, 2), rowspan=2)
ax4 = plt.subplot2grid((3, 3), (2, 0))
ax5 = plt.subplot2grid((3, 3), (2, 1))

x = np.linspace(0, 10, 100)

ax1.plot(x, np.sin(x))
ax1.set_title('Sine Wave - how2matplotlib.com')

ax2.plot(x, np.cos(x))
ax2.set_title('Cosine Wave - how2matplotlib.com')

ax3.plot(x, np.exp(x))
ax3.set_title('Exponential - how2matplotlib.com')

ax4.plot(x, np.log(x))
ax4.set_title('Logarithm - how2matplotlib.com')

ax5.plot(x, x**2)
ax5.set_title('Quadratic - how2matplotlib.com')

plt.tight_layout()
plt.show()
Output:
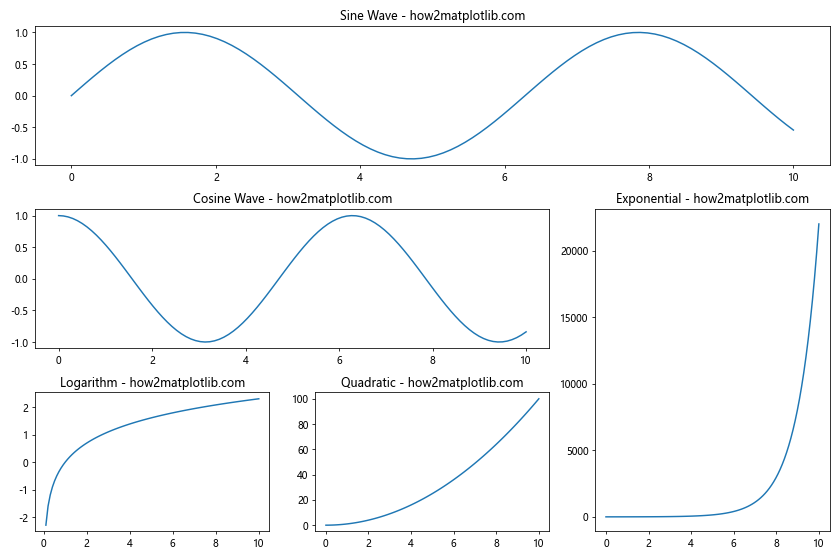
在这个例子中,subplot2grid的第一个参数(3, 3)指定了整个网格的大小,第二个参数如(0, 0)指定了子图的起始位置。colspan和rowspan参数用于指定子图跨越的列数和行数。
7. 使用constrained_layout
tight_layout()函数通常可以很好地处理子图之间的间距,但有时可能会出现问题。在这种情况下,我们可以使用constrained_layout,它提供了更智能的自动布局调整。
以下是使用constrained_layout的示例:
import matplotlib.pyplot as plt
import numpy as np

fig, axs = plt.subplots(2, 2, figsize=(12, 8), constrained_layout=True)

x = np.linspace(0, 10, 100)

axs[0, 0].plot(x, np.sin(x))
axs[0, 0].set_title('Sine Wave - how2matplotlib.com')

axs[0, 1].plot(x, np.cos(x))
axs[0, 1].set_title('Cosine Wave - how2matplotlib.com')

axs[1, 0].plot(x, np.exp(x))
axs[1, 0].set_title('Exponential - how2matplotlib.com')

axs[1, 1].plot(x, np.log(x))
axs[1, 1].set_title('Logarithm - how2matplotlib.com')

plt.show()
Output:
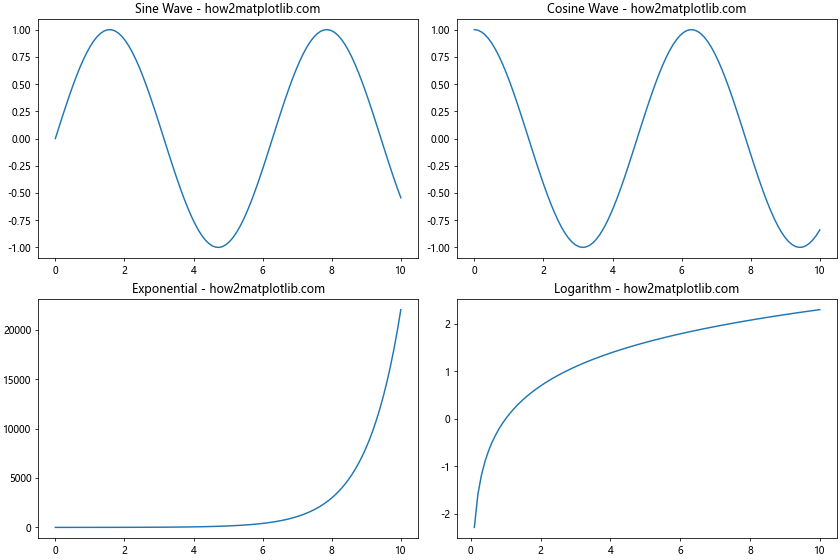
在这个例子中,我们在创建Figure时设置了constrained_layout=True。这会自动调整子图的大小和位置,以确保标题和标签不会重叠。
8. 使用GridSpec和SubplotSpec
对于更复杂的布局,我们可以结合使用GridSpec和SubplotSpec。这允许我们创建非常灵活的子图布局。
以下是一个示例:
import matplotlib.pyplot as plt
import matplotlib.gridspec as gridspec
import numpy as np

fig = plt.figure(figsize=(12, 8))
gs = gridspec.GridSpec(3, 3)

ax1 = fig.add_subplot(gs[0, :])
ax2 = fig.add_subplot(gs[1, :-1])
ax3 = fig.add_subplot(gs[1:, -1])
ax4 = fig.add_subplot(gs[-1, 0])
ax5 = fig.add_subplot(gs[-1, -2])

x = np.linspace(0, 10, 100)

ax1.plot(x, np.sin(x))
ax1.set_title('Sine Wave - how2matplotlib.com')

ax2.plot(x, np.cos(x))
ax2.set_title('Cosine Wave - how2matplotlib.com')

ax3.plot(x, np.exp(x))
ax3.set_title('Exponential - how2matplotlib.com')

ax4.plot(x, np.log(x))
ax4.set_title('Logarithm - how2matplotlib.com')

ax5.plot(x, x**2)
ax5.set_title('Quadratic - how2matplotlib.com')

plt.tight_layout()
plt.show()
Output:
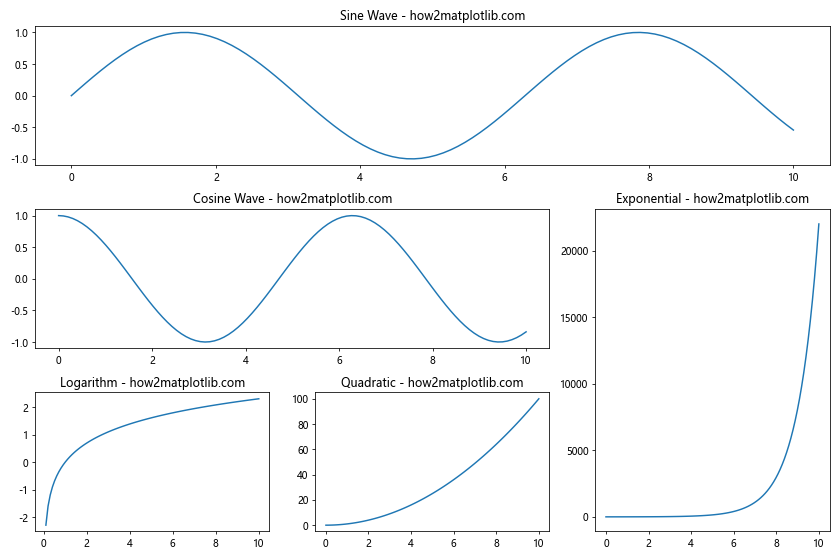
在这个例子中,我们使用GridSpec创建了一个3×3的网格,然后使用切片语法来定义每个子图占据的网格区域。这种方法允许我们创建非常复杂和灵活的布局。
9. 使用mosaic布局
从Matplotlib 3.3版本开始,引入了一个新的subplot_mosaic函数,它提供了一种更直观的方式来创建复杂的子图布局。
以下是使用subplot_mosaic的示例:
import matplotlib.pyplot as plt
import numpy as np

mosaic = """
ABC
DDE
"""

fig, axs = plt.subplot_mosaic(mosaic, figsize=(12, 8))

x = np.linspace(0, 10, 100)

axs['A'].plot(x, np.sin(x))
axs['A'].set_title('Sine Wave - how2matplotlib.com')

axs['B'].plot(x, np.cos(x))
axs['B'].set_title('Cosine Wave - how2matplotlib.com')

axs['C'].plot(x, np.tan(x))
axs['C'].set_title('Tangent Wave - how2matplotlib.com')

axs['D'].plot(x, np.exp(x))
axs['D'].set_title('Exponential - how2matplotlib.com')

axs['E'].plot(x, np.log(x))
axs['E'].set_title('Logarithm - how2matplotlib.com')

plt.tight_layout()
plt.show()
Output:
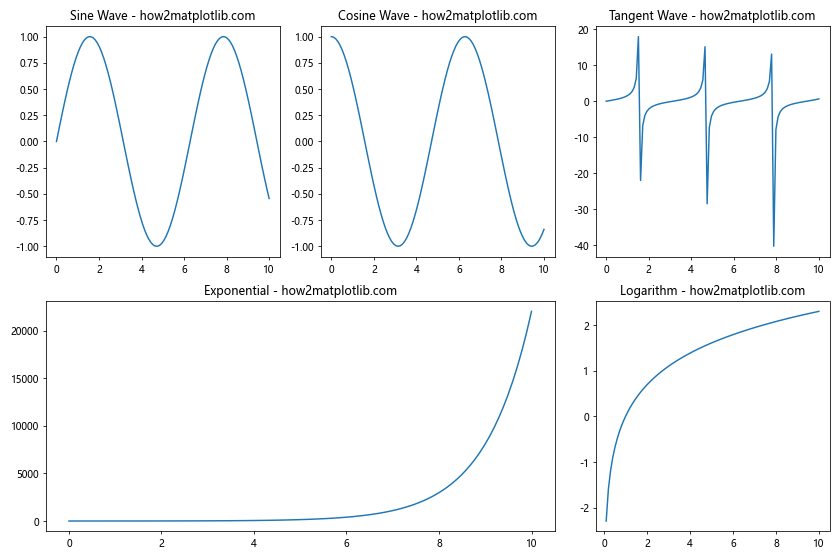
在这个例子中,我们使用一个字符串来定义子图的布局。每个字符代表一个子图,相同的字符表示同一个子图。这种方法非常直观,特别适合创建不规则的子图布局。
10. 动态调整子图大小
有时,我们可能需要在运行时动态调整子图的大小。Matplotlib提供了set_position方法来实现这一点。
以下是一个动态调整子图大小的示例:
import matplotlib.pyplot as plt
import numpy as np

fig, (ax1, ax2) = plt.subplots(1, 2, figsize=(12, 6))

x = np.linspace(0, 10, 100)

ax1.plot(x, np.sin(x))
ax1.set_title('Sine Wave - how2matplotlib.com')

ax2.plot(x, np.cos(x))
ax2.set_title('Cosine Wave - how2matplotlib.com')

# 获取当前位置
pos1 = ax1.get_position()
pos2 = ax2.get_position()

# 调整子图大小
ax1.set_position([pos1.x0, pos1.y0, pos1.width * 1.5, pos1.height])
ax2.set_position([pos2.x0 + pos2.width * 0.5, pos2.y0, pos2.width * 0.5, pos2.height])

plt.show()
Output:
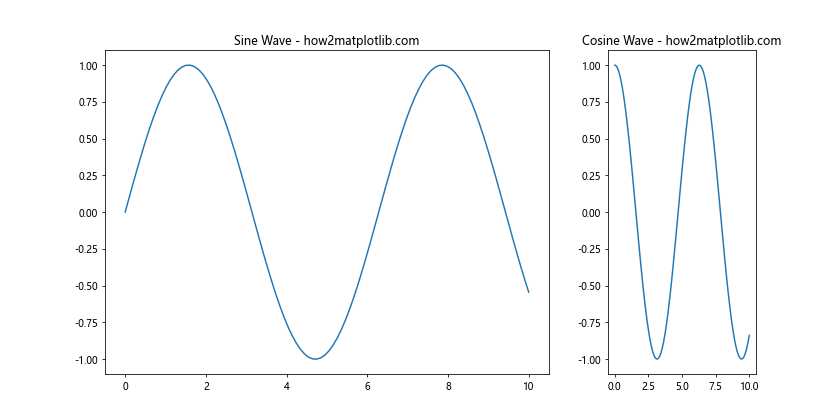
在这个例子中,我们首先创建了两个大小相等的子图。然后,我们使用get_position方法获取每个子图的当前位置,并使用set_position方法调整它们的大小和位置。我们将左侧的子图宽度增加了50%,并相应地调整了右侧子图的位置和宽度。
11. 使用axes_grid1工具包
Matplotlib的axes_grid1工具包提供了更多高级的布局选项,特别是当我们需要创建具有共享轴或颜色条的复杂布局时。
以下是使用axes_grid1的示例:
import matplotlib.pyplot as plt
from mpl_toolkits.axes_grid1 import ImageGrid
import numpy as np

fig = plt.figure(figsize=(12, 8))

grid = ImageGrid(fig, 111,  # 类似于subplot(111)
                 nrows_ncols=(2, 2),
                 axes_pad=0.5,
                 share_all=True,
                 cbar_location="right",
                 cbar_mode="single",
                 cbar_size="7%",
                 cbar_pad=0.15,
                 )

x = np.linspace(0, 10, 100)
y = np.linspace(0, 10, 100)
X, Y = np.meshgrid(x, y)

Z1 = np.sin(X) * np.cos(Y)
Z2 = np.exp(-(X**2 + Y**2) / 10)
Z3 = np.log(X**2 + Y**2 + 1)
Z4 = X**2 - Y**2

for ax, z in zip(grid, [Z1, Z2, Z3, Z4]):
    im = ax.imshow(z, origin="lower", extent=(0, 10, 0, 10))
    ax.set_title(f'Plot - how2matplotlib.com')

grid.cbar_axes[0].colorbar(im)

plt.show()
Output:
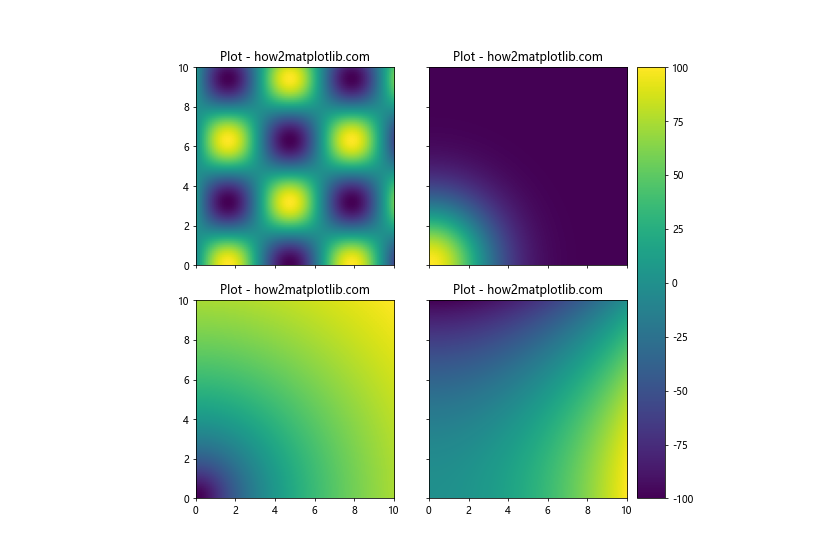
在这个例子中,我们使用ImageGrid创建了一个2×2的网格,每个子图共享相同的轴范围,并且在右侧有一个共享的颜色条。这种布局特别适合展示相关的图像或热图数据。
12. 创建不对称的子图布局
有时,我们可能需要创建不对称的子图布局,例如一个大的主图和几个小的辅助图。以下是一个示例:
import matplotlib.pyplot as plt
import numpy as np

fig = plt.figure(figsize=(12, 8))

# 创建主图
ax_main = plt.subplot2grid((3, 3), (0, 0), colspan=2, rowspan=2)

# 创建三个小图
ax1 = plt.subplot2grid((3, 3), (0, 2))
ax2 = plt.subplot2grid((3, 3), (1, 2))
ax3 = plt.subplot2grid((3, 3), (2, 0), colspan=3)

x = np.linspace(0, 10, 100)

ax_main.plot(x, np.sin(x))
ax_main.set_title('Main Plot: Sine Wave - how2matplotlib.com')

ax1.plot(x, np.cos(x))
ax1.set_title('Cosine - how2matplotlib.com')

ax2.plot(x, np.exp(x))
ax2.set_title('Exponential - how2matplotlib.com')

ax3.plot(x, np.log(x))
ax3.set_title('Logarithm - how2matplotlib.com')

plt.tight_layout()
plt.show()
Output:
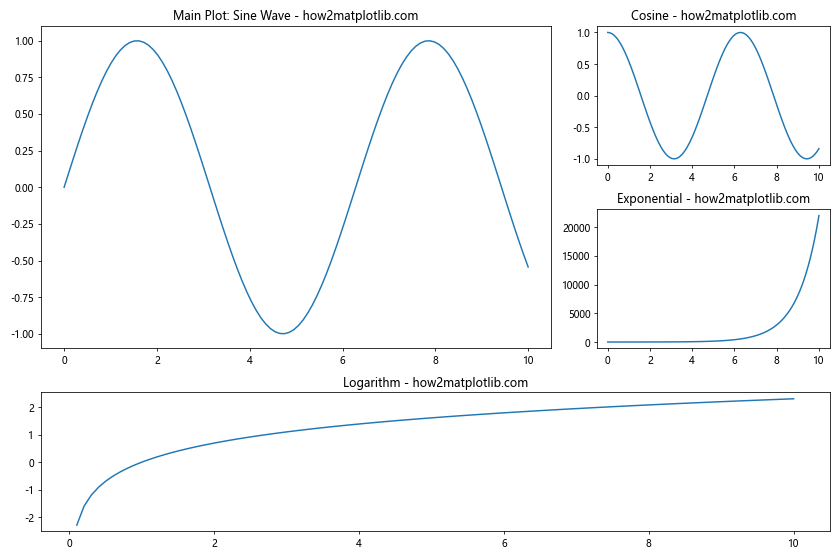
在这个例子中,我们使用subplot2grid创建了一个大的主图和三个小的辅助图。主图占据了左上角的2×2网格,而三个小图分别占据了右上、右中和底部的位置。
13. 使用GridSpec和SubplotSpec创建复杂布局
对于更复杂的布局需求,我们可以结合使用GridSpec和SubplotSpec来实现精细的控制。
以下是一个示例:
import matplotlib.pyplot as plt
import matplotlib.gridspec as gridspec
import numpy as np

fig = plt.figure(figsize=(12, 8))

# 创建主网格
gs_main = gridspec.GridSpec(2, 2, figure=fig)

# 左上角子图
ax1 = fig.add_subplot(gs_main[0, 0])

# 右上角子网格
gs_right = gridspec.GridSpecFromSubplotSpec(2, 1, subplot_spec=gs_main[0, 1])
ax2 = fig.add_subplot(gs_right[0])
ax3 = fig.add_subplot(gs_right[1])

# 左下角子网格
gs_bottom_left = gridspec.GridSpecFromSubplotSpec(1, 2, subplot_spec=gs_main[1, 0])
ax4 = fig.add_subplot(gs_bottom_left[0, 0])
ax5 = fig.add_subplot(gs_bottom_left[0, 1])

# 右下角子图
ax6 = fig.add_subplot(gs_main[1, 1])

x = np.linspace(0, 10, 100)

ax1.plot(x, np.sin(x))
ax1.set_title('Sine - how2matplotlib.com')

ax2.plot(x, np.cos(x))
ax2.set_title('Cosine - how2matplotlib.com')

ax3.plot(x, np.tan(x))
ax3.set_title('Tangent - how2matplotlib.com')

ax4.plot(x, np.exp(x))
ax4.set_title('Exponential - how2matplotlib.com')

ax5.plot(x, np.log(x))
ax5.set_title('Logarithm - how2matplotlib.com')

ax6.plot(x, x**2)
ax6.set_title('Quadratic - how2matplotlib.com')

plt.tight_layout()
plt.show()
Output:
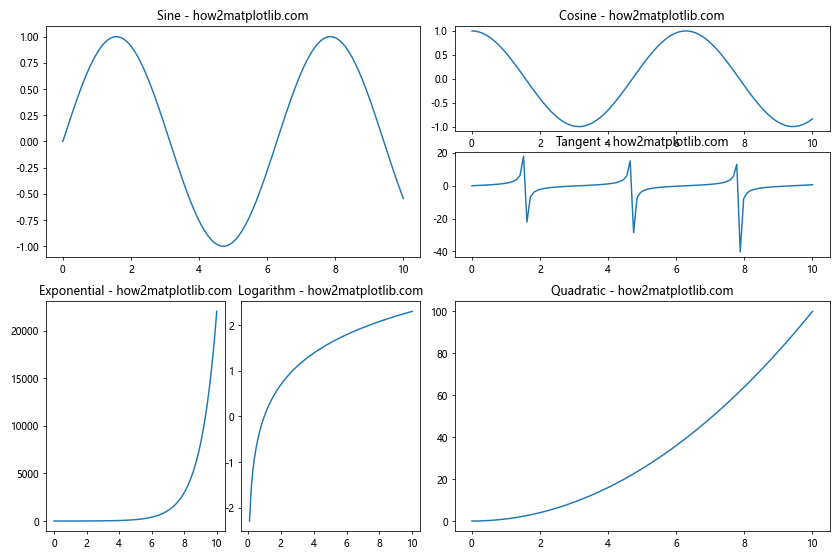
在这个例子中,我们首先创建了一个2×2的主网格。然后,我们在右上角和左下角创建了子网格,从而实现了一个复杂的6子图布局。
14. 使用GridSpec的wspace和hspace参数
GridSpec允许我们通过wspace和hspace参数来控制子图之间的间距。这在创建紧凑的多子图布局时特别有用。
以下是一个示例:
import matplotlib.pyplot as plt
import matplotlib.gridspec as gridspec
import numpy as np

fig = plt.figure(figsize=(12, 8))

gs = gridspec.GridSpec(2, 2, wspace=0.4, hspace=0.3)

ax1 = fig.add_subplot(gs[0, 0])
ax2 = fig.add_subplot(gs[0, 1])
ax3 = fig.add_subplot(gs[1, 0])
ax4 = fig.add_subplot(gs[1, 1])

x = np.linspace(0, 10, 100)

ax1.plot(x, np.sin(x))
ax1.set_title('Sine Wave - how2matplotlib.com')

ax2.plot(x, np.cos(x))
ax2.set_title('Cosine Wave - how2matplotlib.com')

ax3.plot(x, np.exp(x))
ax3.set_title('Exponential - how2matplotlib.com')

ax4.plot(x, np.log(x))
ax4.set_title('Logarithm - how2matplotlib.com')

plt.show()
Output:
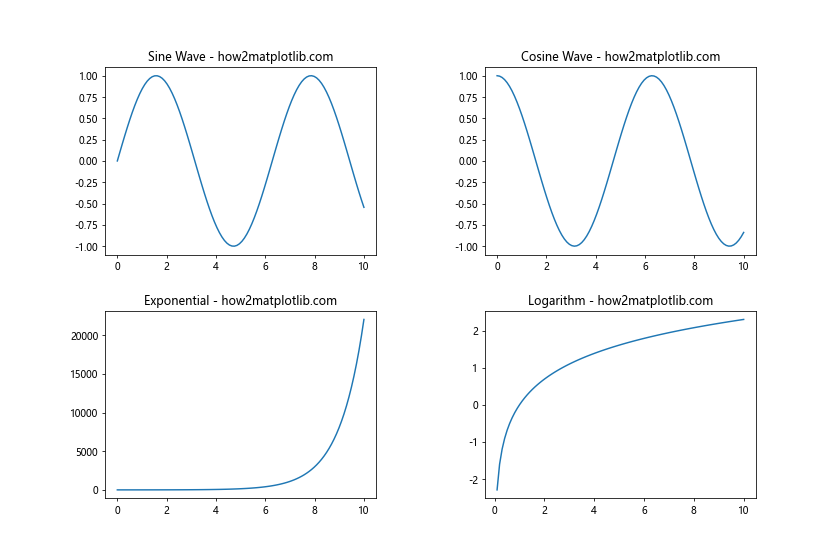
在这个例子中,wspace=0.4设置了列之间的间距为轴宽度的40%,hspace=0.3设置了行之间的间距为轴高度的30%。通过调整这些值,我们可以精确控制子图之间的间距。
15. 创建具有共享轴的子图
在某些情况下,我们可能希望创建具有共享x轴或y轴的子图。Matplotlib提供了简单的方法来实现这一点。
以下是一个示例:
import matplotlib.pyplot as plt
import numpy as np

fig, (ax1, ax2, ax3) = plt.subplots(3, 1, figsize=(12, 8), sharex=True)

x = np.linspace(0, 10, 100)

ax1.plot(x, np.sin(x))
ax1.set_title('Sine Wave - how2matplotlib.com')

ax2.plot(x, np.cos(x))
ax2.set_title('Cosine Wave - how2matplotlib.com')

ax3.plot(x, np.tan(x))
ax3.set_title('Tangent Wave - how2matplotlib.com')

plt.tight_layout()
plt.show()
Output:
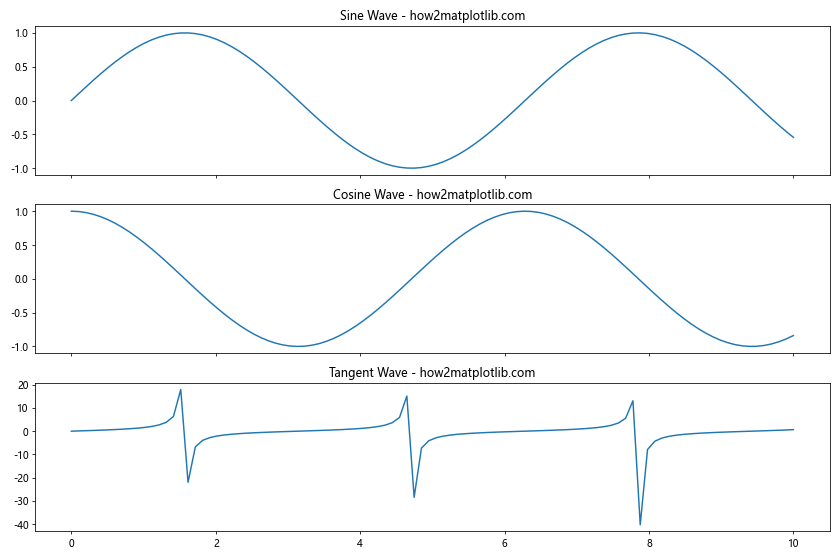
在这个例子中,我们创建了三个垂直排列的子图,并设置sharex=True。这意味着这三个子图共享相同的x轴,只有底部的子图会显示x轴标签。
结论
在本文中,我们详细探讨了如何在Matplotlib中创建不同大小的子图。我们介绍了多种方法,包括使用gridspec、subplot2grid、add_gridspec等,并展示了如何创建复杂的布局、嵌套子图、共享轴的子图等。这些技术为数据可视化提供了极大的灵活性,使我们能够创建出既美观又信息丰富的图表。
掌握这些技巧后,你将能够根据具体需求创建各种复杂的图表布局。无论是科学研究、数据分析还是商业报告,这些技能都将帮助你更有效地展示和传达数据信息。记住,创建好的可视化不仅仅是技术问题,还需要考虑数据的特性和你想要传达的信息。因此,在选择布局时,始终要考虑你的目标受众和你想要强调的关键信息。
最后,Matplotlib是一个非常强大和灵活的库,本文所介绍的只是其功能的一小部分。随着你对Matplotlib的深入学习和使用,你会发现更多有趣和有用的功能。希望这篇文章能为你的数据可视化之旅提供有价值的指导和启发。
 极客教程
极客教程