Matplotlib中如何创建分组箱线图:全面指南
参考:How to Create Boxplots by Group in Matplotlib
箱线图是一种强大的数据可视化工具,用于展示数据的分布情况和异常值。在数据分析中,我们经常需要比较不同组别的数据分布,这时候分组箱线图就显得尤为重要。本文将详细介绍如何使用Matplotlib创建分组箱线图,包括基本概念、数据准备、绘图技巧以及高级定制等方面。
1. 箱线图的基本概念
在深入探讨分组箱线图之前,我们先来了解一下箱线图的基本概念。箱线图,也称为盒须图,是一种用作显示一组数据分散情况资料的统计图。它能显示出一组数据的最大值、最小值、中位数、下四分位数及上四分位数。
箱线图的主要组成部分包括:
– 箱体:表示数据的中间50%,上边缘为上四分位数(Q3),下边缘为下四分位数(Q1)
– 中位线:表示数据的中位数
– 须:延伸至最小和最大值(不包括异常值)
– 异常值:通常以点的形式表示,超出四分位距(IQR)1.5倍的数据点
让我们通过一个简单的例子来创建一个基本的箱线图:
import matplotlib.pyplot as plt
import numpy as np

# 生成示例数据
np.random.seed(42)
data = np.random.randn(100)

# 创建箱线图
plt.figure(figsize=(8, 6))
plt.boxplot(data)
plt.title('Basic Boxplot - how2matplotlib.com')
plt.ylabel('Values')
plt.show()
Output:
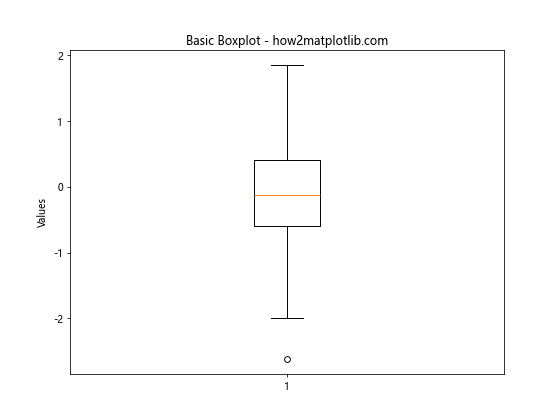
在这个例子中,我们使用NumPy生成了100个随机数,然后使用plt.boxplot()函数创建了一个基本的箱线图。figsize参数用于设置图形的大小,title和ylabel用于添加标题和Y轴标签。
2. 数据准备
创建分组箱线图的第一步是准备合适的数据。通常,我们需要有多个组别的数据,每个组别包含多个数据点。让我们看一个例子,如何准备适合分组箱线图的数据:
import numpy as np
import pandas as pd

# 生成示例数据
np.random.seed(42)
group_a = np.random.normal(100, 10, 200)
group_b = np.random.normal(90, 20, 200)
group_c = np.random.normal(110, 15, 200)

# 创建DataFrame
df = pd.DataFrame({
    'Group A': group_a,
    'Group B': group_b,
    'Group C': group_c
})

print(df.head())
print("Data prepared for grouped boxplot - how2matplotlib.com")
Output:
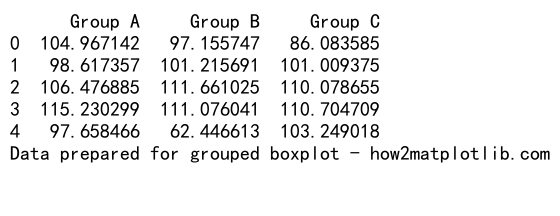
在这个例子中,我们使用NumPy生成了三组正态分布的数据,然后将它们组合成一个pandas DataFrame。这种格式的数据非常适合创建分组箱线图。
3. 创建基本的分组箱线图
有了准备好的数据,我们就可以开始创建分组箱线图了。Matplotlib提供了简单的方法来创建这种图表:
import matplotlib.pyplot as plt
import numpy as np
import pandas as pd

# 准备数据
np.random.seed(42)
df = pd.DataFrame({
    'Group A': np.random.normal(100, 10, 200),
    'Group B': np.random.normal(90, 20, 200),
    'Group C': np.random.normal(110, 15, 200)
})

# 创建分组箱线图
plt.figure(figsize=(10, 6))
df.boxplot()
plt.title('Grouped Boxplot - how2matplotlib.com')
plt.ylabel('Values')
plt.show()
Output:
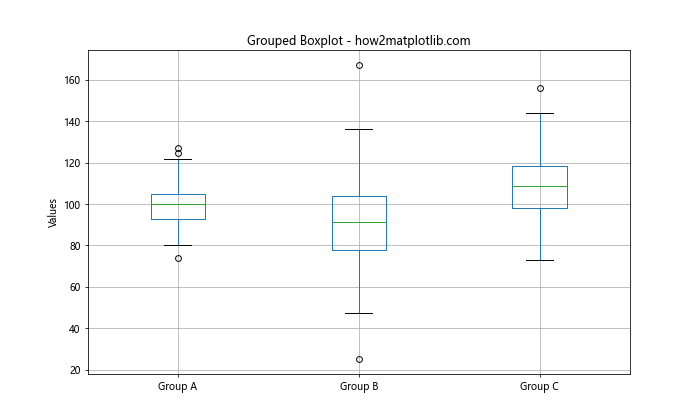
在这个例子中,我们直接使用pandas DataFrame的boxplot()方法来创建分组箱线图。这个方法会自动为DataFrame中的每一列创建一个箱线图,并将它们并排放置。
4. 自定义箱线图样式
Matplotlib提供了多种方式来自定义箱线图的样式。我们可以改变箱体的颜色、线条宽度、异常值的标记等。下面是一个自定义样式的例子:
import matplotlib.pyplot as plt
import numpy as np
import pandas as pd

# 准备数据
np.random.seed(42)
df = pd.DataFrame({
    'Group A': np.random.normal(100, 10, 200),
    'Group B': np.random.normal(90, 20, 200),
    'Group C': np.random.normal(110, 15, 200)
})

# 创建自定义样式的分组箱线图
plt.figure(figsize=(10, 6))
df.boxplot(color={'boxes': 'red', 'whiskers': 'orange', 'medians': 'green', 'caps': 'purple'},
           boxprops={'facecolor': 'pink', 'edgecolor': 'red', 'alpha': 0.5},
           flierprops={'marker': 'o', 'markerfacecolor': 'blue', 'markersize': 8},
           medianprops={'linewidth': 2})
plt.title('Customized Grouped Boxplot - how2matplotlib.com')
plt.ylabel('Values')
plt.show()
在这个例子中,我们使用了多个参数来自定义箱线图的样式:
– color参数用于设置不同部分的颜色
– boxprops用于设置箱体的属性,包括填充颜色、边框颜色和透明度
– flierprops用于设置异常值点的属性
– medianprops用于设置中位线的属性
5. 添加数据点
有时候,我们可能想在箱线图上显示原始数据点,以便更好地理解数据分布。Matplotlib允许我们在箱线图上叠加数据点:
import matplotlib.pyplot as plt
import numpy as np
import pandas as pd

# 准备数据
np.random.seed(42)
df = pd.DataFrame({
    'Group A': np.random.normal(100, 10, 50),
    'Group B': np.random.normal(90, 20, 50),
    'Group C': np.random.normal(110, 15, 50)
})

# 创建带数据点的分组箱线图
plt.figure(figsize=(12, 6))
bp = df.boxplot(return_type='dict')
for i, column in enumerate(df.columns):
    y = df[column]
    x = np.random.normal(i + 1, 0.04, len(y))
    plt.scatter(x, y, alpha=0.4)

plt.title('Grouped Boxplot with Data Points - how2matplotlib.com')
plt.ylabel('Values')
plt.show()
Output:
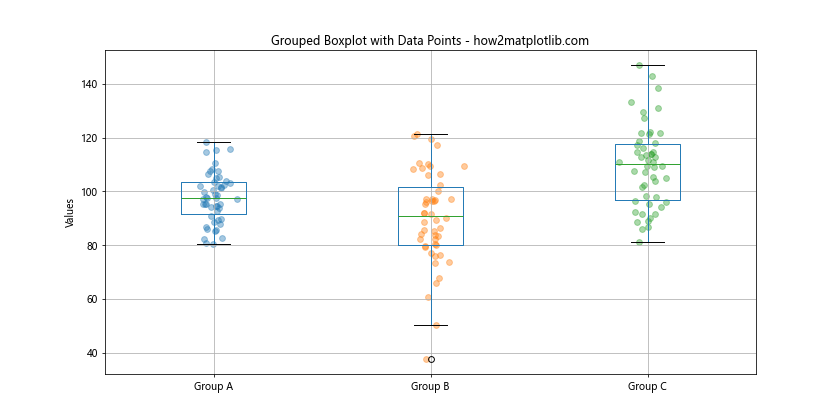
在这个例子中,我们首先创建了一个普通的箱线图,然后使用plt.scatter()函数在每个箱线图上添加了对应的数据点。我们稍微调整了数据点的x坐标,使它们在箱线图周围随机分布,以避免重叠。
6. 水平方向的分组箱线图
默认情况下,Matplotlib创建的箱线图是垂直方向的。但有时候,水平方向的箱线图可能更适合某些数据或布局。我们可以轻松地创建水平方向的分组箱线图:
import matplotlib.pyplot as plt
import numpy as np
import pandas as pd

# 准备数据
np.random.seed(42)
df = pd.DataFrame({
    'Group A': np.random.normal(100, 10, 200),
    'Group B': np.random.normal(90, 20, 200),
    'Group C': np.random.normal(110, 15, 200)
})

# 创建水平方向的分组箱线图
plt.figure(figsize=(10, 6))
df.boxplot(vert=False)
plt.title('Horizontal Grouped Boxplot - how2matplotlib.com')
plt.xlabel('Values')
plt.show()
Output:
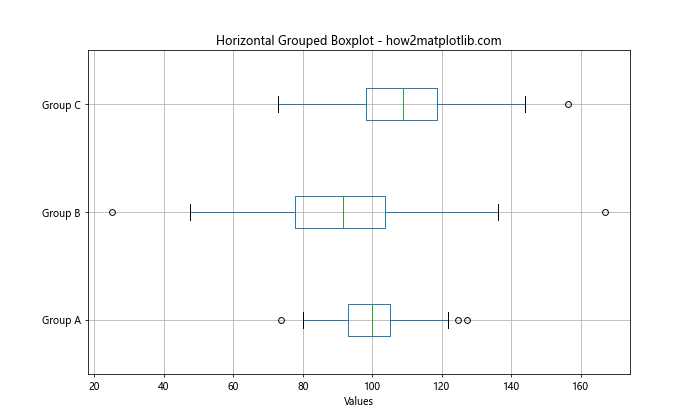
在这个例子中,我们只需要在boxplot()函数中添加vert=False参数,就可以创建水平方向的箱线图。注意,这时我们需要使用xlabel而不是ylabel来标注数值轴。
7. 添加统计信息
箱线图本身就包含了很多统计信息,但有时我们可能想要在图上显示更多的统计数据,比如均值。我们可以使用Matplotlib的注释功能来实现这一点:
import matplotlib.pyplot as plt
import numpy as np
import pandas as pd

# 准备数据
np.random.seed(42)
df = pd.DataFrame({
    'Group A': np.random.normal(100, 10, 200),
    'Group B': np.random.normal(90, 20, 200),
    'Group C': np.random.normal(110, 15, 200)
})

# 创建带均值标注的分组箱线图
plt.figure(figsize=(10, 6))
bp = df.boxplot()
for i, column in enumerate(df.columns):
    mean = df[column].mean()
    plt.text(i+1, mean, f'Mean: {mean:.2f}', ha='center', va='bottom')
    plt.plot([i+0.8, i+1.2], [mean, mean], color='red', linestyle='--')

plt.title('Grouped Boxplot with Mean - how2matplotlib.com')
plt.ylabel('Values')
plt.show()
Output:
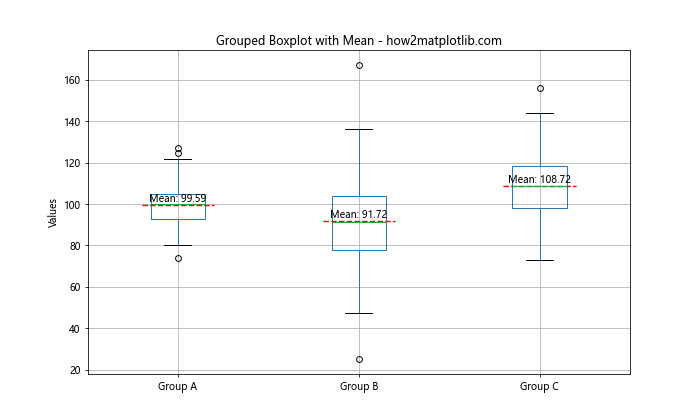
在这个例子中,我们首先创建了一个普通的箱线图。然后,我们遍历每一列数据,计算均值,并使用plt.text()函数在图上添加文本注释。我们还使用plt.plot()函数在每个箱线图上画了一条表示均值的虚线。
8. 使用Seaborn创建分组箱线图
虽然Matplotlib提供了创建分组箱线图的基本功能,但有时我们可能想要更美观或更易于使用的接口。Seaborn是基于Matplotlib的统计数据可视化库,它提供了更高级的接口来创建各种统计图表,包括分组箱线图:
import matplotlib.pyplot as plt
import seaborn as sns
import numpy as np
import pandas as pd

# 准备数据
np.random.seed(42)
df = pd.DataFrame({
    'value': np.concatenate([
        np.random.normal(100, 10, 200),
        np.random.normal(90, 20, 200),
        np.random.normal(110, 15, 200)
    ]),
    'group': np.repeat(['A', 'B', 'C'], 200)
})

# 使用Seaborn创建分组箱线图
plt.figure(figsize=(10, 6))
sns.boxplot(x='group', y='value', data=df)
plt.title('Seaborn Grouped Boxplot - how2matplotlib.com')
plt.show()
Output:
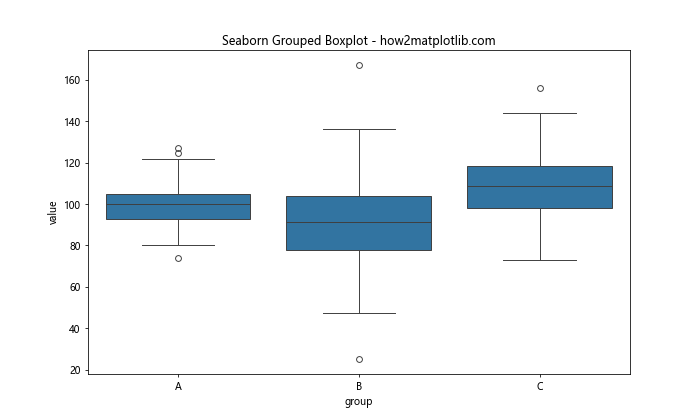
在这个例子中,我们首先重新组织了数据格式,将所有的值放在一列中,并添加了一个表示组别的列。然后我们使用Seaborn的boxplot()函数来创建分组箱线图。Seaborn的接口更加直观,并且默认提供了更美观的样式。
9. 添加小提琴图
小提琴图是箱线图的一种变体,它不仅显示了数据的摘要统计信息,还显示了数据的概率密度。我们可以将小提琴图与箱线图结合,以提供更丰富的数据分布信息:
import matplotlib.pyplot as plt
import seaborn as sns
import numpy as np
import pandas as pd

# 准备数据
np.random.seed(42)
df = pd.DataFrame({
    'value': np.concatenate([
        np.random.normal(100, 10, 200),
        np.random.normal(90, 20, 200),
        np.random.normal(110, 15, 200)
    ]),
    'group': np.repeat(['A', 'B', 'C'], 200)
})

# 创建箱线图和小提琴图的组合
plt.figure(figsize=(12, 6))
sns.violinplot(x='group', y='value', data=df, inner='box')
plt.title('Boxplot with Violin Plot - how2matplotlib.com')
plt.show()
Output:
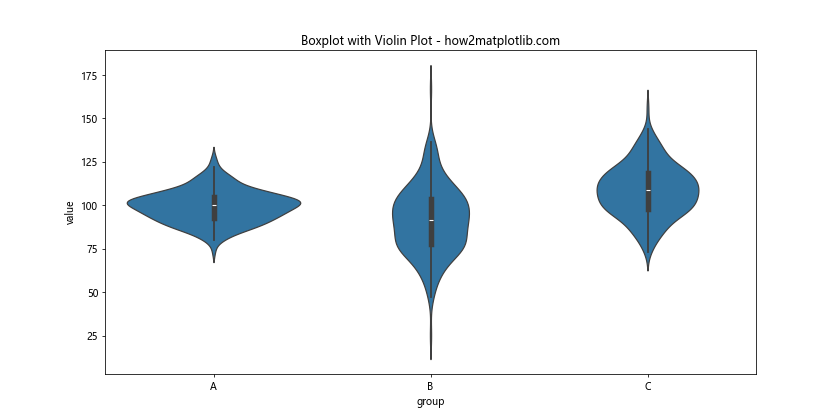
在这个例子中,我们使用Seaborn的violinplot()函数创建了小提琴图,并通过inner='box'参数在小提琴图内部添加了箱线图。这种组合图能够同时显示数据的分布形状和关键统计信息。
10. 多变量分组箱线图
有时,我们可能需要根据多个变量来分组创建箱线图。例如,我们可能想要比较不同组别在不同条件下的表现。Matplotlib和Seaborn都提供了创建这种复杂图表的方法:
import matplotlib.pyplot as plt
import seaborn as sns
import numpy as np
import pandas as pd

# 准备数据
np.random.seed(42)
df = pd.DataFrame({
    'value': np.concatenate([
        np.random.normal(100, 10, 200),
        np.random.normal(90, 20, 200),
        np.random.normal(110, 15, 200),
        np.random.normal(95, 12, 200),
        np.random.normal(105, 18, 200),
        np.random.normal(100, 15, 200)
    ]),
    'group': np.repeat(['A', 'B', 'C'], 400),
    'condition': np.tile(np.repeat(['X', 'Y'], 200),3)
})

# 创建多变量分组箱线图
plt.figure(figsize=(12, 6))
sns.boxplot(x='group', y='value', hue='condition', data=df)
plt.title('Multi-variable Grouped Boxplot - how2matplotlib.com')
plt.show()
Output:
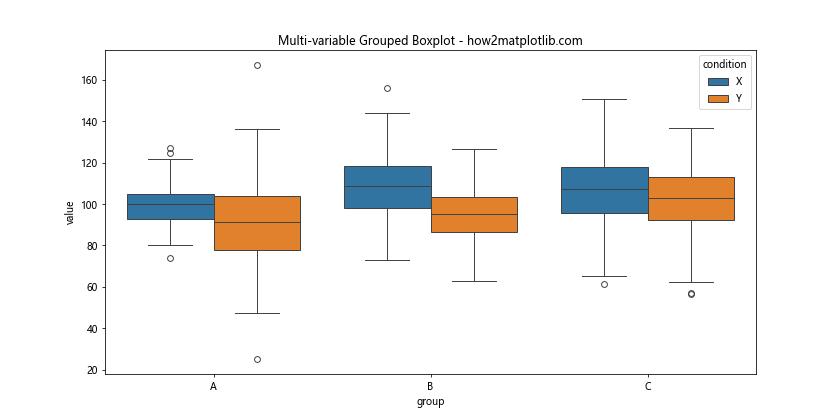
在这个例子中,我们创建了一个包含两个分组变量的数据集:’group’和’condition’。然后我们使用Seaborn的boxplot()函数创建了一个多变量分组箱线图,其中’group’决定了箱线图的x轴位置,而’condition’则通过不同的颜色来区分。
11. 添加统计检验结果
在比较不同组别的数据时,我们可能想要知道这些差异是否具有统计学意义。我们可以在箱线图上添加统计检验的结果,例如t检验的p值:
import matplotlib.pyplot as plt
import seaborn as sns
import numpy as np
import pandas as pd
from scipy import stats

# 准备数据
np.random.seed(42)
group_a = np.random.normal(100, 10, 200)
group_b = np.random.normal(90, 20, 200)
group_c = np.random.normal(110, 15, 200)

df = pd.DataFrame({
    'Group A': group_a,
    'Group B': group_b,
    'Group C': group_c
})

# 创建箱线图
plt.figure(figsize=(10, 6))
df.boxplot()

# 添加统计检验结果
def add_stat_annotation(x1, x2, data1, data2, h):
    t_stat, p_value = stats.ttest_ind(data1, data2)
    plt.plot([x1, x1, x2, x2], [h, h+5, h+5, h], lw=1.5, c='black')
    plt.text((x1+x2)*.5, h+5, f'p={p_value:.3f}', ha='center', va='bottom')

add_stat_annotation(1, 2, group_a, group_b, 140)
add_stat_annotation(1, 3, group_a, group_c, 150)
add_stat_annotation(2, 3, group_b, group_c, 160)

plt.title('Grouped Boxplot with Statistical Annotations - how2matplotlib.com')
plt.ylabel('Values')
plt.ylim(40, 170)
plt.show()
Output:
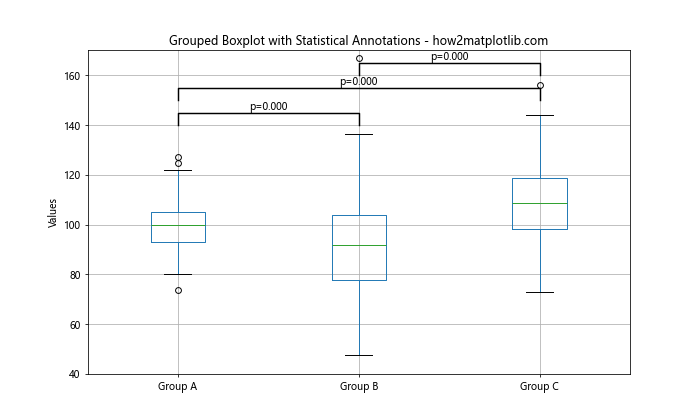
在这个例子中,我们定义了一个add_stat_annotation()函数来添加统计注释。这个函数执行t检验,并在图上画线和添加p值。我们对每对组别都进行了比较,并在图上显示了结果。
12. 创建嵌套的箱线图
有时,我们可能需要展示更复杂的数据结构,例如嵌套的分组。Matplotlib允许我们创建嵌套的箱线图来展示这种数据:
import matplotlib.pyplot as plt
import numpy as np

# 准备数据
np.random.seed(42)
data = [np.random.normal(100, 10, 200),
        np.random.normal(90, 20, 200),
        np.random.normal(110, 15, 200),
        np.random.normal(95, 12, 200),
        np.random.normal(105, 18, 200),
        np.random.normal(100, 15, 200)]

# 创建嵌套的箱线图
fig, ax = plt.subplots(figsize=(12, 6))
bplot = ax.boxplot(data, positions=[1, 2, 3, 5, 6, 7], widths=0.6, patch_artist=True)

# 自定义颜色
colors = ['pink', 'lightblue', 'lightgreen']
for patch, color in zip(bplot['boxes'], colors*2):
    patch.set_facecolor(color)

# 添加标签
ax.set_xticklabels(['A', 'B', 'C', 'A', 'B', 'C'])
ax.set_xticks([2, 6])
ax.set_xticklabels(['Group 1', 'Group 2'])

plt.title('Nested Grouped Boxplot - how2matplotlib.com')
plt.ylabel('Values')
plt.show()
Output:
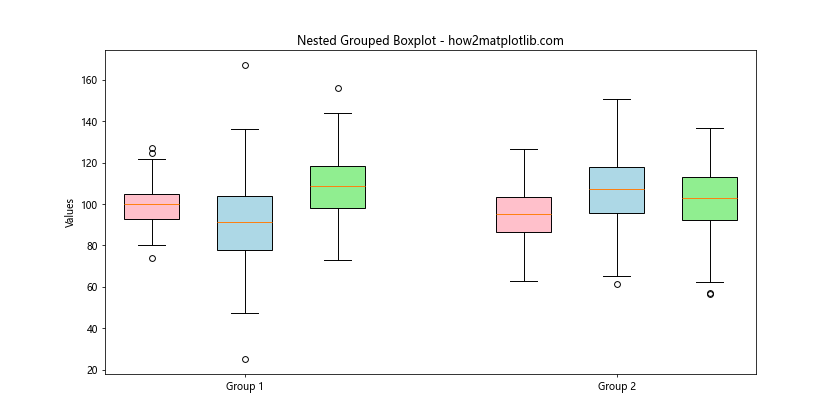
在这个例子中,我们创建了两个主要组别,每个主要组别内又包含三个子组别。我们使用positions参数来控制箱线图的位置,从而创建嵌套的效果。我们还使用了不同的颜色来区分子组别,并自定义了x轴的标签。
13. 添加抖动点
为了更好地展示数据的分布,特别是当数据点较少时,我们可以在箱线图上添加抖动点:
import matplotlib.pyplot as plt
import seaborn as sns
import numpy as np
import pandas as pd

# 准备数据
np.random.seed(42)
df = pd.DataFrame({
    'value': np.concatenate([
        np.random.normal(100, 10, 30),
        np.random.normal(90, 20, 30),
        np.random.normal(110, 15, 30)
    ]),
    'group': np.repeat(['A', 'B', 'C'], 30)
})

# 创建带抖动点的箱线图
plt.figure(figsize=(10, 6))
sns.boxplot(x='group', y='value', data=df)
sns.stripplot(x='group', y='value', data=df, color='black', alpha=0.5)

plt.title('Boxplot with Jittered Points - how2matplotlib.com')
plt.ylabel('Values')
plt.show()
Output:
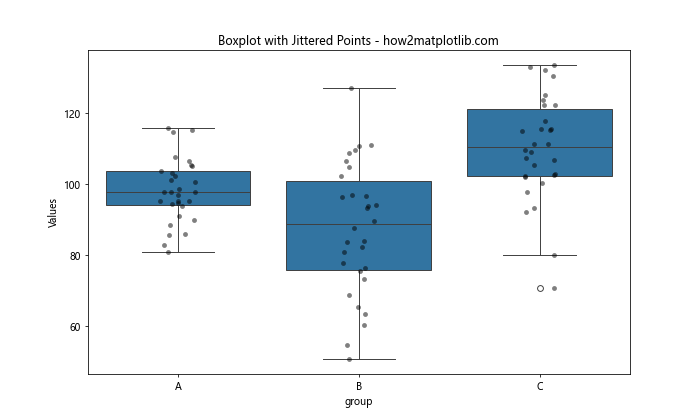
在这个例子中,我们首先使用Seaborn的boxplot()函数创建了基本的箱线图,然后使用stripplot()函数添加了抖动点。抖动点以黑色半透明的方式显示,使我们能够看到每个数据点的分布。
14. 创建分面的箱线图
当我们有多个类别需要比较时,可以使用分面(faceting)技术来创建多个子图:
import matplotlib.pyplot as plt
import seaborn as sns
import numpy as np
import pandas as pd

# 准备数据
np.random.seed(42)
df = pd.DataFrame({
    'value': np.concatenate([
        np.random.normal(100, 10, 200),
        np.random.normal(90, 20, 200),
        np.random.normal(110, 15, 200),
        np.random.normal(95, 12, 200),
        np.random.normal(105, 18, 200),
        np.random.normal(100, 15, 200)
    ]),
    'group': np.repeat(['A', 'B', 'C'], 400),
    'condition': np.tile(np.repeat(['X', 'Y'], 200), 3)
})

# 创建分面的箱线图
g = sns.FacetGrid(df, col="condition", height=5, aspect=.8)
g.map(sns.boxplot, "group", "value")
g.set_axis_labels("Group", "Value")
g.set_titles("Condition: {col_name}")
g.fig.suptitle('Faceted Grouped Boxplot - how2matplotlib.com', y=1.05)
plt.tight_layout()
plt.show()
Output:
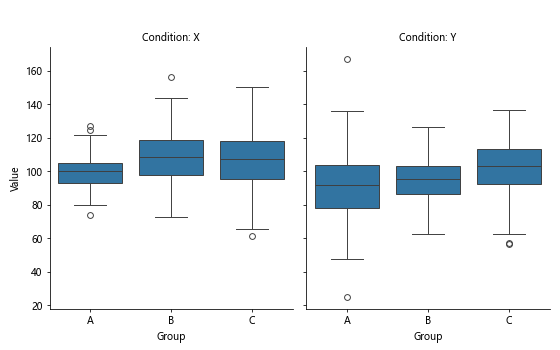
在这个例子中,我们使用Seaborn的FacetGrid来创建分面图。每个分面对应一个’condition’,在每个分面内我们创建了一个按’group’分组的箱线图。
15. 创建彩虹箱线图
彩虹箱线图是一种特殊的箱线图,它使用渐变色来增强视觉效果:
import matplotlib.pyplot as plt
import numpy as np
import pandas as pd

# 准备数据
np.random.seed(42)
df = pd.DataFrame({
    'Group A': np.random.normal(100, 10, 200),
    'Group B': np.random.normal(90, 20, 200),
    'Group C': np.random.normal(110, 15, 200),
    'Group D': np.random.normal(95, 12, 200),
    'Group E': np.random.normal(105, 18, 200)
})

# 创建彩虹箱线图
fig, ax = plt.subplots(figsize=(12, 6))
bp = ax.boxplot(df.values)

for i, box in enumerate(bp['boxes']):
    box_color = plt.cm.rainbow(i / len(df.columns))
    box.set_facecolor(box_color)
    box.set_alpha(0.7)

ax.set_xticklabels(df.columns)
plt.title('Rainbow Grouped Boxplot - how2matplotlib.com')
plt.ylabel('Values')
plt.show()
在这个例子中,我们使用Matplotlib的boxplot()函数创建了基本的箱线图,然后遍历每个箱体,使用彩虹色谱(plt.cm.rainbow)为每个箱体设置不同的颜色。
总结
本文详细介绍了如何使用Matplotlib创建各种类型的分组箱线图,从基本的箱线图到高级的定制化图表。我们探讨了数据准备、样式定制、添加统计信息、多变量分组等多个方面。通过这些技巧,你可以创建出既信息丰富又视觉吸引的数据可视化图表。
记住,好的数据可视化不仅要准确地表达数据,还要让观众能够轻松理解。在创建箱线图时,要根据你的数据特点和目标受众来选择最合适的展示方式。同时,不要忘记添加清晰的标题、标签和图例,以确保你的图表能够自我解释。
最后,虽然本文主要关注Matplotlib,但我们也介绍了如何使用Seaborn来创建更美观的箱线图。在实际工作中,你可能会发现这两个库的结合使用能够帮助你创建出最佳的数据可视化效果。
 极客教程
极客教程