如何在matplotlib中更改轴的刻度
参考:how to change scale of axis in matplotlib
在制作数据可视化图表时,轴的刻度是非常重要的,它们可以帮助我们更好地理解数据的变化趋势。在matplotlib中,我们可以通过一些方法来更改轴的刻度,包括调整刻度的范围、刻度的间距、刻度的位置等。本文将详细介绍如何在matplotlib中更改轴的刻度,希望对大家有所帮助。
1. 改变刻度的范围
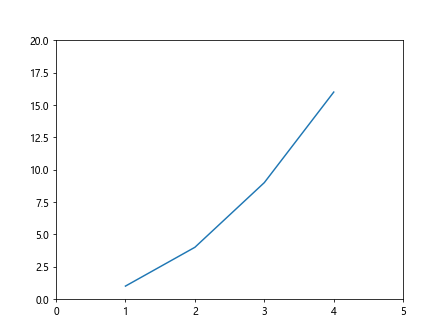
有时候我们需要改变轴的刻度范围,使得更能突出数据的某个区间。在matplotlib中,我们可以使用set_xlim()和set_ylim()方法来设置x轴和y轴的刻度范围。
import matplotlib.pyplot as plt

plt.plot([1, 2, 3, 4], [1, 4, 9, 16])
plt.xlim(0, 5)  # 设置x轴的范围为0到5
plt.ylim(0, 20)  # 设置y轴的范围为0到20
plt.show()
Output:
2. 改变刻度的间距
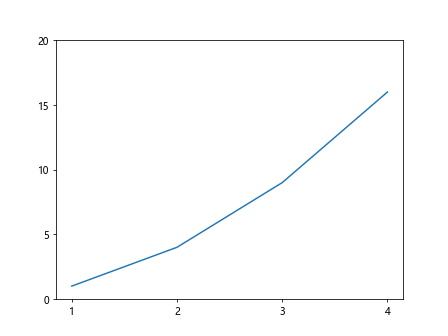
有时候我们需要改变轴的刻度间距,使得图表更加清晰易读。在matplotlib中,我们可以使用set_xticks()和set_yticks()方法来设置x轴和y轴的刻度间距。
import matplotlib.pyplot as plt

plt.plot([1, 2, 3, 4], [1, 4, 9, 16])
plt.xticks([1, 2, 3, 4])  # 设置x轴的刻度间距为1
plt.yticks([0, 5, 10, 15, 20])  # 设置y轴的刻度间距为5
plt.show()
Output:
3. 调整刻度的位置
有时候我们需要调整刻度的位置,使得更符合数据的展示。在matplotlib中,我们可以使用set_xticklabels()和set_yticklabels()方法来设置x轴和y轴的刻度位置。
import matplotlib.pyplot as plt

plt.plot([1, 2, 3, 4], [1, 4, 9, 16])
plt.xticks([1, 2, 3, 4], ['A', 'B', 'C', 'D'])  # 设置x轴的刻度位置为A、B、C、D
plt.yticks([0, 5, 10, 15, 20], ['Low', 'Medium', 'High', 'Very High'])  # 设置y轴的刻度位置为Low、Medium、High、Very High
plt.show()
4. 自定义刻度的旋转角度
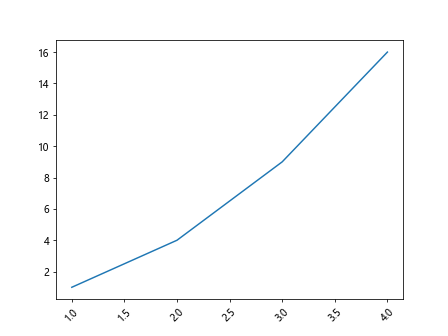
有时候刻度的标签比较长,需要旋转一定角度来更好地展示。在matplotlib中,我们可以使用xticks()和yticks()方法来设置刻度的旋转角度。
import matplotlib.pyplot as plt

plt.plot([1, 2, 3, 4], [1, 4, 9, 16])
plt.xticks(rotation=45)  # 设置x轴刻度标签旋转45度
plt.show()
Output:
5. 隐藏刻度
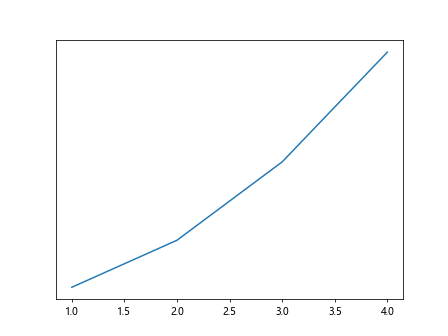
有时候我们需要隐藏某个轴的刻度,以便更好地突出数据的展示。在matplotlib中,我们可以使用set_xticks([])和set_yticks([])方法来隐藏x轴和y轴的刻度。
import matplotlib.pyplot as plt

plt.plot([1, 2, 3, 4], [1, 4, 9, 16])
plt.yticks([])  # 隐藏y轴的刻度
plt.show()
Output:
6. 设置刻度标签的格式
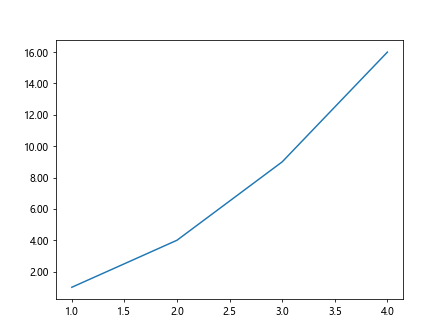
有时候我们需要设置刻度标签的格式,比如显示小数点后几位,或者使用科学计数法。在matplotlib中,我们可以使用FormatStrFormatter和ScalarFormatter来设置刻度标签的格式。
import matplotlib.pyplot as plt
from matplotlib.ticker import FormatStrFormatter

fig, ax = plt.subplots()
ax.plot([1, 2, 3, 4], [1, 4, 9, 16])
ax.yaxis.set_major_formatter(FormatStrFormatter('%.2f'))  # 设置y轴刻度标签显示两位小数
plt.show()
Output:
7. 设置对数刻度
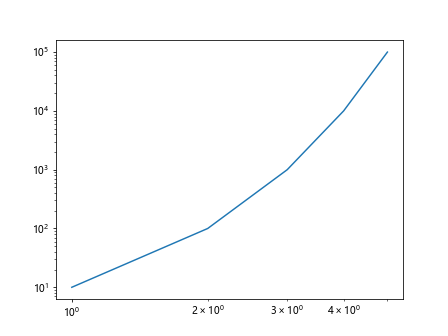
有时候我们需要使用对数刻度来展示数据,特别是在数据的范围非常大或非常小时。在matplotlib中,我们可以使用set_xscale('log')和set_yscale('log')来设置对数刻度。
import matplotlib.pyplot as plt

plt.plot([1, 2, 3, 4, 5], [10, 100, 1000, 10000, 100000])
plt.xscale('log')  # 设置x轴为对数刻度
plt.yscale('log')  # 设置y轴为对数刻度
plt.show()
Output:
8. 设置刻度的显示位置
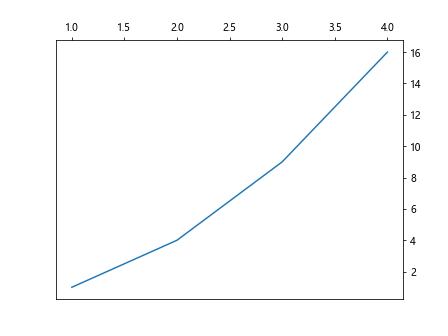
有时候我们需要设置刻度的显示位置,使得更符合数据的分布。在matplotlib中,我们可以使用set_ticks_position()来设置刻度的显示位置。
import matplotlib.pyplot as plt

fig, ax = plt.subplots()
ax.plot([1, 2, 3, 4], [1, 4, 9, 16])
ax.xaxis.set_ticks_position('top')  # 设置x轴的刻度显示在顶部
ax.yaxis.set_ticks_position('right')  # 设置y轴的刻度显示在右侧
plt.show()
Output:
9. 修改刻度的字体大小和样式
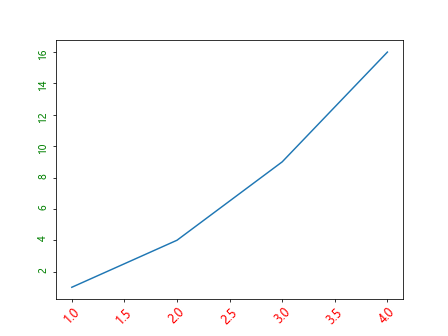
有时候我们需要修改刻度的字体大小和样式,使得更加清晰明了。在matplotlib中,我们可以使用tick_params()方法来设置刻度的字体大小和样式。
import matplotlib.pyplot as plt

plt.plot([1, 2, 3, 4], [1, 4, 9, 16])
plt.tick_params(axis='x', labelsize=12, labelcolor='r', labelrotation=45)  # 设置x轴刻度标签的大小、颜色和旋转角度
plt.tick_params(axis='y', labelsize=10, labelcolor='g', labelrotation=90)  # 设置y轴刻度标签的大小、颜色和旋转角度
plt.show()
Output:
10. 设置主刻度和次刻度
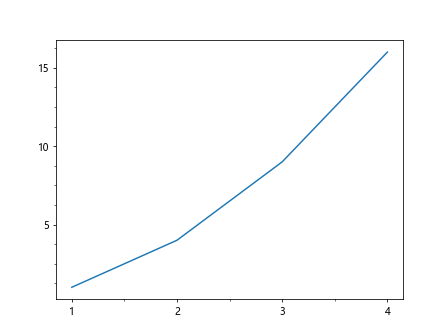
有时候我们需要设置主刻度和次刻度,以便更好地展示数据。在matplotlib中,我们可以使用MultipleLocator和AutoMinorLocator来设置主刻度和次刻度。
import matplotlib.pyplot as plt
import matplotlib.ticker as ticker

fig, ax = plt.subplots()
ax.plot([1, 2, 3, 4], [1, 4, 9, 16])

# 设置x轴的主刻度间隔为1,次刻度间隔为0.5
ax.xaxis.set_major_locator(ticker.MultipleLocator(1))
ax.xaxis.set_minor_locator(ticker.AutoMinorLocator(2))

# 设置y轴的主刻度间隔为5,次刻度间隔为1
ax.yaxis.set_major_locator(ticker.MultipleLocator(5))
ax.yaxis.set_minor_locator(ticker.AutoMinorLocator(4))

plt.show()
Output:
11. 设置刻度的格式化
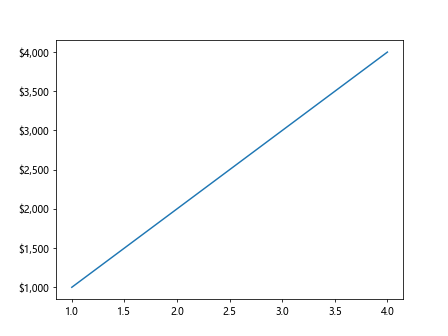
有时候我们需要对刻度进行格式化,比如设置千位分隔符、显示百分比等。在matplotlib中,我们可以使用FuncFormatter来对刻度进行格式化。
import matplotlib.pyplot as plt
import matplotlib.ticker as ticker

fig, ax = plt.subplots()
ax.plot([1, 2, 3, 4], [1000, 2000, 3000, 4000])

def format_func(value, tick_number):
    return f"${value:,.0f}"  # 添加千位分隔符

formatter = ticker.FuncFormatter(format_func)
ax.yaxis.set_major_formatter(formatter)

plt.show()
Output:
12. 设置刻度的方向
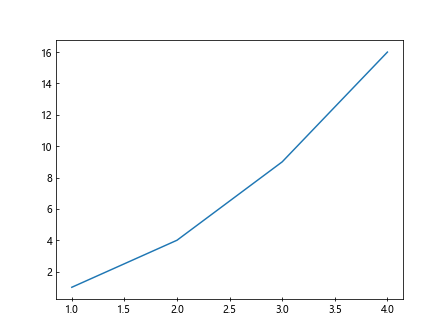
有时候我们需要设置刻度的方向,使得更符合习惯。在matplotlib中,我们可以使用set_tick_params()方法来设置刻度的方向。
import matplotlib.pyplot as plt

fig, ax = plt.subplots()
ax.plot([1, 2, 3, 4], [1, 4, 9, 16])
ax.tick_params(axis='x', direction='inout')  # 设置x轴刻度的方向为内外
ax.tick_params(axis='y', direction='in')  # 设置y轴刻度的方向为内
plt.show()
Output:
13. 设置刻度的网格线
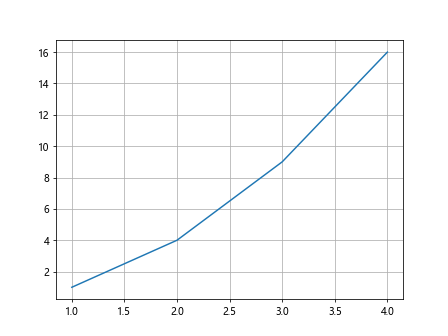
有时候我们需要在图表中添加刻度的网格线,以便更好地分辨数据的分布。在matplotlib中,我们可以使用grid()方法来添加刻度的网格线。
import matplotlib.pyplot as plt

plt.plot([1, 2, 3, 4], [1, 4, 9, 16])
plt.grid(True)  # 添加刻度的网格线
plt.show()
Output:
14. 设置刻度的对齐方式
有时候我们需要设置刻度的对齐方式,使得更加清晰。在matplotlib中,我们可以使用align_xlabels()和align_ylabels()来设置刻度的对齐方式。
import matplotlib.pyplot as plt

fig, axs = plt.subplots(2, 2)
for ax in axs.flat:
    ax.plot([1, 2, 3, 4], [1, 4, 9, 16])

plt.align_xlabels()
plt.align_ylabels()
plt.show()
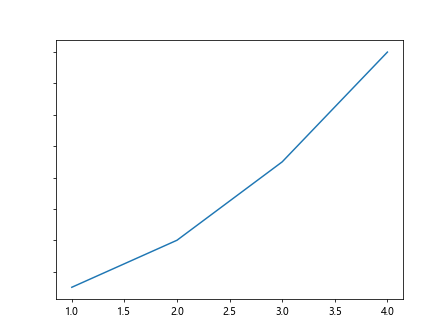
15. 隐藏刻度标签
有时候我们需要隐藏刻度标签,以便更好地展示数据。在matplotlib中,我们可以使用null_formatter来隐藏刻度标签。
import matplotlib.pyplot as plt
import matplotlib.ticker as ticker

fig, ax = plt.subplots()
ax.plot([1, 2, 3, 4], [1, 4, 9, 16])
ax.yaxis.set_major_formatter(ticker.NullFormatter())  # 隐藏y轴的刻度标签
plt.show()
Output:
本文介绍了如何在matplotlib中更改轴的刻度,包括改变刻度的范围、间距、位置,自定义刻度标签的旋转角度、格式化等操作。
 极客教程
极客教程