如何在matplotlib中更改图例的位置
参考:how to change the position of legend in matplotlib
图例在matplotlib中是一种非常重要的元素,用来解释图中各个数据集的含义。有时候我们需要调整图例的位置,使得它不挡住数据的展示,或者更好地与图表整体结合。本文将详细介绍如何在matplotlib中更改图例的位置。
1. 设置图例的位置
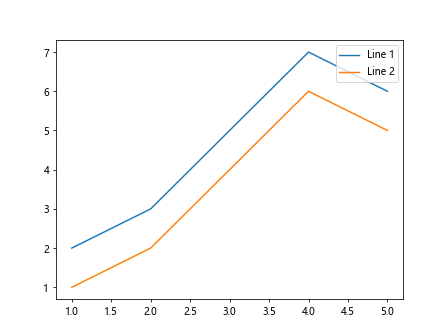
在matplotlib中,我们可以使用legend函数来设置图例的位置。默认情况下,图例的位置是best,即在当前轴上找到一个最佳位置放置图例。我们也可以通过loc参数来指定图例的位置,常用的取值有:
– ‘best’
– ‘upper right’
– ‘upper left’
– ‘lower left’
– ‘lower right’
– ‘right’
– ‘center left’
– ‘center right’
– ‘lower center’
– ‘upper center’
– ‘center’
示例代码如下:
import matplotlib.pyplot as plt

x = [1, 2, 3, 4, 5]
y1 = [2, 3, 5, 7, 6]
y2 = [1, 2, 4, 6, 5]

plt.plot(x, y1, label='Line 1')
plt.plot(x, y2, label='Line 2')

plt.legend(loc='upper right')
plt.show()
Output:
2. 改变图例的位置
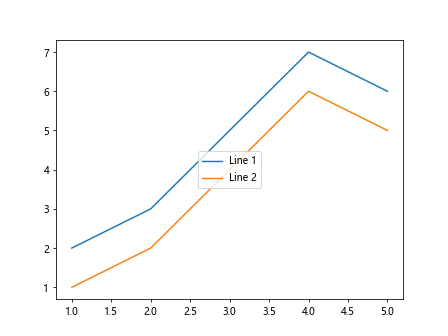
如果我们想要将图例放置在图表的其他位置,可以使用bbox_to_anchor参数和loc参数结合来设置图例的位置。bbox_to_anchor参数是一个包含两个值的元组,分别代表图例的左下角的位置。示例代码如下:
import matplotlib.pyplot as plt

x = [1, 2, 3, 4, 5]
y1 = [2, 3, 5, 7, 6]
y2 = [1, 2, 4, 6, 5]

plt.plot(x, y1, label='Line 1')
plt.plot(x, y2, label='Line 2')

plt.legend(loc='center', bbox_to_anchor=(0.5, 0.5))
plt.show()
Output:
3. 改变图例的方向
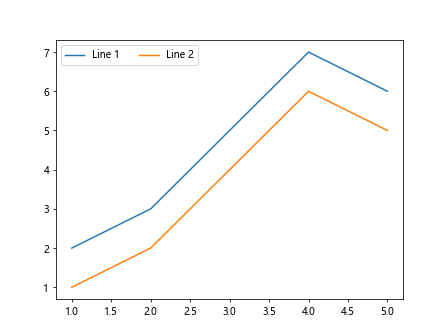
有时候我们需要改变图例中文字的排列方向,可以通过设置ncol参数来实现。ncol参数代表图例的列数。示例代码如下:
import matplotlib.pyplot as plt

x = [1, 2, 3, 4, 5]
y1 = [2, 3, 5, 7, 6]
y2 = [1, 2, 4, 6, 5]

plt.plot(x, y1, label='Line 1')
plt.plot(x, y2, label='Line 2')

plt.legend(ncol=2)
plt.show()
Output:
4. 调整图例的大小
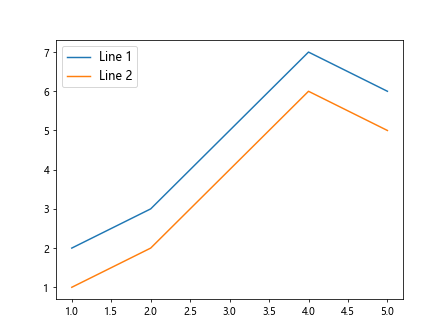
有时候我们需要调整图例的大小,可以通过prop参数来设置图例中文字的大小。示例代码如下:
import matplotlib.pyplot as plt

x = [1, 2, 3, 4, 5]
y1 = [2, 3, 5, 7, 6]
y2 = [1, 2, 4, 6, 5]

plt.plot(x, y1, label='Line 1')
plt.plot(x, y2, label='Line 2')

plt.legend(prop={'size': 12})
plt.show()
Output:
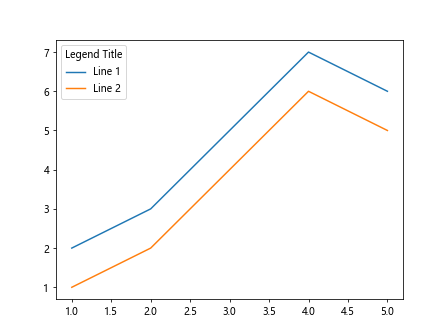
5. 自定义图例的标题
有时候我们需要给图例添加标题,可以通过title参数来设置图例的标题。示例代码如下:
import matplotlib.pyplot as plt

x = [1, 2, 3, 4, 5]
y1 = [2, 3, 5, 7, 6]
y2 = [1, 2, 4, 6, 5]

plt.plot(x, y1, label='Line 1')
plt.plot(x, y2, label='Line 2')

plt.legend(title='Legend Title')
plt.show()
Output:
6. 隐藏图例
有时候我们不需要显示图例,可以通过设置show_legend参数为False来隐藏图例。示例代码如下:
import matplotlib.pyplot as plt

x = [1, 2, 3, 4, 5]
y1 = [2, 3, 5, 7, 6]
y2 = [1, 2, 4, 6, 5]

plt.plot(x, y1, label='Line 1')
plt.plot(x, y2, label='Line 2')

plt.legend(show_legend=False)
plt.show()
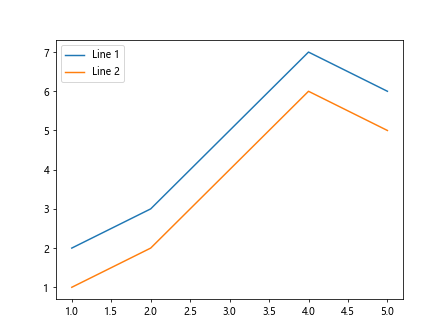
7. 调整图例的背景色
有时候我们需要调整图例的背景色,可以通过fancybox参数来设置图例的背景是否带有圆角效果。示例代码如下:
import matplotlib.pyplot as plt

x = [1, 2, 3, 4, 5]
y1 = [2, 3, 5, 7, 6]
y2 = [1, 2, 4, 6, 5]

plt.plot(x, y1, label='Line 1')
plt.plot(x, y2, label='Line 2')

plt.legend(fancybox=True)
plt.show()
Output:
8. 调整图例的边框
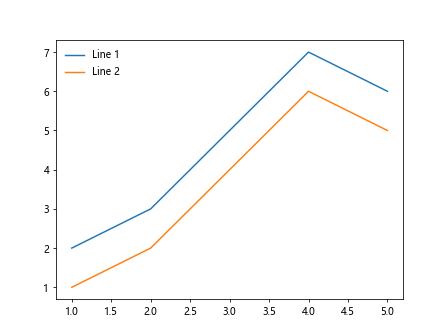
有时候我们需要调整图例的边框,可以通过frameon参数来控制图例是否显示边框。示例代码如下:
import matplotlib.pyplot as plt

x = [1, 2, 3, 4, 5]
y1 = [2, 3, 5, 7, 6]
y2 = [1, 2, 4, 6, 5]

plt.plot(x, y1, label='Line 1')
plt.plot(x, y2, label='Line 2')

plt.legend(frameon=False)
plt.show()
Output:
9. 调整图例的透明度
有时候我们需要调整图例的透明度,可以通过alpha参数来设置图例的透明度。示例代码如下:
import matplotlib.pyplot as plt

x = [1, 2, 3, 4, 5]
y1 = [2, 3, 5, 7, 6]
y2 = [1, 2, 4, 6, 5]

plt.plot(x, y1, label='Line 1')
plt.plot(x, y2, label='Line 2')

plt.legend(alpha=0.5)
plt.show()
10. 调整图例的阴影
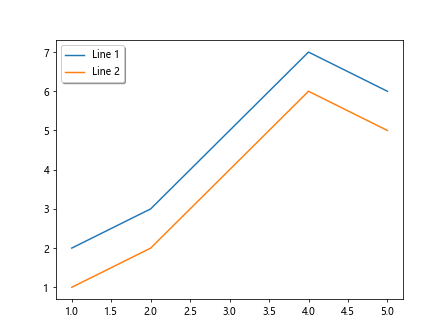
有时候我们需要调整图例的阴影效果,可以通过shadow参数来设置图例是否带有阴影。示例代码如下:
import matplotlib.pyplot as plt

x = [1, 2, 3, 4, 5]
y1 = [2, 3, 5, 7, 6]
y2 = [1, 2, 4, 6, 5]

plt.plot(x, y1, label='Line 1')
plt.plot(x, y2, label='Line 2')

plt.legend(shadow=True)
plt.show()
Output:
通过以上示例代码,我们可以看到在matplotlib中如何改变图例的位置、方向、大小、标题、透明度、背景色、边框和阴影等属性。这些参数可以帮助我们更好地调整图例,使得图表的展示更加清晰和美观。
除了上述示例代码中提到的参数外,matplotlib还提供了许多其他可以调整图例样式的参数,如borderpad、labelspacing、handletextpad、columnspacing、markerfirst、framealpha等等。通过灵活地搭配这些参数,我们可以根据具体需求定制出符合要求的图例样式。
总的来说,对图例进行位置、大小、颜色、样式等方面的调整是制作图表中必不可少的一部分。通过合理地调整图例,我们可以使图表更加直观清晰,更具有视觉吸引力。
 极客教程
极客教程