如何在Matplotlib中添加误差线
参考:how to add error bars in matplotlib
Matplotlib是一个Python绘图库,可以用于创建丰富多样的可视化图表。在数据分析和展示中,误差线是很重要的一部分,可以帮助展示数据的不确定性和可靠性。本文将介绍如何在Matplotlib中添加误差线,以及不同类型误差线的绘制方法。
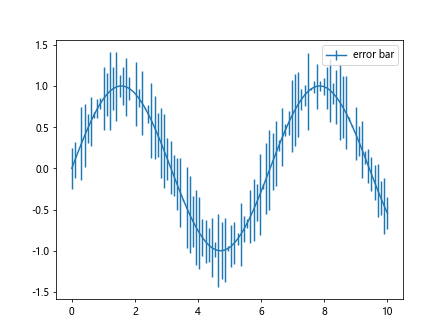
在折线图中添加误差线
import matplotlib.pyplot as plt
import numpy as np

x = np.linspace(0, 10, 100)
y = np.sin(x)

# 创建随机误差
error = np.random.rand(100) * 0.5

plt.errorbar(x, y, yerr=error, label='error bar')
plt.legend()
plt.show()
Output:
在柱状图中添加误差线
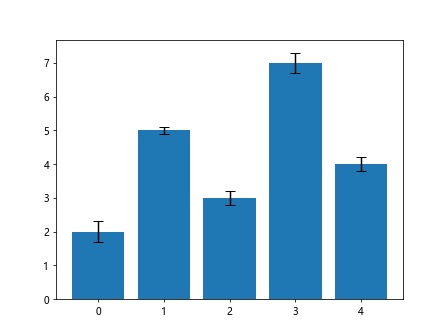
import matplotlib.pyplot as plt
import numpy as np

x = np.arange(5)
y = np.array([2, 5, 3, 7, 4])

# 创建固定误差
error = np.array([0.3, 0.1, 0.2, 0.3, 0.2])

plt.bar(x, y, yerr=error, capsize=5)
plt.show()
Output:
不同误差线风格
import matplotlib.pyplot as plt
import numpy as np

x = np.arange(5)
y = np.array([2, 5, 3, 7, 4])

# 创建不同类型误差
asymmetric_error = [[0.1, 0.3], [0.2, 0.4], [0.3, 0.2], [0.4, 0.3], [0.2, 0.1]]

plt.errorbar(x, y, yerr=asymmetric_error, fmt='o', capsize=5, label='asymmetric error')
plt.legend()
plt.show()
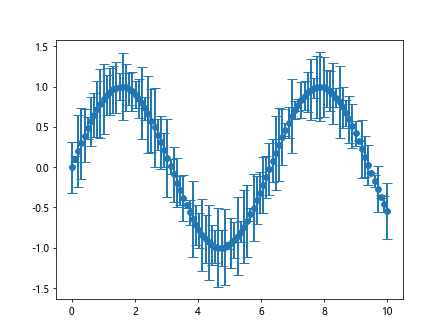
更多误差线控制参数
import matplotlib.pyplot as plt
import numpy as np

x = np.linspace(0, 10, 100)
y = np.sin(x)

# 创建不同类型误差
error = np.random.rand(100) * 0.5

plt.errorbar(x, y, yerr=error, fmt='o', capsize=5, elinewidth=2, barsabove=True)
plt.show()
Output:
多组数据的误差线
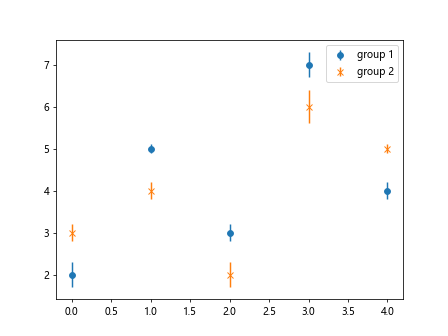
import matplotlib.pyplot as plt
import numpy as np

x = np.arange(5)
y1 = np.array([2, 5, 3, 7, 4])
y2 = np.array([3, 4, 2, 6, 5])

error1 = np.array([0.3, 0.1, 0.2, 0.3, 0.2])
error2 = np.array([0.2, 0.2, 0.3, 0.4, 0.1])

plt.errorbar(x, y1, yerr=error1, fmt='o', label='group 1')
plt.errorbar(x, y2, yerr=error2, fmt='x', label='group 2')
plt.legend()
plt.show()
Output:
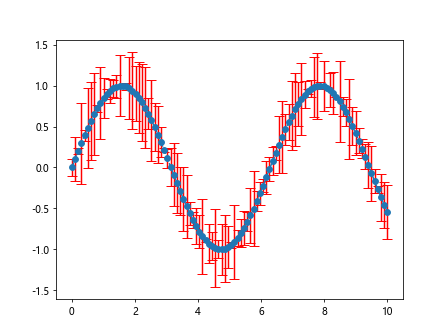
自定义误差线颜色和样式
import matplotlib.pyplot as plt
import numpy as np

x = np.linspace(0, 10, 100)
y = np.sin(x)

# 创建随机误差
error = np.random.rand(100) * 0.5

plt.errorbar(x, y, yerr=error, fmt='o', ecolor='red', capsize=5, linestyle='--')
plt.show()
Output:
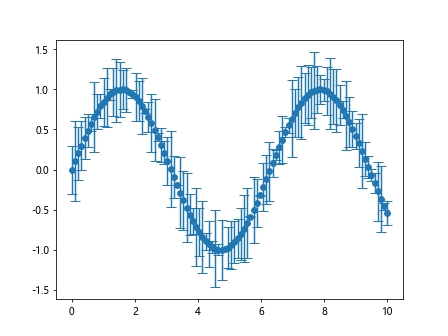
特定数据点误差线
import matplotlib.pyplot as plt
import numpy as np

x = np.linspace(0, 10, 100)
y = np.sin(x)

# 创建随机误差
error = np.random.rand(100) * 0.5

error[::10] = 0.3  # 每隔10个数据点添加特定误差

plt.errorbar(x, y, yerr=error, fmt='o', capsize=5)
plt.show()
Output:
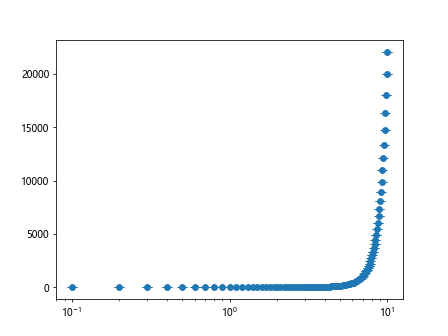
对数坐标轴误差线
import matplotlib.pyplot as plt
import numpy as np

x = np.linspace(0.1, 10, 100)
y = np.exp(x)

# 创建随机误差
error = np.random.rand(100) * 0.1

plt.errorbar(x, y, yerr=error, fmt='o', capsize=5)
plt.xscale('log')
plt.show()
Output:
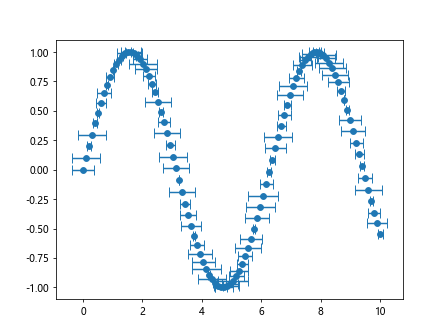
水平误差线
import matplotlib.pyplot as plt
import numpy as np

x = np.linspace(0, 10, 100)
y = np.sin(x)

# 创建随机误差
error = np.random.rand(100) * 0.5

plt.errorbar(x, y, xerr=error, fmt='o', capsize=5)
plt.show()
Output:
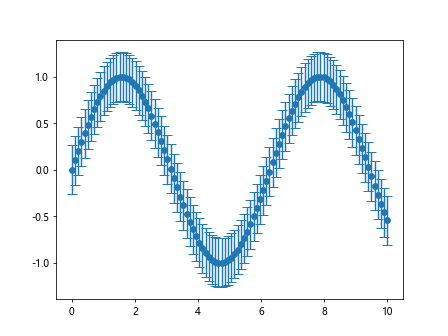
自动计算误差线
import matplotlib.pyplot as plt
import numpy as np

x = np.linspace(0, 10, 100)
y = np.sin(x)

# 创建随机数据
data = np.random.rand(100)

# 计算标准差作为误差
error = np.std(data)

plt.errorbar(x, y, yerr=error, fmt='o', capsize=5)
plt.show()
Output:
以上是在Matplotlib中添加误差线的一些示例代码,希望对你有所帮助。在数据可视化中,显示误差线是展示数据精确性和稳定性的一种重要方法。
 极客教程
极客教程