如何清除matplotlib中的图表
参考:how to clear plot matplotlib
在使用matplotlib进行数据可视化时,有时候我们需要清除当前图表的内容,这样可以更好地展示新的数据或者重新绘制图表。本文将介绍如何清除matplotlib图表的方法。
1. 使用clf()方法清除图表
可以使用clf()方法来清除当前图表的内容。该方法将清除当前figure中的所有轴和图形,使得图表变为空白。下面是使用clf()方法清除图表的示例代码:
import matplotlib.pyplot as plt

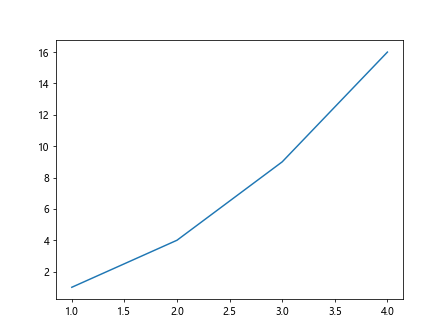
plt.plot([1, 2, 3, 4], [1, 4, 9, 16])
plt.show()

plt.clf()
plt.show()
2. 使用cla()方法清除轴
如果只是想清除当前图表中的所有轴的内容,可以使用cla()方法。该方法会清除当前axes对象中的所有图形,但是不会清除整个figure,下面是使用cla()方法清除轴的示例代码:
import matplotlib.pyplot as plt

plt.plot([1, 2, 3, 4], [1, 4, 9, 16])
plt.show()

plt.cla()
plt.show()
3. 使用close()方法关闭图表
除了清除图表内容,还可以使用close()方法关闭整个图表窗口。该方法会关闭当前图表所在的窗口,下次再绘制图表时会重新打开一个新的窗口。下面是使用close()方法关闭图表的示例代码:
import matplotlib.pyplot as plt

plt.plot([1, 2, 3, 4], [1, 4, 9, 16])
plt.show()

plt.close()
Output:

4. 清除特定轴的内容
有时候我们可能只想清除某个特定轴上的内容,可以通过调用轴对象的方法来实现。下面是清除特定轴内容的示例代码:
import matplotlib.pyplot as plt

fig, ax = plt.subplots()
ax.plot([1, 2, 3, 4], [1, 4, 9, 16])
plt.show()

ax.clear()
plt.show()
5. 清除图表中的特定图形
如果只想清除图表中的某个特定图形,可以使用remove()方法。该方法可以移除指定的图形对象,下面是清除特定图形的示例代码:
import matplotlib.pyplot as plt

line, = plt.plot([1, 2, 3, 4], [1, 4, 9, 16])
plt.show()

line.remove()
plt.show()
6. 清除图表中的特定文本
类似地,如果只想清除图表中的某些文本,也可以使用remove()方法。下面是清除特定文本的示例代码:
import matplotlib.pyplot as plt

text = plt.text(0.5, 0.5, 'Hello, how2matplotlib.com', fontsize=12)
plt.show()

text.remove()
plt.show()
7. 清除特定图形类型
如果要清除所有特定类型的图形,可以使用如下方法:
import matplotlib.pyplot as plt

line, = plt.plot([1, 2, 3, 4], [1, 4, 9, 16])
scatter = plt.scatter([1, 2, 3, 4], [1, 4, 9, 16])
plt.show()

for artist in plt.gca().get_children():
    if isinstance(artist, plt.Line2D):
        artist.remove()

plt.show()
8. 清除所有图形
如果想要在一次性清除整个图表的所有内容,可以使用如下方法:
import matplotlib.pyplot as plt

plt.plot([1, 2, 3, 4], [1, 4, 9, 16])
plt.show()

for artist in plt.gca().get_children():
    artist.remove()

plt.show()
9. 清除图表中的所有文本
如果想要清除图表中的所有文本,可以使用如下方法:
import matplotlib.pyplot as plt

plt.text(0.5, 0.5, 'Hello, how2matplotlib.com', fontsize=12)
plt.text(0.2, 0.2, 'This is a text', fontsize=10)
plt.show()

for artist in plt.gca().texts:
    artist.remove()

plt.show()
10. 清除图表中的所有图例
如果想要清除图表中的所有图例,可以使用如下方法:
import matplotlib.pyplot as plt

plt.plot([1, 2, 3, 4], [1, 4, 9, 16], label='line 1')
plt.plot([1, 2, 3, 4], [1, 3, 5, 7], label='line 2')
plt.legend()
plt.show()

plt.gca().get_legend().remove()

plt.show()
以上就是使用matplotlib清除图表内容的一些方法,根据具体情况选择适合的方法来清除图表是非常重要的。
 极客教程
极客教程