在matplotlib中将网格放在图形后面
参考:grid behind plot matplotlib
在使用matplotlib绘制图形时,我们经常会添加网格以帮助我们更好地理解数据分布。默认情况下,网格会显示在绘图的前面,与数据点重叠。但有时候我们希望网格在图形的背后,以便更清晰地展示数据。在本文中,我将介绍如何将网格放在matplotlib图形的后面。
方法一:使用zorder参数
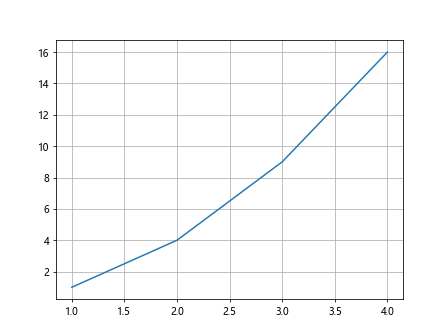
zorder参数可用于控制图形元素的层次顺序。当zorder值较大时,元素将显示在较小值元素的前面。我们可以使用这个参数将网格放在图形的后面。
import matplotlib.pyplot as plt

plt.plot([1, 2, 3, 4], [1, 4, 9, 16])
plt.grid(True, zorder=0)

plt.show()
Output:
方法二:使用set_facecolor方法
我们还可以使用set_facecolor方法设置绘图区域的背景色,以将网格放在图形的后面。
import matplotlib.pyplot as plt

fig, ax = plt.subplots()
ax.plot([1, 2, 3, 4], [1, 4, 9, 16])

ax.set_facecolor('lightgrey')
ax.grid(True)

plt.show()
Output:

方法三:使用add_axes方法
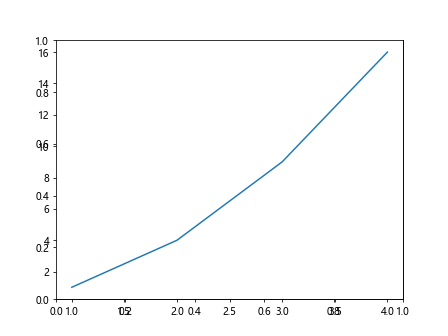
通过将网格添加到新的坐标轴上,我们可以实现将网格放在图形的背后。
import matplotlib.pyplot as plt

fig, ax = plt.subplots()
ax.plot([1, 2, 3, 4], [1, 4, 9, 16])

ax2 = fig.add_axes(ax.get_position(), zorder=-1)
ax2.set_facecolor('lightgrey')
ax2.grid(True)

plt.show()
Output:
方法四:使用zorder和alpha参数
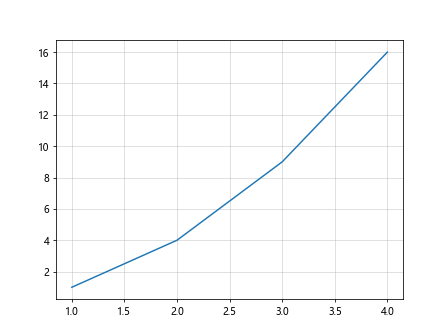
结合zorder和alpha参数,我们可以使网格显示在图形的背后并调节透明度。
import matplotlib.pyplot as plt

plt.plot([1, 2, 3, 4], [1, 4, 9, 16])
plt.grid(True, zorder=0, alpha=0.5)

plt.show()
Output:
方法五:在绘制网格后隐藏网格线
在绘制完网格后,我们可以将网格线设置为不可见,从而实现将网格显示在图形的背后。
import matplotlib.pyplot as plt

plt.plot([1, 2, 3, 4], [1, 4, 9, 16])
plt.grid(True)
for line in plt.gca().get_xgridlines():
    line.set_visible(False)
for line in plt.gca().get_ygridlines():
    line.set_visible(False)

plt.show()
Output:
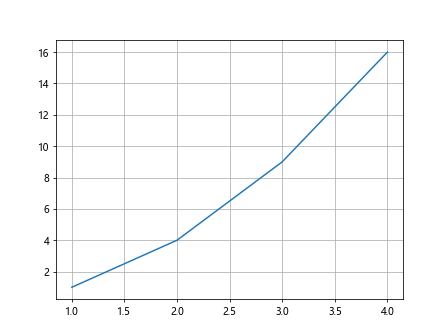
方法六:使用set_axisbelow方法
set_axisbelow方法可以指定网格在图形的前面或后面显示。将参数设置为True可以将网格显示在图形的后面。
import matplotlib.pyplot as plt

plt.plot([1, 2, 3, 4], [1, 4, 9, 16])
plt.grid(True)
plt.gca().set_axisbelow(True)

plt.show()
Output:
方法七:修改grid线的alpha值
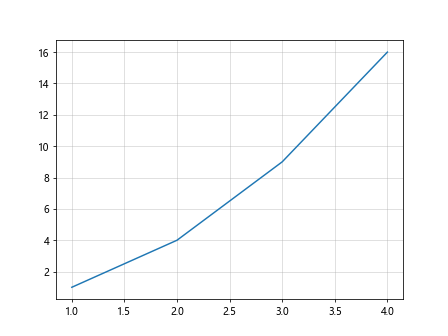
我们还可以通过设置网格线的透明度来达到将网格放在图形的后面的效果。
import matplotlib.pyplot as plt

plt.plot([1, 2, 3, 4], [1, 4, 9, 16])
plt.grid(True, alpha=0.5)

plt.show()
Output:
方法八:使用set_alpha方法
可以通过set_alpha方法设置网格的透明度,使其显示在图形的后面。
import matplotlib.pyplot as plt

plt.plot([1, 2, 3, 4], [1, 4, 9, 16])
plt.grid(True)
plt.gca().grid.set_alpha(0.5)

plt.show()
方法九:自定义背景颜色
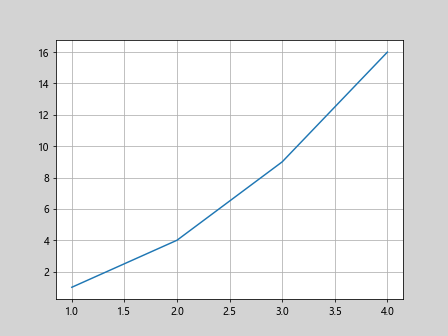
通过设置绘图区域的背景色,可以让网格显示在图形的后面。
import matplotlib.pyplot as plt

fig, ax = plt.subplots()
ax.plot([1, 2, 3, 4], [1, 4, 9, 16])

fig.patch.set_facecolor('lightgrey')
ax.grid(True)

plt.show()
Output:
方法十:使用add_subplot方法
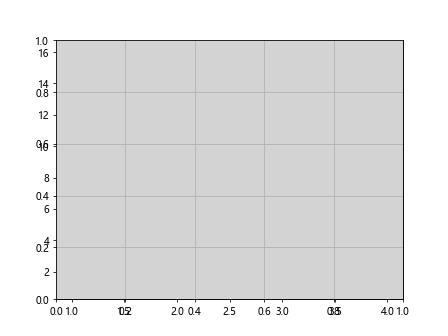
通过add_subplot方法添加一个新的子图,然后在新的子图上绘制网格,可以实现将网格放在图形的背后。
import matplotlib.pyplot as plt

fig, ax = plt.subplots()
ax.plot([1, 2, 3, 4], [1, 4, 9, 16])

ax2 = fig.add_subplot(111, facecolor='lightgrey')
ax2.grid(True)

plt.show()
Output:
通过以上方法,我们可以很容易地将网格放在matplotlib图形的后面,使数据更清晰地展示出来。
 极客教程
极客教程