Matplotlib图例添加标题的全面指南
参考:How to add a title to a Matplotlib legend
Matplotlib是Python中最流行的数据可视化库之一,它提供了强大的绘图功能。在数据可视化中,图例(legend)是一个重要的组成部分,它帮助读者理解图表中不同元素的含义。有时,我们需要为图例添加一个标题,以提供更多的上下文信息或者组织多个图例。本文将详细介绍如何在Matplotlib中为图例添加标题,包括多种方法和技巧。
1. 图例标题的基本概念
在开始学习如何添加图例标题之前,我们需要理解图例和图例标题的基本概念。
1.1 什么是图例?
图例是图表中的一个组件,用于解释图表中不同数据系列或元素的含义。它通常包含一系列标记和对应的文本说明。
1.2 为什么需要图例标题?
图例标题可以为图例提供额外的上下文信息,使图表更易理解。例如,在比较多个数据集的图表中,图例标题可以说明这些数据集的共同特征或分类依据。
1.3 图例标题的位置
图例标题通常位于图例的顶部,但也可以根据需要放置在其他位置,如底部或侧面。
让我们看一个简单的例子,展示图例和图例标题的基本概念:
import matplotlib.pyplot as plt

# 创建数据
x = range(1, 6)
y1 = [1, 4, 6, 8, 9]
y2 = [2, 5, 7, 8, 10]

# 创建图表
plt.figure(figsize=(8, 6))
plt.plot(x, y1, label='Series 1')
plt.plot(x, y2, label='Series 2')

# 添加图例和图例标题
legend = plt.legend(title='Data from how2matplotlib.com')

# 设置图表标题和轴标签
plt.title('Simple Plot with Legend Title')
plt.xlabel('X-axis')
plt.ylabel('Y-axis')

plt.show()
Output:
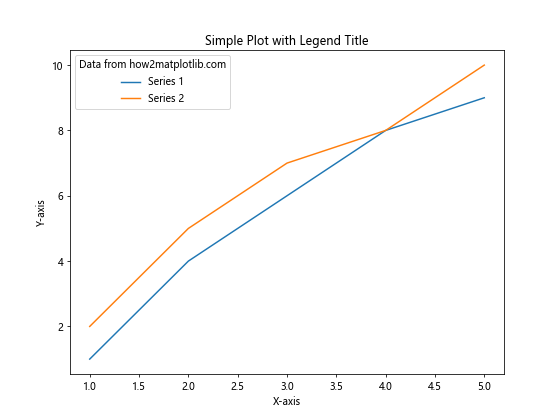
在这个例子中,我们创建了一个简单的线图,包含两个数据系列。我们使用plt.legend()函数添加了一个图例,并通过title参数为图例添加了一个标题。
2. 使用plt.legend()添加图例标题
plt.legend()函数是添加图例和图例标题最直接的方法。这个函数提供了多个参数来控制图例的外观和位置。
2.1 基本用法
最简单的添加图例标题的方法是在调用plt.legend()时使用title参数:
import matplotlib.pyplot as plt

plt.figure(figsize=(8, 6))
plt.plot([1, 2, 3, 4], [1, 4, 2, 3], label='Line 1')
plt.plot([1, 2, 3, 4], [2, 3, 4, 1], label='Line 2')

plt.legend(title='Data from how2matplotlib.com')
plt.title('Plot with Legend Title')
plt.xlabel('X-axis')
plt.ylabel('Y-axis')

plt.show()
Output:
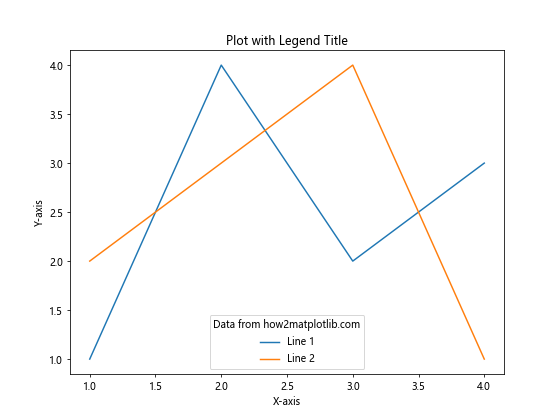
在这个例子中,我们创建了两条线,并为每条线添加了标签。然后,我们使用plt.legend(title='Data from how2matplotlib.com')来添加图例和图例标题。
2.2 自定义图例标题样式
我们可以通过设置title_fontsize和title_fontweight参数来自定义图例标题的字体大小和粗细:
import matplotlib.pyplot as plt

plt.figure(figsize=(8, 6))
plt.plot([1, 2, 3, 4], [1, 4, 2, 3], label='Line 1')
plt.plot([1, 2, 3, 4], [2, 3, 4, 1], label='Line 2')

plt.legend(title='Data from how2matplotlib.com',
           title_fontsize='14',
           title_fontweight='bold')
plt.title('Plot with Customized Legend Title')
plt.xlabel('X-axis')
plt.ylabel('Y-axis')

plt.show()
在这个例子中,我们将图例标题的字体大小设置为14,并将字体粗细设置为粗体。
2.3 调整图例位置
我们可以通过loc参数来调整图例的位置,这也会影响图例标题的位置:
import matplotlib.pyplot as plt

plt.figure(figsize=(8, 6))
plt.plot([1, 2, 3, 4], [1, 4, 2, 3], label='Line 1')
plt.plot([1, 2, 3, 4], [2, 3, 4, 1], label='Line 2')

plt.legend(title='Data from how2matplotlib.com',
           loc='upper left')
plt.title('Plot with Legend at Upper Left')
plt.xlabel('X-axis')
plt.ylabel('Y-axis')

plt.show()
Output:
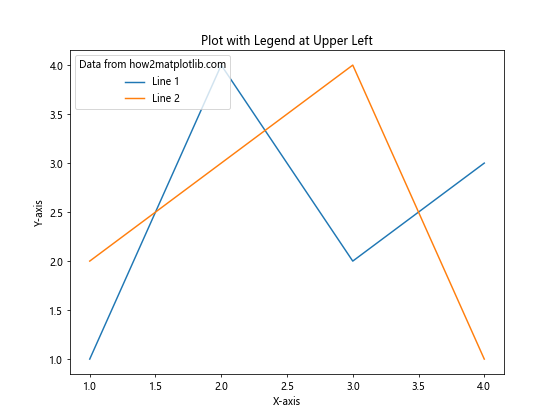
在这个例子中,我们将图例(包括其标题)放置在图表的左上角。
3. 使用ax.legend()添加图例标题
如果你正在使用面向对象的接口来创建Matplotlib图表,你可以使用ax.legend()方法来添加图例和图例标题。这种方法在处理多个子图时特别有用。
3.1 基本用法
import matplotlib.pyplot as plt

fig, ax = plt.subplots(figsize=(8, 6))
ax.plot([1, 2, 3, 4], [1, 4, 2, 3], label='Line 1')
ax.plot([1, 2, 3, 4], [2, 3, 4, 1], label='Line 2')

ax.legend(title='Data from how2matplotlib.com')
ax.set_title('Plot with Legend Title using ax.legend()')
ax.set_xlabel('X-axis')
ax.set_ylabel('Y-axis')

plt.show()
Output:
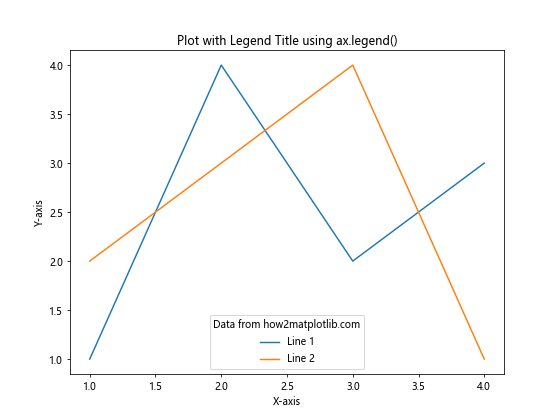
这个例子展示了如何使用ax.legend()方法添加图例标题。这种方法的工作原理与plt.legend()相同,但它适用于特定的轴对象。
3.2 在多个子图中添加图例标题
当你有多个子图时,ax.legend()方法特别有用:
import matplotlib.pyplot as plt

fig, (ax1, ax2) = plt.subplots(1, 2, figsize=(12, 5))

ax1.plot([1, 2, 3, 4], [1, 4, 2, 3], label='Line 1')
ax1.plot([1, 2, 3, 4], [2, 3, 4, 1], label='Line 2')
ax1.legend(title='Data 1 from how2matplotlib.com')
ax1.set_title('Subplot 1')

ax2.plot([1, 2, 3, 4], [3, 1, 4, 2], label='Line 3')
ax2.plot([1, 2, 3, 4], [4, 3, 2, 1], label='Line 4')
ax2.legend(title='Data 2 from how2matplotlib.com')
ax2.set_title('Subplot 2')

plt.tight_layout()
plt.show()
Output:
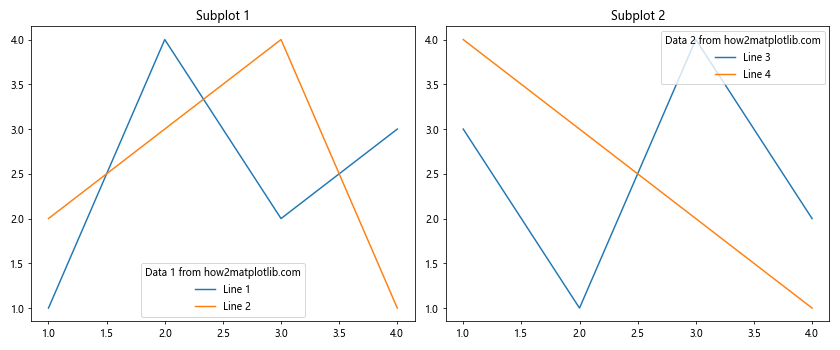
在这个例子中,我们创建了两个子图,每个子图都有自己的图例和图例标题。
4. 使用Legend对象添加和修改图例标题
有时,你可能需要在创建图例后修改或添加图例标题。这可以通过获取Legend对象并使用其方法来实现。
4.1 使用set_title()方法
import matplotlib.pyplot as plt

fig, ax = plt.subplots(figsize=(8, 6))
ax.plot([1, 2, 3, 4], [1, 4, 2, 3], label='Line 1')
ax.plot([1, 2, 3, 4], [2, 3, 4, 1], label='Line 2')

legend = ax.legend()
legend.set_title('Data from how2matplotlib.com')

ax.set_title('Plot with Legend Title Added Later')
ax.set_xlabel('X-axis')
ax.set_ylabel('Y-axis')

plt.show()
Output:
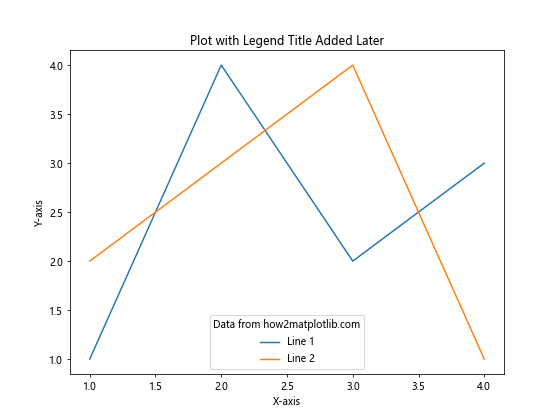
在这个例子中,我们首先创建了一个没有标题的图例,然后使用set_title()方法为其添加标题。
4.2 自定义图例标题属性
我们可以使用get_title()方法获取图例标题对象,然后修改其属性:
import matplotlib.pyplot as plt

fig, ax = plt.subplots(figsize=(8, 6))
ax.plot([1, 2, 3, 4], [1, 4, 2, 3], label='Line 1')
ax.plot([1, 2, 3, 4], [2, 3, 4, 1], label='Line 2')

legend = ax.legend(title='Data from how2matplotlib.com')
title = legend.get_title()
title.set_fontsize(14)
title.set_color('red')

ax.set_title('Plot with Customized Legend Title')
ax.set_xlabel('X-axis')
ax.set_ylabel('Y-axis')

plt.show()
Output:
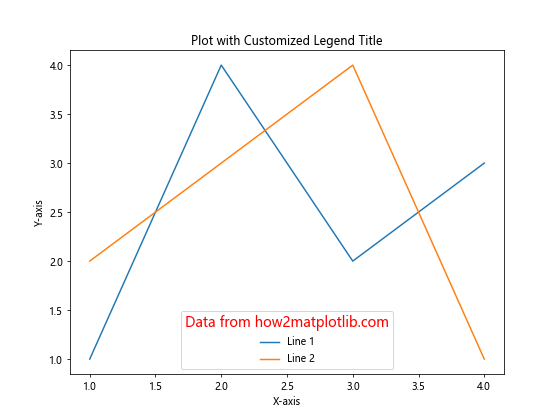
在这个例子中,我们获取了图例标题对象,然后修改了其字体大小和颜色。
5. 高级技巧:多行图例标题
有时,你可能需要创建多行的图例标题。这可以通过在标题文本中使用换行符来实现。
import matplotlib.pyplot as plt

fig, ax = plt.subplots(figsize=(8, 6))
ax.plot([1, 2, 3, 4], [1, 4, 2, 3], label='Line 1')
ax.plot([1, 2, 3, 4], [2, 3, 4, 1], label='Line 2')

ax.legend(title='Data from\nhow2matplotlib.com')
ax.set_title('Plot with Multi-line Legend Title')
ax.set_xlabel('X-axis')
ax.set_ylabel('Y-axis')

plt.show()
Output:
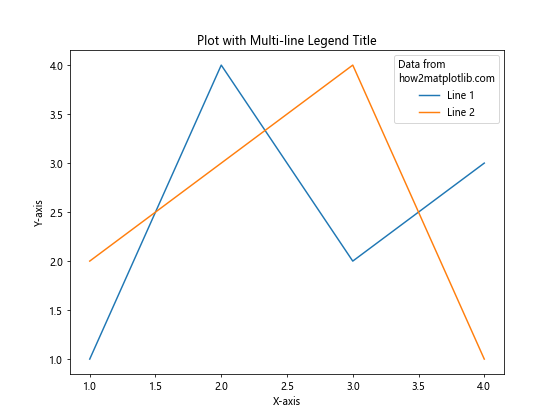
在这个例子中,我们在图例标题中使用了\n来创建一个换行,从而生成了一个两行的标题。
6. 使用自定义文本作为图例标题
如果你需要更复杂的图例标题,例如包含特殊字符或数学公式,你可以使用matplotlib.text.Text对象作为图例标题。
import matplotlib.pyplot as plt
from matplotlib.text import Text

fig, ax = plt.subplots(figsize=(8, 6))
ax.plot([1, 2, 3, 4], [1, 4, 2, 3], label='Line 1')
ax.plot([1, 2, 3, 4], [2, 3, 4, 1], label='Line 2')

title = Text(0, 0, 'Data from \\alpha to \\omega\nhow2matplotlib.com',
             fontsize=12, fontweight='bold')
legend = ax.legend(title=title)

ax.set_title('Plot with Custom Text as Legend Title')
ax.set_xlabel('X-axis')
ax.set_ylabel('Y-axis')

plt.show()
在这个例子中,我们创建了一个包含数学符号的自定义文本对象作为图例标题。
7. 在图例中使用多列和多行
当你有多个数据系列时,可能需要使用多列或多行的图例布局。在这种情况下,添加图例标题需要特别注意。
7.1 多列图例
import matplotlib.pyplot as plt

fig, ax = plt.subplots(figsize=(10, 6))
for i in range(5):
    ax.plot([1, 2, 3, 4], [i, i+1, i+2, i+3], label=f'Line {i+1}')

ax.legend(title='Data from how2matplotlib.com', ncol=3)
ax.set_title('Plot with Multi-column Legend')
ax.set_xlabel('X-axis')
ax.set_ylabel('Y-axis')

plt.show()
Output:
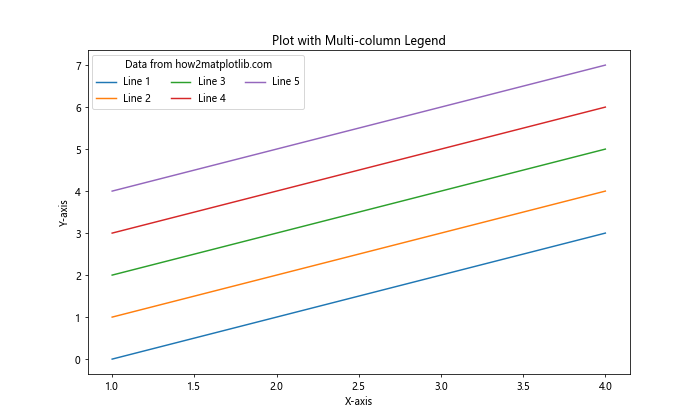
在这个例子中,我们创建了5条线,并使用ncol=3参数将图例排列成3列。
7.2 多行图例
import matplotlib.pyplot as plt

fig, ax = plt.subplots(figsize=(8, 8))
for i in range(10):
    ax.plot([1, 2, 3, 4], [i, i+1, i+2, i+3], label=f'Line {i+1}')

ax.legend(title='Data from how2matplotlib.com',
          loc='center left',
          bbox_to_anchor=(1, 0.5))
ax.set_title('Plot with Multi-row Legend')
ax.set_xlabel('X-axis')
ax.set_ylabel('Y-axis')

plt.tight_layout()
plt.show()
Output:
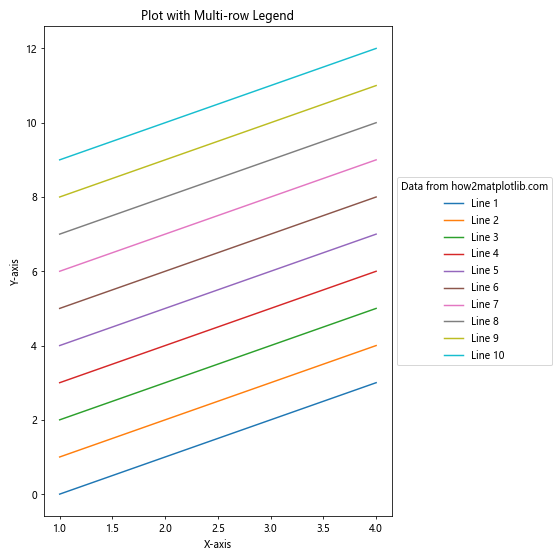
在这个例子中,我们创建了10条线,并将图例放置在图表的右侧。图例会自动调整为多行布局。
8. 在3D图中添加图例标题
Matplotlib也支持3D图表,在3D图中添加带标题的图例的方法与2D图类似。
import matplotlib.pyplot as plt
from mpl_toolkits.mplot3d import Axes3D
import numpy as np

fig = plt.figure(figsize=(10, 8))
ax = fig.add_subplot(111, projection='3d')

# 创建一些示例数据
t = np.linspace(0, 20, 100)
x = np.sin(t)
y = np.cos(t)
z = t

ax.plot(x, y, z, label='3D curve')
ax.scatter(x[::10], y[::10], z[::10], c='r', marker='o', s=50, label='Points')

ax.legend(title='Data from how2matplotlib.com')
ax.set_title('3D Plot with Legend Title')
ax.set_xlabel('X-axis')
ax.set_ylabel('Y-axis')
ax.set_zlabel('Z-axis')

plt.show()
Output:
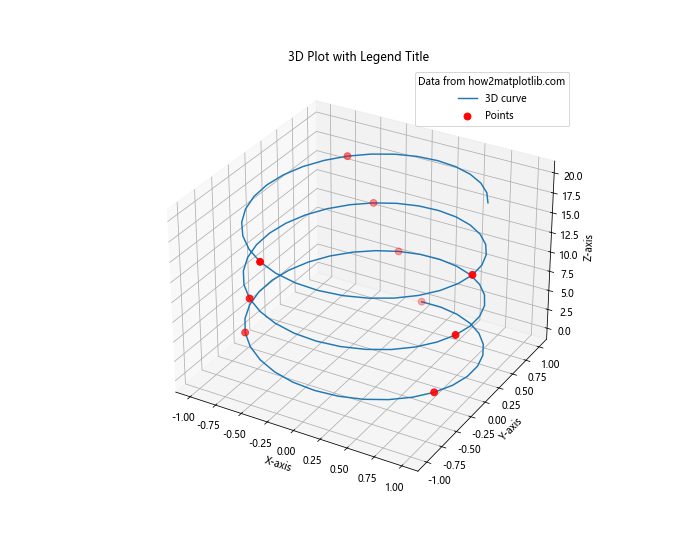
在这个例子中,我们创建了一个3D图表,包含一条曲线和一些散点。我们使用与2D图相同的方法添加了图例和图例标题。
9. 处理多个图例
有时,你可能需要在一个图表中使用多个图例。在这种情况下,为每个图例添加标题需要特别注意。
import matplotlib.pyplot as plt

fig, ax = plt.subplots(figsize=(10, 6))

# 第一组数据
line1, = ax.plot([1, 2, 3, 4], [1, 4, 2, 3], label='Line 1')
line2, = ax.plot([1, 2, 3, 4], [2, 3, 4, 1], label='Line 2')

# 第二组数据
scatter1 = ax.scatter([1.5, 2.5, 3.5], [2, 3, 2], c='r', label='Points 1')
scatter2 = ax.scatter([1.5, 2.5, 3.5], [3, 2, 3], c='g', label='Points 2')

# 创建两个图例
legend1 = ax.legend(handles=[line1, line2], loc='upper left', title='Lines from how2matplotlib.com')
ax.add_artist(legend1)  # 将第一个图例添加到图表中

legend2 = ax.legend(handles=[scatter1, scatter2], loc='lower right', title='Points from how2matplotlib.com')

ax.set_title('Plot with Multiple Legends')
ax.set_xlabel('X-axis')
ax.set_ylabel('Y-axis')

plt.show()
Output:
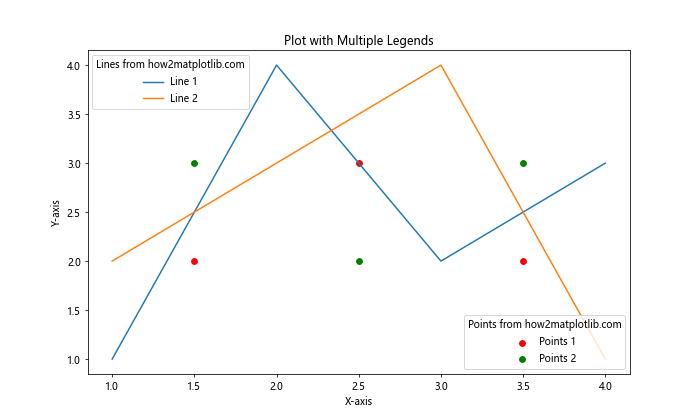
在这个例子中,我们创建了两个图例,每个图例都有自己的标题。我们使用ax.add_artist()方法来确保两个图例都能显示。
10. 使用HTML样式的图例标题
Matplotlib支持在文本中使用有限的HTML样式。这可以用来创建更复杂的图例标题。
import matplotlib.pyplot as plt

fig, ax = plt.subplots(figsize=(8, 6))
ax.plot([1, 2, 3, 4], [1, 4, 2, 3], label='Line 1')
ax.plot([1, 2, 3, 4], [2, 3, 4, 1], label='Line 2')

title = '<b>Bold</b> and <i>Italic</i>\n<font color="red">how2matplotlib.com</font>'
ax.legend(title=title, title_fontsize=12)

ax.set_title('Plot with HTML-style Legend Title')
ax.set_xlabel('X-axis')
ax.set_ylabel('Y-axis')

plt.show()
Output:
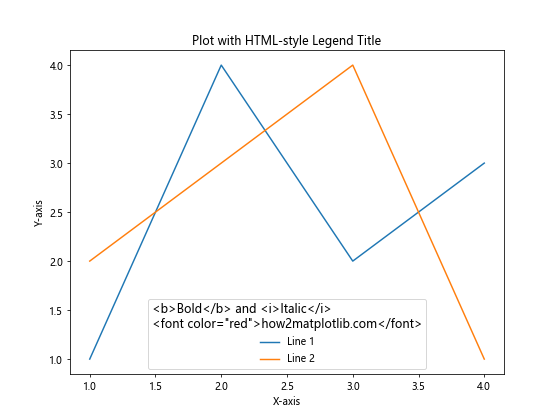
在这个例子中,我们使用HTML样式标签来创建一个包含粗体、斜体和彩色文本的图例标题。
11. 动态更新图例标题
在某些情况下,你可能需要根据数据动态更新图例标题。这可以通过在绘图循环中更新图例来实现。
import matplotlib.pyplot as plt
import numpy as np

fig, ax = plt.subplots(figsize=(8, 6))
line, = ax.plot([], [], label='Dynamic Data')
ax.set_xlim(0, 10)
ax.set_ylim(0, 10)

legend = ax.legend(title='Initial Title')

for i in range(5):
    new_data = np.random.rand(10)
    line.set_ydata(new_data)
    line.set_xdata(range(10))

    # 更新图例标题
    new_title = f'Data {i+1} from how2matplotlib.com'
    legend.set_title(new_title)

    plt.pause(1)

plt.show()
Output:

这个例子展示了如何在一个简单的动画中动态更新图例标题。
12. 使用自定义图例
有时,标准的图例可能无法满足你的需求。在这种情况下,你可以创建一个自定义图例。
import matplotlib.pyplot as plt
import matplotlib.patches as patches

fig, ax = plt.subplots(figsize=(10, 6))

# 绘制一些数据
ax.plot([1, 2, 3, 4], [1, 4, 2, 3], 'b-')
ax.plot([1, 2, 3, 4], [2, 3, 4, 1], 'r--')

# 创建自定义图例
legend_elements = [
    patches.Rectangle((0, 0), 1, 1, facecolor='b', edgecolor='none', label='Blue Line'),
    patches.Rectangle((0, 0), 1, 1, facecolor='r', edgecolor='none', label='Red Line'),
]

# 添加自定义图例
legend = ax.legend(handles=legend_elements, loc='upper right')

# 添加图例标题
legend.set_title('Custom Legend\nfrom how2matplotlib.com')

ax.set_title('Plot with Custom Legend')
ax.set_xlabel('X-axis')
ax.set_ylabel('Y-axis')

plt.show()
Output:
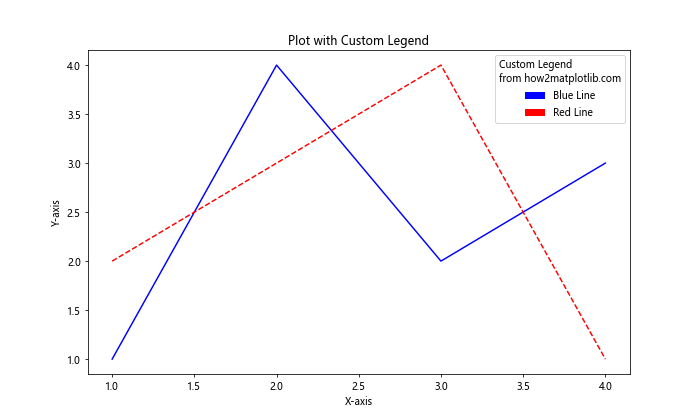
在这个例子中,我们创建了一个自定义图例,使用矩形来表示线条,并为其添加了一个标题。
13. 在极坐标图中添加图例标题
Matplotlib也支持极坐标图,在极坐标图中添加带标题的图例的方法与笛卡尔坐标系类似。
import matplotlib.pyplot as plt
import numpy as np

fig, ax = plt.subplots(figsize=(8, 8), subplot_kw=dict(projection='polar'))

r = np.arange(0, 2, 0.01)
theta1 = 2 * np.pi * r
theta2 = 4 * np.pi * r

ax.plot(theta1, r, label='Spiral 1')
ax.plot(theta2, r, label='Spiral 2')

ax.legend(title='Spirals from how2matplotlib.com')
ax.set_title('Polar Plot with Legend Title')

plt.show()
Output:
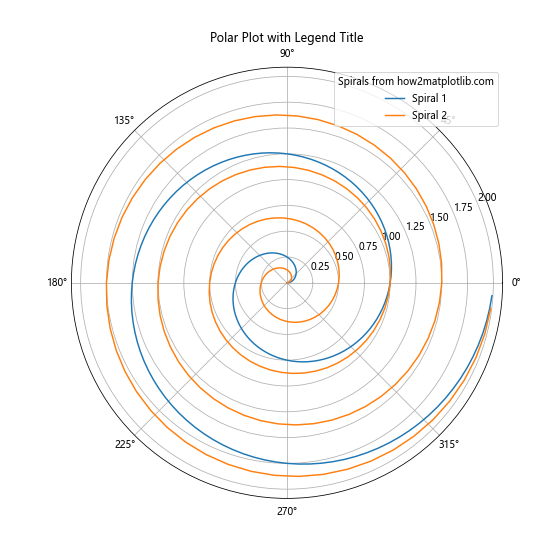
这个例子展示了如何在极坐标图中添加带标题的图例。
14. 在颜色条图例中添加标题
对于使用颜色映射的图表,我们通常会使用颜色条(colorbar)作为图例。我们也可以为颜色条添加标题。
import matplotlib.pyplot as plt
import numpy as np

fig, ax = plt.subplots(figsize=(8, 6))

# 创建一个示例热图
data = np.random.rand(10, 10)
im = ax.imshow(data, cmap='viridis')

# 添加颜色条
cbar = fig.colorbar(im)

# 为颜色条添加标题
cbar.set_label('Values from how2matplotlib.com', rotation=270, labelpad=15)

ax.set_title('Heatmap with Colorbar Title')

plt.show()
Output:
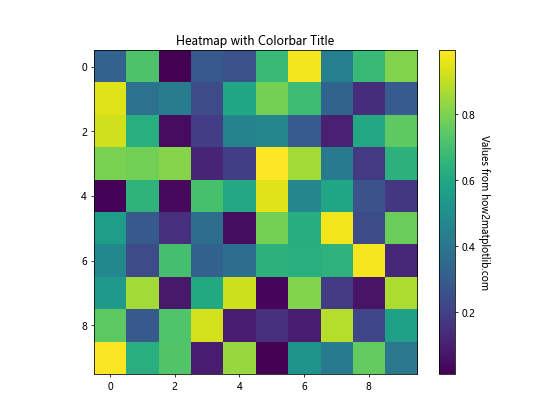
在这个例子中,我们创建了一个热图,并为其颜色条添加了一个标题。
15. 结合图例标题和图表标题
有时,你可能想要将图例标题与图表的主标题结合起来,以创建一个更具描述性的标题。
import matplotlib.pyplot as plt

fig, ax = plt.subplots(figsize=(8, 6))
ax.plot([1, 2, 3, 4], [1, 4, 2, 3], label='Line 1')
ax.plot([1, 2, 3, 4], [2, 3, 4, 1], label='Line 2')

legend = ax.legend(title='Data Series')
plt.suptitle('Main Title', fontsize=16)
plt.title('Subtitle: ' + legend.get_title().get_text() + ' from how2matplotlib.com', fontsize=10)

ax.set_xlabel('X-axis')
ax.set_ylabel('Y-axis')

plt.show()
Output:
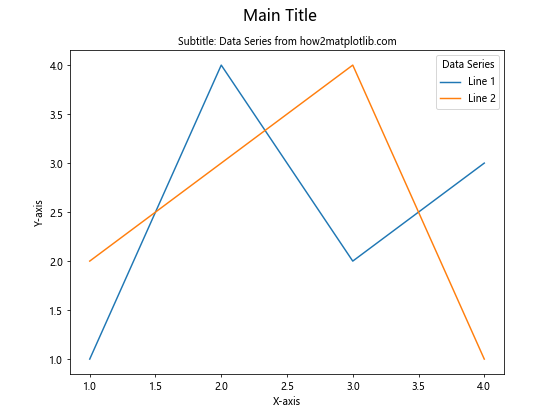
在这个例子中,我们使用plt.suptitle()添加了一个主标题,并使用plt.title()添加了一个包含图例标题内容的副标题。
结论
在Matplotlib中添加图例标题是一个强大的工具,可以帮助你创建更具信息性和专业性的图表。通过本文介绍的各种方法和技巧,你应该能够在各种情况下为你的图例添加合适的标题。记住,好的图例标题应该简洁明了,并为读者提供有价值的额外信息。
在实际应用中,你可能需要根据具体的数据和图表类型来选择最合适的方法。不要忘记实验不同的样式和位置,以找到最适合你的数据展示需求的方案。同时,始终考虑你的目标受众,确保你的图例和标题对他们来说是清晰和有意义的。
最后,随着你在数据可视化方面技能的提升,你会发现Matplotlib提供了更多高级功能,可以进一步增强你的图表。继续探索和学习,你将能够创建出更加令人印象深刻和富有洞察力的数据可视化作品。
 极客教程
极客教程