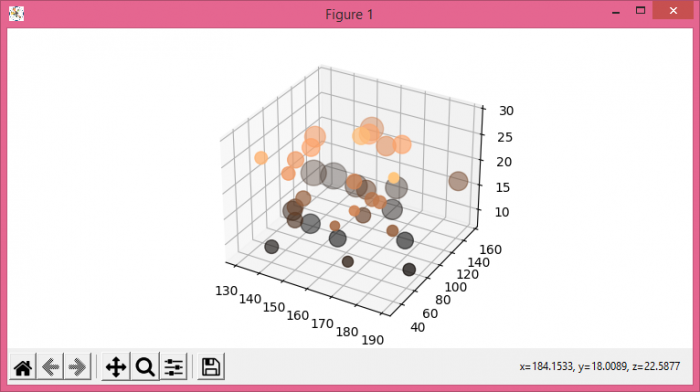
在Matplotlib中绘制具有不同标记大小的3D投影散点图
要在3D投影中绘制散点图,并且标记大小不同,可以执行以下步骤.
- 设置图的大小并调整子图之间和周围的填充。
- 使用numpy创建xs,ys和zs数据点.
- 初始化一个变量“s”以获取标记的不同大小。
- 创建一个图或激活现有图使用 figure() 方法。
- 使用 subplots() 方法将一个轴添加到当前图中,作为子图的安排。
- 使用 scatter() 方法绘制xs,ys和zs数据点。
- 使用 show() 方法来显示图像。
例子
import numpy as np
from matplotlib import pyplot as plt
plt.rcParams["figure.figsize"] = [7.50, 3.50]
plt.rcParams["figure.autolayout"] = True
xs = np.random.randint(low=8, high=30, size=35)
ys = np.random.randint(130, 195, 35)
zs = np.random.randint(30, 160, 35)
s = zs / ((ys * 0.01) ** 2)
fig = plt.figure()
ax = fig.add_subplot(111, projection='3d')
ax.scatter(ys, zs, xs, s=s * 5, c=xs, cmap='copper')
plt.show()
输出

 极客教程
极客教程