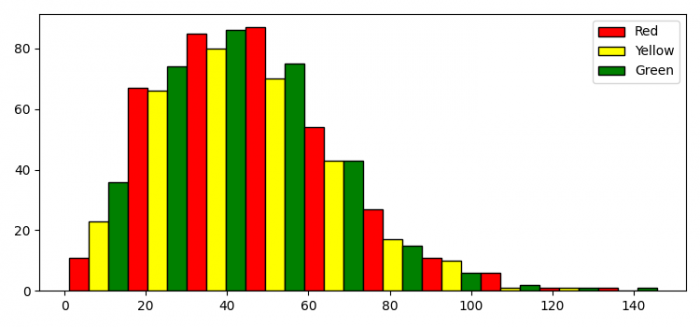
Matplotlib多个图例条目的直方图
要制作带有多个图例条目的直方图,我们可以执行以下步骤 –
- 设置图形大小并调整子图之间和周围的填充。
- 使用numpy创建随机数据。
- 使用 hist() 方法绘制直方图。
- 创建一个颜色列表以为每个补丁面着色。
- 迭代补丁并设置每个补丁的填充颜色。
- 创建一个处理程序列表以放置图例。
- 使用 legend() 方法进行多个图例条目的设置。
- 使用 show() 方法显示图形。
示例
import matplotlib.pyplot as plt
import numpy as np
from matplotlib.patches import Rectangle

plt.rcParams["figure.figsize"] = [7.50, 3.50]
plt.rcParams["figure.autolayout"] = True

data = np.random.rayleigh(size=1000) * 35
N, bins, patches = plt.hist(data, 30, ec="k")
colors = ["red", "yellow", "green"]

for i in range(0, len(bins)-1):
patches[i].set_facecolor(colors[i % len(colors)])

handles = [Rectangle((0, 0), 1, 1, color=c, ec="k") for c in colors]
labels = ["Red", "Yellow", "Green"]
plt.legend(handles, labels)

plt.show()
输出

 极客教程
极客教程