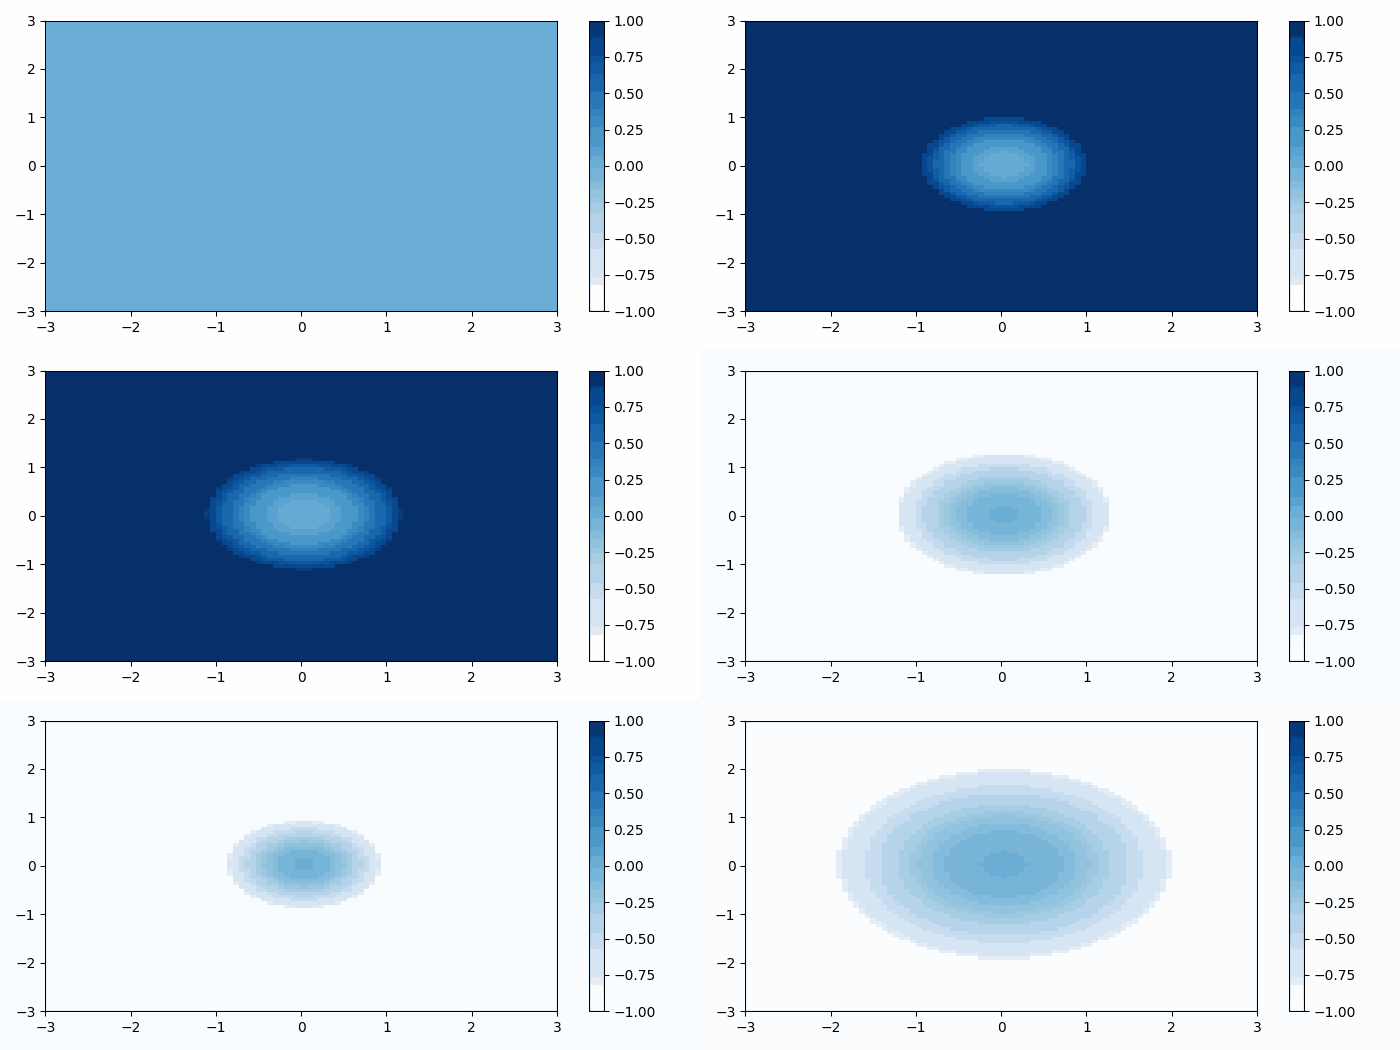
如何在Matplotlib中制作pcolormesh动画?
要在matplotlib中制作动画,请执行以下步骤:
- 创建一个带有一组子图的图形。
-
使用 numpy 创建x、y和t数据点。
-
使用meshgrid从坐标向量返回坐标矩阵创建 X3 、 Y3 和 T3 。
-
使用 pcolormesh() 方法使用非正则矩形网格创建伪彩色图。
-
使用 colormesh 轴创建一个colorbar。
-
使用 Animation() 类方法来制作动画。
-
使用 show() 方法来显示图形。
示例
import numpy as np
from matplotlib import pyplot as plt, animation
plt.rcParams["figure.figsize"] = [7.00, 3.50]
plt.rcParams["figure.autolayout"] = True

fig, ax = plt.subplots()
x = np.linspace(-3, 3, 91)
t = np.linspace(0, 25, 30)
y = np.linspace(-3, 3, 91)
X3, Y3, T3 = np.meshgrid(x, y, t)
sinT3 = np.sin(2 * np.pi * T3 / T3.max(axis=2)[..., np.newaxis])
G = (X3 ** 2 + Y3 ** 2) * sinT3
cax = ax.pcolormesh(x, y, G[:-1, :-1, 0], vmin=-1, vmax=1, cmap='Blues')
fig.colorbar(cax)

def animate(i):
    cax.set_array(G[:-1, :-1, i].flatten())

anim = animation.FuncAnimation(fig, animate, interval=100, frames=len(t) - 1)
anim.save('517.gif')
plt.show()
输出

 极客教程
极客教程