如何在Matplotlib中制作线图动画?
要在Matplotlib中制作线图动画,我们可以按照以下步骤进行。
- 使用 subplots() 方法创建一个图形和一组子图。
-
限制x轴和y轴的比例尺。
-
使用numpy创建x和t数据点。
-
从坐标向量X2和T2返回坐标矩阵。
-
使用 plot() 方法使用x和F数据点绘制一条线。
-
为了制作动画,更新y数据。
-
通过重复调用函数 func,current fig, animate, 和 interval 制作动画。
-
使用 show() 方法显示图形。
示例
import numpy as np
from matplotlib import pyplot as plt, animation
plt.rcParams ["figure.figsize"] = [7.00, 3.50]
plt.rcParams ["figure.autolayout"] = True
fig, ax = plt.subplots()
ax.set (xlim = (-3, 3), ylim = (-1, 1))
x = np.linspace (-3, 3, 91)
t = np.linspace (1, 25, 30)
X2,T2 = np.meshgrid (x,t)
sinT2 = np.sin (2 * np.pi * T2 / T2.max())
F = 0.9 * sinT2 * np.sinc (X2 * (1 + sinT2))
line,= ax.plot (x,F [0,:],color ='k',lw = 2)
def animate(i):
    line.set_ydata (F [i,:])
anim = animation.FuncAnimation (fig, animate,interval = 100,frames = len (t) -1)
anim.save ('503.gif')
plt.show()
输出
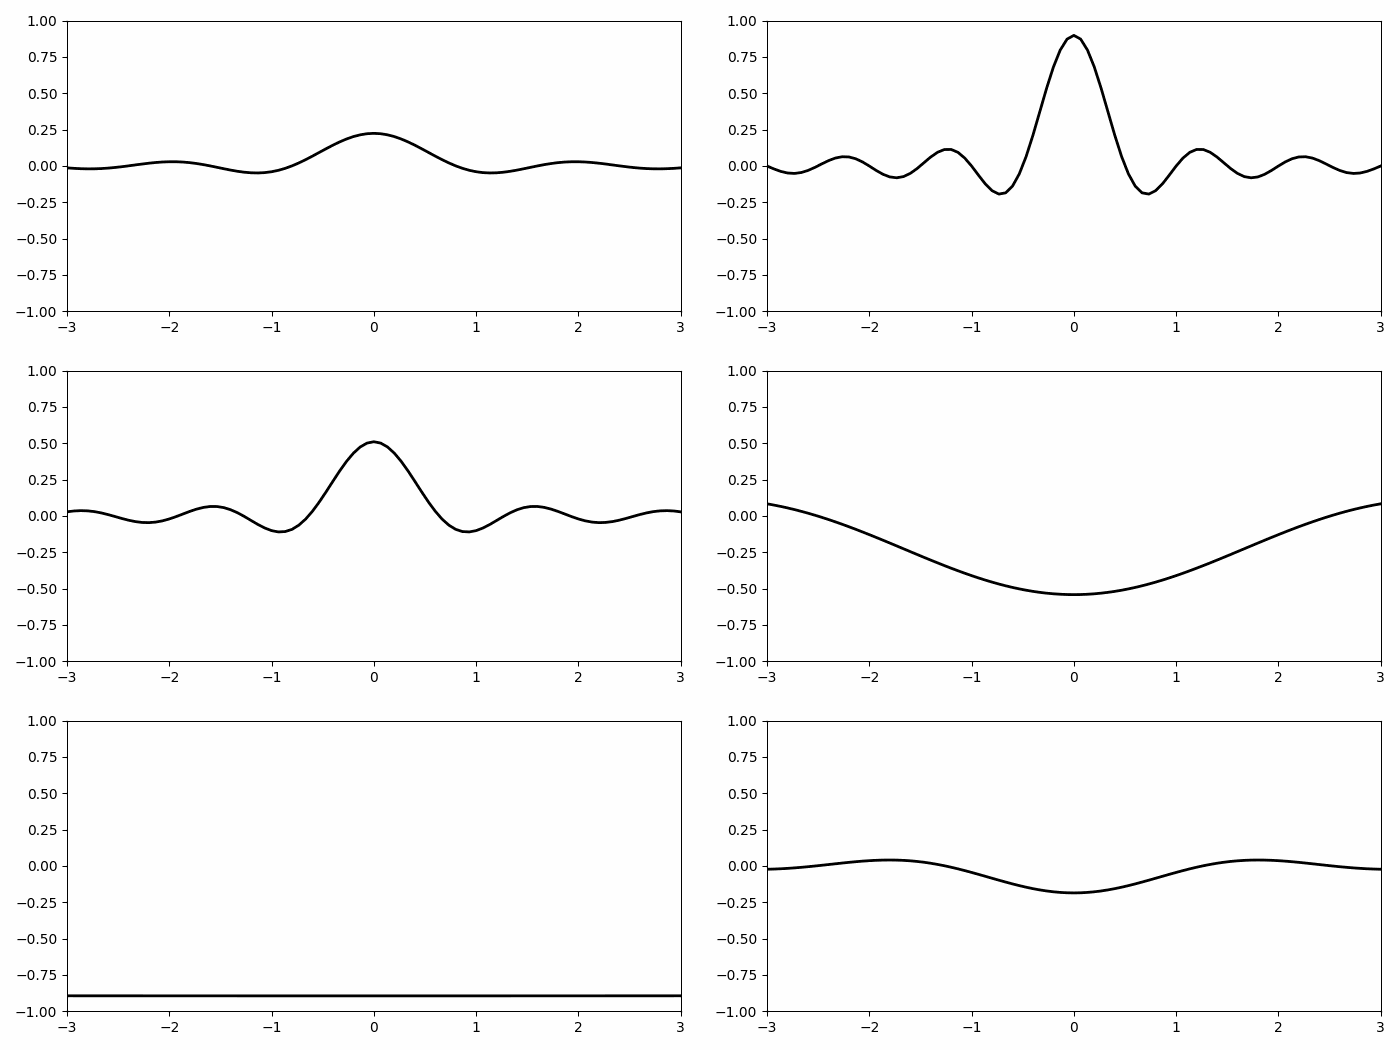
当我们执行此代码时,它将显示具有动画的线图。

 极客教程
极客教程