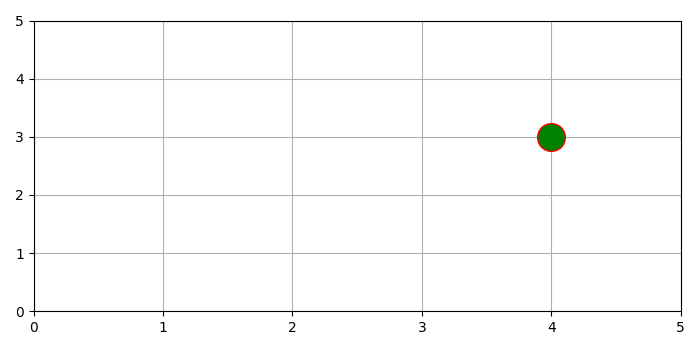
如何在Matplotlib Python中绘制单个数据点?
要在matplotlib中绘制单个数据点,我们可以执行以下操作 –
- 用一个值初始化x和y的列表。
-
将X和Y轴的范围限制在0到5之间。
-
在当前线型上放置一个网格。
-
使用plot()方法绘制x和y,参数为 marker=”o”,markeredgecolor=”red”,markerfacecolor=”green” 。
-
使用 show() 方法显示图形。
示例
from matplotlib import pyplot as plt
plt.rcParams["figure.figsize"] = [7.00, 3.50]
plt.rcParams["figure.autolayout"] = True
x = [4]
y = [3]
plt.xlim(0, 5)
plt.ylim(0, 5)
plt.grid()
plt.plot(x, y, marker="o", markersize=20, markeredgecolor="red", markerfacecolor="green")
plt.show()
输出

 极客教程
极客教程