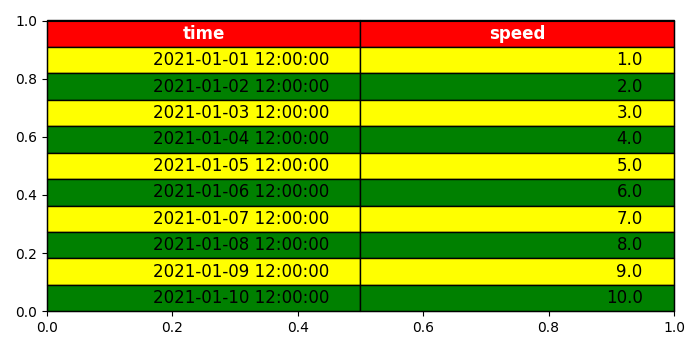
如何在Matplotlib中添加一张表?
步骤
- 使用 subplots() 方法,创建一个大小为(7,7)的figure和一组subplots。
-
使用两个关键词 time 和 speed 创建一个数据框。
-
获取数组的大小。
-
使用 table 方法将一个表添加到当前axis中。
-
缩小字体大小直到文本适合单元格宽度。
-
在表格中设置字体大小。
-
通过迭代Matplotlib表格来设置面颜色 ,纹理颜色 和 文本颜色 。
-
保存并显示figure。
示例
import numpy as np
import pandas as pd
from matplotlib import pyplot as plt
plt.rcParams["figure.figsize"] = [7.00, 3.50]
plt.rcParams["figure.autolayout"] = True
fig, ax = plt.subplots()
df = pd.DataFrame(dict(time=list(pd.date_range("2021-01-01 12:00:00",
periods=10)), speed=np.linspace(1, 10, 10)))
size = (np.array(df.shape[::-1]) + np.array([0, 1])) * np.array([3.0, 6.0])
mpl_table = ax.table(cellText=df.values, bbox=[0, 0, 1, 1], colLabels=df.columns)
mpl_table.auto_set_font_size(False)
mpl_table.set_fontsize(12)
for k, cell in mpl_table._cells.items():
    cell.set_edgecolor('black')
    if k[0] == 0 or k[1] < 0:
        cell.set_text_props(weight='bold', color='w')
        cell.set_facecolor('red')
    else:
        cell.set_facecolor(['green', 'yellow'][k[0] % 2])
plt.show()
输出

 极客教程
极客教程