subplot spacing matplotlib
在matplotlib中,subplot指的是将图形区域划分为若干个子图来显示不同的数据。在subplot中,可以设置子图之间的间距,使得图形更加美观和易读。本文将介绍如何在matplotlib中调整子图的间距。
调整子图间距
在matplotlib中,可以通过使用subplot_adjust()方法来调整子图之间的间距。subplot_adjust()方法接受四个参数:左边距、底边距、右边距和顶边距。这四个参数的取值范围都是[0, 1],分别表示子图左边界、底边界、右边界和顶边界的占比,取值越大间距越大。
示例代码如下:
import matplotlib.pyplot as plt

plt.subplot(221)
plt.subplot(222)
plt.subplot(223)
plt.subplot(224)
plt.subplots_adjust(left=0.1, bottom=0.1, right=0.9, top=0.9)
plt.show()
Output:
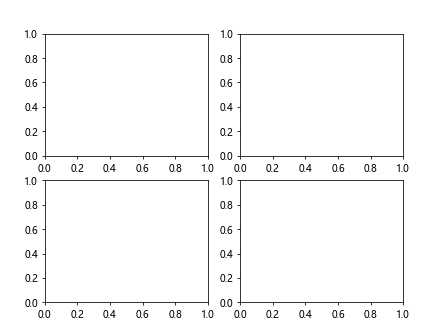
在上面的示例中,我们创建了一个2×2的子图,然后使用subplots_adjust()方法设置了子图之间的间距,左边距和底边距为0.1,右边距和顶边距为0.9。
调整子图之间的水平间距和垂直间距
除了可以通过subplots_adjust()方法来调整子图之间的间距外,还可以通过使用gridspec来进行更加精细的设置。gridspec可以帮助我们在子图之间设置水平和垂直间距。
示例代码如下:
import matplotlib.pyplot as plt
import matplotlib.gridspec as gridspec

fig = plt.figure()
gs = gridspec.GridSpec(2, 2, wspace=0.5, hspace=0.2)

ax1 = plt.subplot(gs[0, 0])
ax2 = plt.subplot(gs[0, 1])
ax3 = plt.subplot(gs[1, :])

plt.show()
Output:
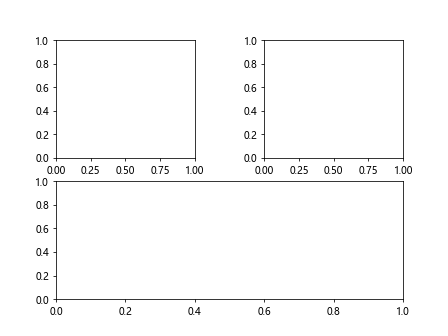
在上面的示例中,我们创建了一个2×2的图形,然后使用GridSpec来设置了子图之间的水平间距和垂直间距,wspace=0.5表示水平间距为0.5,hspace=0.2表示垂直间距为0.2。
调整子图之间的高度和宽度比例
在matplotlib中,除了可以调整子图之间的间距外,还可以通过使用GridSpec来调整子图之间的高度和宽度比例。这样可以使得不同子图的大小更加灵活。
示例代码如下:
import matplotlib.pyplot as plt
import matplotlib.gridspec as gridspec

fig = plt.figure()
gs = gridspec.GridSpec(2, 2, height_ratios=[1, 2], width_ratios=[2, 1])

ax1 = plt.subplot(gs[0, 0])
ax2 = plt.subplot(gs[0, 1])
ax3 = plt.subplot(gs[1, :])

plt.show()
Output:
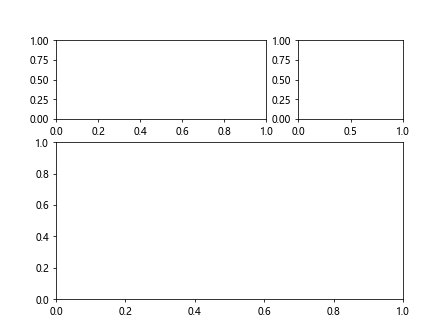
在上面的示例中,我们创建了一个2×2的图形,然后使用GridSpec来设置了子图之间的高度比例和宽度比例,height_ratios=[1, 2]表示第一行的高度为第二行的两倍,width_ratios=[2, 1]表示第一列的宽度为第二列的两倍。
调整子图的尺寸
在matplotlib中,可以通过使用subplots()方法来调整子图的尺寸。subplots()方法接受两个参数:行数和列数,可以设置子图的数量和排列方式。
示例代码如下:
import matplotlib.pyplot as plt

fig, axs = plt.subplots(2, 2, figsize=(10, 6))

plt.show()
Output:
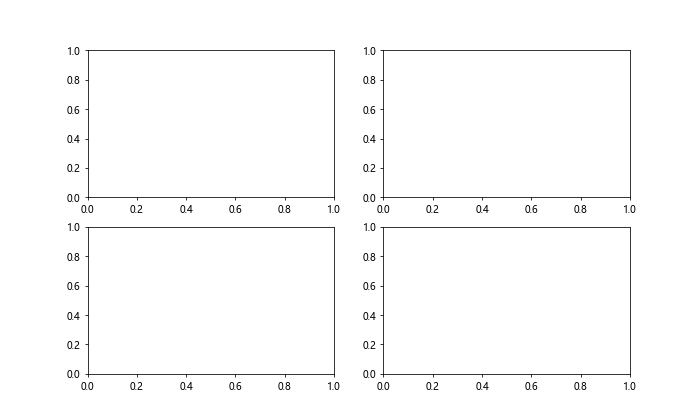
在上面的示例中,我们创建了一个2×2的子图,设置了子图的尺寸为(10, 6)。
使用subplot2grid()
除了可以使用subplots()方法来创建子图外,还可以使用subplot2grid()方法来更加灵活地设置子图的位置和大小。
示例代码如下:
import matplotlib.pyplot as plt

plt.subplot2grid((3, 3), (0, 0), colspan=3)
plt.subplot2grid((3, 3), (1, 0), colspan=2)
plt.subplot2grid((3, 3), (1, 2), rowspan=2)
plt.subplot2grid((3, 3), (2, 0))

plt.show()
Output:
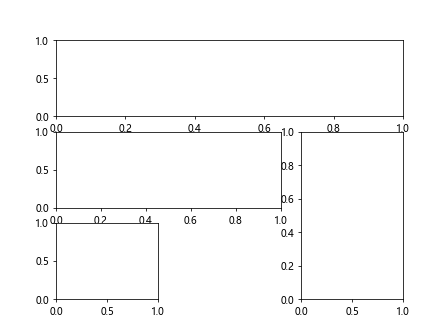
在上面的示例中,我们使用subplot2grid()方法创建了一个3×3的子图,然后设置了每个子图的位置和大小。
调整坐标轴标签的位置
在matplotlib中,可以通过使用set_label_pos()方法来调整坐标轴标签的位置。
示例代码如下:
import matplotlib.pyplot as plt

ax = plt.gca()
ax.xaxis.set_label_position('top')
ax.yaxis.set_label_position('right')

plt.show()
Output:
在上面的示例中,我们设置了坐标轴标签的位置,x轴的标签位置为顶部,y轴的标签位置为右侧。
调整坐标轴标签的旋转角度
在matplotlib中,可以通过使用set_rotation()方法来调整坐标轴标签的旋转角度。
示例代码如下:
import matplotlib.pyplot as plt

ax = plt.gca()
ax.xaxis.set_tick_params(rotation=45)
ax.yaxis.set_tick_params(rotation=90)

plt.show()
Output:
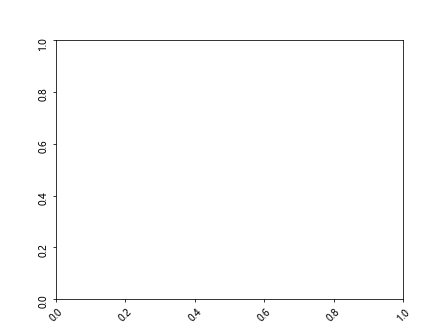
在上面的示例中,我们设置了坐标轴标签的旋转角度,x轴标签旋转角度为45度,y轴标签旋转角度为90度。
调整子图之间的边框
在matplotlib中,可以通过使用set_frame_on()方法来调整子图之间的边框。
示例代码如下:
import matplotlib.pyplot as plt

ax = plt.gca()
ax.set_frame_on(False)

plt.show()
Output:
在上面的示例中,我们设置了子图之间的边框为False,表示没有边框。
调整子图的背景色
在matplotlib中,可以通过使用set_facecolor()方法来调整子图的背景色。
示例代码如下:
import matplotlib.pyplot as plt

ax = plt.gca()
ax.set_facecolor('lightgrey')

plt.show()
Output:
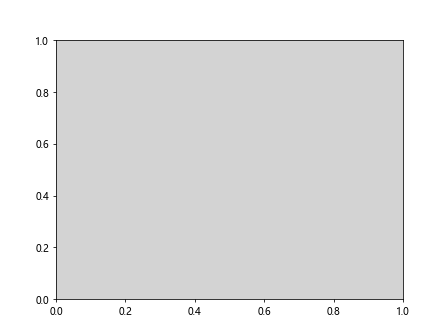
在上面的示例中,我们设置了子图的背景色为浅灰色。
调整子图的边框颜色
在matplotlib中,可以通过使用set_edgecolor()方法来调整子图的边框颜色。
示例代码如下:
import matplotlib.pyplot as plt

ax = plt.gca()
ax.set_edgecolor('red')

plt.show()
在上面的示例中,我们设置了子图的边框颜色为红色。
调整子图的透明度
在matplotlib中,可以通过使用set_alpha()方法来
import matplotlib.pyplot as plt

ax = plt.gca()
ax.set_alpha(0.5)

plt.show()
Output:
在上面的示例中,我们设置了子图的透明度为0.5,表示半透明。
设置整个图形的背景颜色
在matplotlib中,可以通过使用set_facecolor()方法来设置整个图形的背景颜色。
示例代码如下:
import matplotlib.pyplot as plt

fig = plt.gcf()
fig.set_facecolor('lightyellow')

plt.show()
Output:

在上面的示例中,我们设置了整个图形的背景色为浅黄色。
设置整个图形的边框颜色
在matplotlib中,可以通过使用set_edgecolor()方法来设置整个图形的边框颜色。
示例代码如下:
import matplotlib.pyplot as plt

fig = plt.gcf()
fig.set_edgecolor('blue')

plt.show()
Output:

在上面的示例中,我们设置了整个图形的边框颜色为蓝色。
调整图形的尺寸
在matplotlib中,可以通过使用set_size_inches()方法来调整整个图形的尺寸。
示例代码如下:
import matplotlib.pyplot as plt

fig = plt.gcf()
fig.set_size_inches(8, 4)

plt.show()
Output:

在上面的示例中,我们设置了整个图形的尺寸为(8, 4)。
通过本文的介绍,我们学习了如何在matplotlib中调整子图之间的间距、高度和宽度比例,以及如何调整子图的尺寸、坐标轴标签、边框等属性,使得图形更加美观和易读。
 极客教程
极客教程