Matplotlib中如何在条形图中设置不同颜色的误差线
参考:Setting Different error bar colors in bar plot in Matplotlib
Matplotlib是Python中最流行的数据可视化库之一,它提供了丰富的绘图功能,包括条形图和误差线的绘制。在数据分析和科学研究中,我们经常需要在条形图上添加误差线来表示数据的不确定性或变异性。有时,我们可能希望为不同的条形设置不同颜色的误差线,以便更好地区分和突出显示某些数据。本文将详细介绍如何在Matplotlib中的条形图中设置不同颜色的误差线,并提供多个示例代码来说明这一过程。
1. 基础条形图和误差线
在开始设置不同颜色的误差线之前,我们先来回顾一下如何创建基本的条形图和添加误差线。
1.1 创建基本条形图
首先,让我们创建一个简单的条形图:
import matplotlib.pyplot as plt
import numpy as np

categories = ['A', 'B', 'C', 'D']
values = [3, 7, 2, 5]

plt.figure(figsize=(8, 6))
plt.bar(categories, values)
plt.title('Basic Bar Plot - how2matplotlib.com')
plt.xlabel('Categories')
plt.ylabel('Values')
plt.show()
Output:
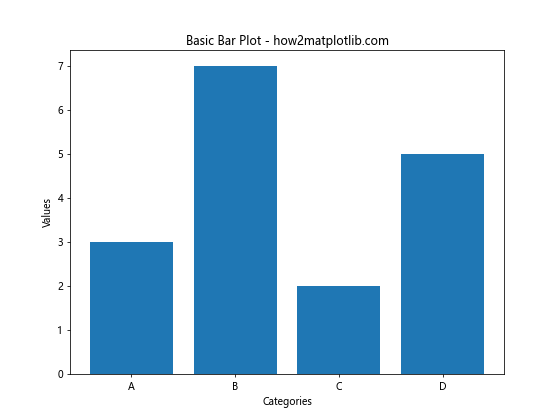
这段代码创建了一个基本的条形图,其中包含四个类别(A、B、C、D)和对应的值。我们使用plt.bar()函数来绘制条形图,并设置了图表标题、x轴标签和y轴标签。
1.2 添加误差线
接下来,我们为条形图添加误差线:
import matplotlib.pyplot as plt
import numpy as np

categories = ['A', 'B', 'C', 'D']
values = [3, 7, 2, 5]
errors = [0.5, 1.2, 0.3, 0.8]

plt.figure(figsize=(8, 6))
plt.bar(categories, values, yerr=errors, capsize=5)
plt.title('Bar Plot with Error Bars - how2matplotlib.com')
plt.xlabel('Categories')
plt.ylabel('Values')
plt.show()
Output:
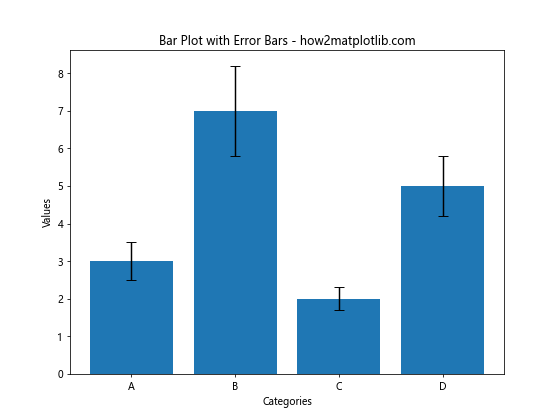
在这个例子中,我们添加了yerr参数来指定误差值,并使用capsize参数设置误差线末端的横线长度。这样,我们就得到了一个带有误差线的条形图。
2. 设置不同颜色的误差线
现在,我们来探讨如何为不同的条形设置不同颜色的误差线。有几种方法可以实现这一目标:
2.1 使用循环单独绘制每个条形和误差线
一种方法是使用循环来单独绘制每个条形和对应的误差线,这样我们可以为每个误差线设置不同的颜色:
import matplotlib.pyplot as plt
import numpy as np

categories = ['A', 'B', 'C', 'D']
values = [3, 7, 2, 5]
errors = [0.5, 1.2, 0.3, 0.8]
colors = ['red', 'green', 'blue', 'orange']

plt.figure(figsize=(8, 6))

for i in range(len(categories)):
    plt.bar(categories[i], values[i], color=colors[i])
    plt.errorbar(categories[i], values[i], yerr=errors[i], color=colors[i], capsize=5)

plt.title('Bar Plot with Different Color Error Bars - how2matplotlib.com')
plt.xlabel('Categories')
plt.ylabel('Values')
plt.show()
Output:
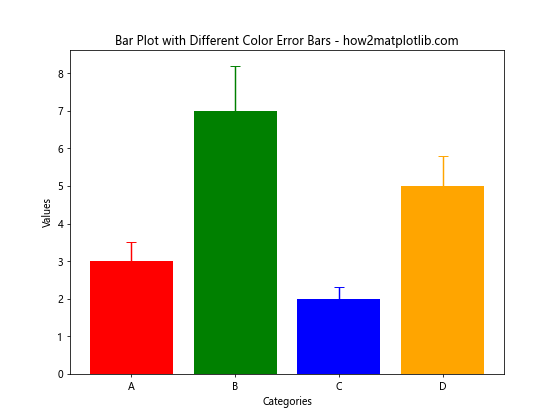
在这个例子中,我们使用循环来遍历每个类别,分别绘制条形和误差线。通过为每个条形和误差线指定相同的颜色,我们实现了不同颜色的误差线效果。
2.2 使用errorbar函数的ecolor参数
另一种方法是使用plt.errorbar()函数的ecolor参数来直接指定误差线的颜色:
import matplotlib.pyplot as plt
import numpy as np

categories = ['A', 'B', 'C', 'D']
values = [3, 7, 2, 5]
errors = [0.5, 1.2, 0.3, 0.8]
bar_colors = ['red', 'green', 'blue', 'orange']
error_colors = ['darkred', 'darkgreen', 'darkblue', 'darkorange']

plt.figure(figsize=(8, 6))
bars = plt.bar(categories, values, color=bar_colors)

for i, bar in enumerate(bars):
    plt.errorbar(bar.get_x() + bar.get_width() / 2, values[i], yerr=errors[i],
                 ecolor=error_colors[i], capsize=5, fmt='none')

plt.title('Bar Plot with Different Color Error Bars - how2matplotlib.com')
plt.xlabel('Categories')
plt.ylabel('Values')
plt.show()
Output:
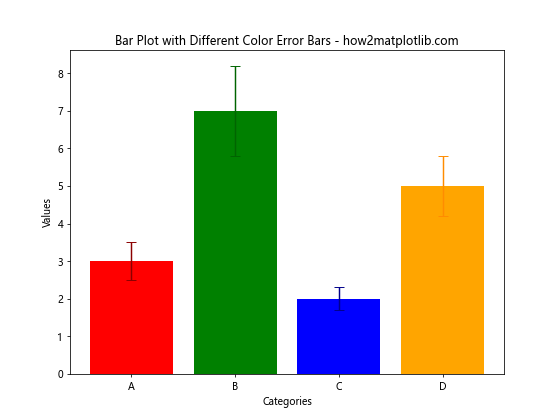
在这个例子中,我们首先使用plt.bar()绘制条形图,然后使用循环和plt.errorbar()为每个条形添加误差线。通过ecolor参数,我们可以为每个误差线指定不同的颜色。
2.3 使用条形图的边缘颜色
我们还可以利用条形图的边缘颜色来设置误差线的颜色:
import matplotlib.pyplot as plt
import numpy as np

categories = ['A', 'B', 'C', 'D']
values = [3, 7, 2, 5]
errors = [0.5, 1.2, 0.3, 0.8]
colors = ['red', 'green', 'blue', 'orange']

plt.figure(figsize=(8, 6))
plt.bar(categories, values, color=colors, edgecolor=colors, linewidth=2)
plt.errorbar(categories, values, yerr=errors, fmt='none', ecolor='black', elinewidth=1, capsize=5)

plt.title('Bar Plot with Colored Edges and Black Error Bars - how2matplotlib.com')
plt.xlabel('Categories')
plt.ylabel('Values')
plt.show()
Output:
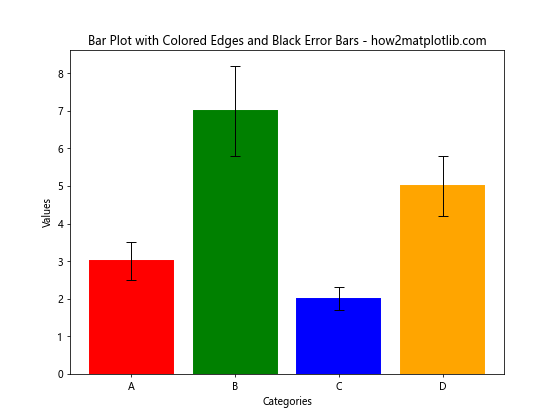
在这个例子中,我们通过设置条形图的edgecolor参数来为每个条形设置不同的边缘颜色。误差线使用统一的黑色,但由于条形的边缘颜色不同,整体效果看起来像是误差线有不同的颜色。
3. 高级技巧和注意事项
在设置不同颜色的误差线时,还有一些高级技巧和注意事项需要考虑:
3.1 使用颜色映射
我们可以使用Matplotlib的颜色映射来为误差线生成一系列渐变色:
import matplotlib.pyplot as plt
import numpy as np

categories = ['A', 'B', 'C', 'D', 'E']
values = [3, 7, 2, 5, 4]
errors = [0.5, 1.2, 0.3, 0.8, 0.6]

plt.figure(figsize=(10, 6))
bars = plt.bar(categories, values)

cmap = plt.cm.get_cmap('viridis')
colors = cmap(np.linspace(0, 1, len(categories)))

for i, bar in enumerate(bars):
    plt.errorbar(bar.get_x() + bar.get_width() / 2, values[i], yerr=errors[i],
                 ecolor=colors[i], capsize=5, fmt='none')
    bar.set_color(colors[i])

plt.title('Bar Plot with Color Mapped Error Bars - how2matplotlib.com')
plt.xlabel('Categories')
plt.ylabel('Values')
plt.colorbar(plt.cm.ScalarMappable(cmap=cmap), label='Color Scale')
plt.show()
这个例子使用了’viridis’颜色映射来为条形和误差线生成渐变色。我们还添加了一个颜色条来显示颜色映射。
3.2 处理负值
当数据包含负值时,我们需要特别注意误差线的显示:
import matplotlib.pyplot as plt
import numpy as np

categories = ['A', 'B', 'C', 'D']
values = [3, -2, 2, -1]
errors = [0.5, 0.8, 0.3, 0.4]
colors = ['red', 'green', 'blue', 'orange']

plt.figure(figsize=(8, 6))
bars = plt.bar(categories, values, color=colors)

for i, bar in enumerate(bars):
    plt.errorbar(bar.get_x() + bar.get_width() / 2, values[i], yerr=errors[i],
                 ecolor=colors[i], capsize=5, fmt='none')

plt.title('Bar Plot with Error Bars for Positive and Negative Values - how2matplotlib.com')
plt.xlabel('Categories')
plt.ylabel('Values')
plt.axhline(y=0, color='black', linestyle='-', linewidth=0.5)
plt.show()
Output:
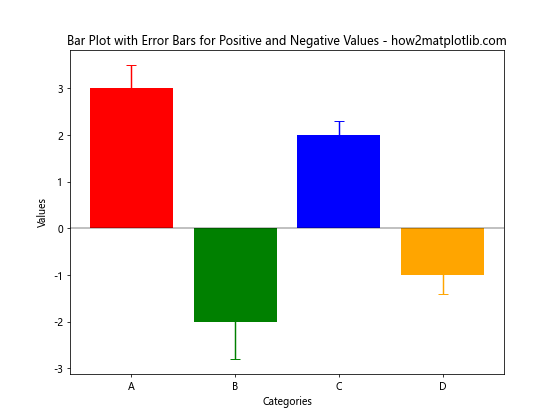
在这个例子中,我们处理了包含正值和负值的数据。我们还添加了一条水平线(y=0)来更清晰地显示正负值的分界。
3.3 使用自定义误差值
有时,我们可能需要为每个数据点设置不同的上下误差值:
import matplotlib.pyplot as plt
import numpy as np

categories = ['A', 'B', 'C', 'D']
values = [3, 7, 2, 5]
errors_lower = [0.3, 0.8, 0.2, 0.5]
errors_upper = [0.7, 1.5, 0.4, 1.0]
colors = ['red', 'green', 'blue', 'orange']

plt.figure(figsize=(8, 6))
bars = plt.bar(categories, values, color=colors)

for i, bar in enumerate(bars):
    plt.errorbar(bar.get_x() + bar.get_width() / 2, values[i],
                 yerr=[[errors_lower[i]], [errors_upper[i]]],
                 ecolor=colors[i], capsize=5, fmt='none')

plt.title('Bar Plot with Custom Error Bars - how2matplotlib.com')
plt.xlabel('Categories')
plt.ylabel('Values')
plt.show()
Output:
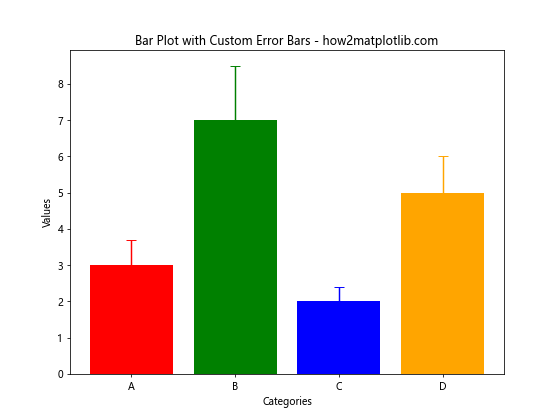
在这个例子中,我们为每个数据点设置了不同的上下误差值,使用yerr参数接受一个包含下误差和上误差的二维数组。
3.4 组合条形图中的误差线
对于组合条形图,我们可以为每组条形设置不同颜色的误差线:
import matplotlib.pyplot as plt
import numpy as np

categories = ['A', 'B', 'C', 'D']
values1 = [3, 7, 2, 5]
values2 = [2, 5, 3, 4]
errors1 = [0.5, 1.2, 0.3, 0.8]
errors2 = [0.3, 0.7, 0.4, 0.6]

x = np.arange(len(categories))
width = 0.35

fig, ax = plt.subplots(figsize=(10, 6))
rects1 = ax.bar(x - width/2, values1, width, label='Group 1', color='skyblue')
rects2 = ax.bar(x + width/2, values2, width, label='Group 2', color='lightgreen')

ax.errorbar(x - width/2, values1, yerr=errors1, fmt='none', ecolor='blue', capsize=5)
ax.errorbar(x + width/2, values2, yerr=errors2, fmt='none', ecolor='green', capsize=5)

ax.set_xlabel('Categories')
ax.set_ylabel('Values')
ax.set_title('Grouped Bar Plot with Different Color Error Bars - how2matplotlib.com')
ax.set_xticks(x)
ax.set_xticklabels(categories)
ax.legend()

plt.tight_layout()
plt.show()
Output:
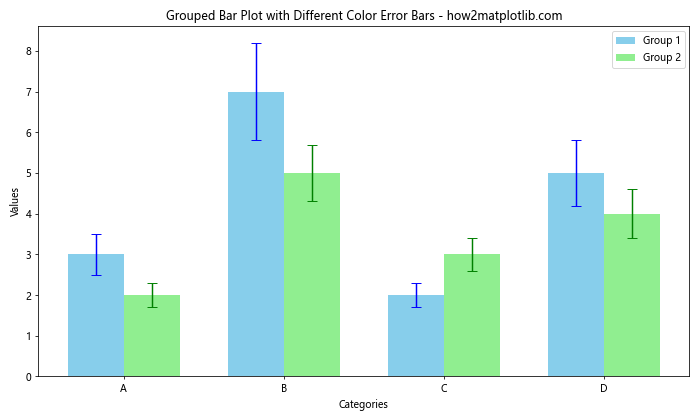
这个例子展示了如何在组合条形图中为每组条形设置不同颜色的误差线。
4. 自定义样式和格式
为了进一步提高图表的可读性和美观性,我们可以自定义误差线的样式和格式:
4.1 调整误差线宽度和样式
我们可以通过调整误差线的宽度和样式来突出显示某些数据:
import matplotlib.pyplot as plt
import numpy as np

categories = ['A', 'B', 'C', 'D']
values = [3, 7, 2, 5]
errors = [0.5, 1.2, 0.3, 0.8]
colors = ['red', 'green', 'blue', 'orange']
linewidths = [1, 2, 1, 2]
linestyles = ['-', '--', ':', '-.']

plt.figure(figsize=(8, 6))
bars = plt.bar(categories, values, color=colors)

for i, bar in enumerate(bars):
    plt.errorbar(bar.get_x() + bar.get_width() / 2, values[i], yerr=errors[i],
                 ecolor=colors[i], capsize=5, fmt='none',
                 elinewidth=linewidths[i], linestyle=linestyles[i])

plt.title('Bar Plot with Custom Error Bar Styles - how2matplotlib.com')
plt.xlabel('Categories')
plt.ylabel('Values')
plt.show()
Output:
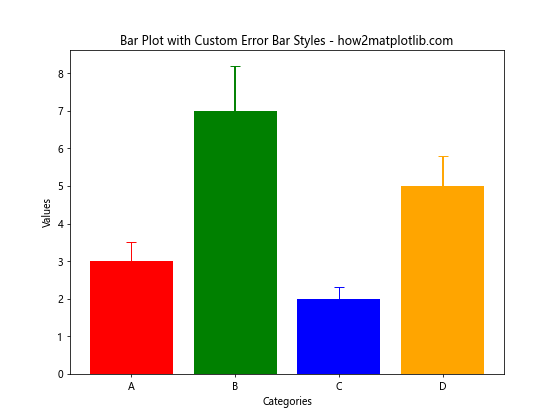
在这个例子中,我们为每个误差线设置了不同的宽度和线型,使用elinewidth参数控制线宽,使用linestyle参数控制线型。
4.2 添加误差线端点标记
我们可以为误差线添加端点标记,以增强可视化效果:
import matplotlib.pyplot as plt
import numpy as np

categories = ['A', 'B', 'C', 'D']
values = [3, 7, 2, 5]
errors = [0.5,1.2, 0.3, 0.8]
colors = ['red', 'green', 'blue', 'orange']
markers = ['o', 's', '^', 'D']

plt.figure(figsize=(8, 6))
bars = plt.bar(categories, values, color=colors)

for i, bar in enumerate(bars):
    plt.errorbar(bar.get_x() + bar.get_width() / 2, values[i], yerr=errors[i],
                 ecolor=colors[i], capsize=0, fmt='none',
                 marker=markers[i], markersize=8, markeredgecolor='black', markerfacecolor=colors[i])

plt.title('Bar Plot with Error Bars and Markers - how2matplotlib.com')
plt.xlabel('Categories')
plt.ylabel('Values')
plt.show()
Output:
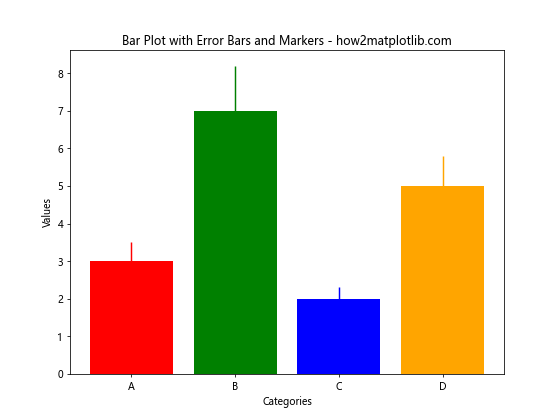
这个例子为每个误差线添加了不同的端点标记,使用marker参数指定标记形状,markersize控制标记大小,markeredgecolor和markerfacecolor分别控制标记边缘和填充颜色。
4.3 使用透明度
为了避免误差线遮挡其他元素,我们可以调整误差线的透明度:
import matplotlib.pyplot as plt
import numpy as np

categories = ['A', 'B', 'C', 'D']
values = [3, 7, 2, 5]
errors = [0.5, 1.2, 0.3, 0.8]
colors = ['red', 'green', 'blue', 'orange']

plt.figure(figsize=(8, 6))
bars = plt.bar(categories, values, color=colors, alpha=0.7)

for i, bar in enumerate(bars):
    plt.errorbar(bar.get_x() + bar.get_width() / 2, values[i], yerr=errors[i],
                 ecolor=colors[i], capsize=5, fmt='none', alpha=0.5)

plt.title('Bar Plot with Transparent Error Bars - how2matplotlib.com')
plt.xlabel('Categories')
plt.ylabel('Values')
plt.show()
Output:
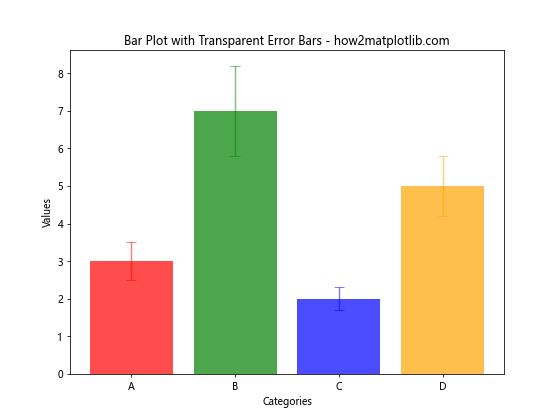
在这个例子中,我们使用alpha参数为条形和误差线设置了透明度,使图表看起来更加柔和。
5. 处理大量数据
当处理大量数据时,我们需要考虑如何有效地显示误差线而不使图表变得杂乱:
5.1 使用误差线抽样
对于大量数据,我们可以选择只显示部分数据点的误差线:
import matplotlib.pyplot as plt
import numpy as np

np.random.seed(42)
categories = [f'Cat{i}' for i in range(20)]
values = np.random.randint(1, 10, 20)
errors = np.random.rand(20)
colors = plt.cm.viridis(np.linspace(0, 1, 20))

plt.figure(figsize=(12, 6))
bars = plt.bar(categories, values, color=colors)

for i, bar in enumerate(bars):
    if i % 3 == 0:  # 只显示每三个数据点的误差线
        plt.errorbar(bar.get_x() + bar.get_width() / 2, values[i], yerr=errors[i],
                     ecolor=colors[i], capsize=5, fmt='none')

plt.title('Bar Plot with Sampled Error Bars - how2matplotlib.com')
plt.xlabel('Categories')
plt.ylabel('Values')
plt.xticks(rotation=45, ha='right')
plt.tight_layout()
plt.show()
Output:
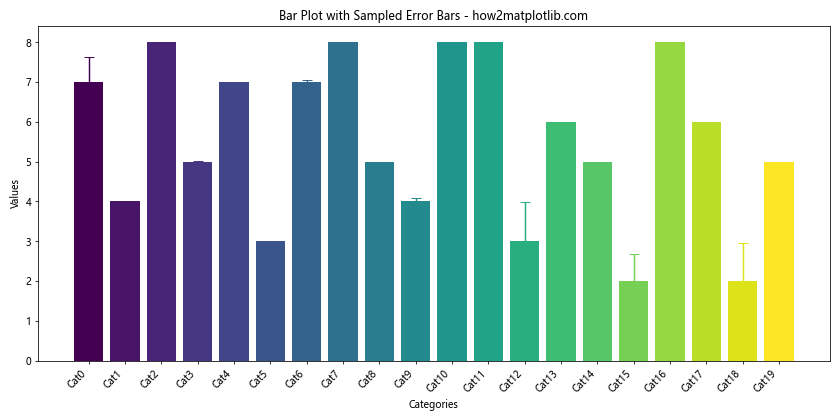
这个例子中,我们只为每三个数据点显示误差线,以减少图表的复杂性。
5.2 使用箱线图代替误差线
对于大量数据,使用箱线图可能比误差线更有效:
import matplotlib.pyplot as plt
import numpy as np

np.random.seed(42)
categories = [f'Cat{i}' for i in range(10)]
data = [np.random.normal(5, 1, 100) for _ in range(10)]

plt.figure(figsize=(12, 6))
box_plot = plt.boxplot(data, patch_artist=True)

colors = plt.cm.viridis(np.linspace(0, 1, len(categories)))
for patch, color in zip(box_plot['boxes'], colors):
    patch.set_facecolor(color)

plt.title('Box Plot as Alternative to Error Bars - how2matplotlib.com')
plt.xlabel('Categories')
plt.ylabel('Values')
plt.xticks(range(1, len(categories) + 1), categories)
plt.show()
Output:
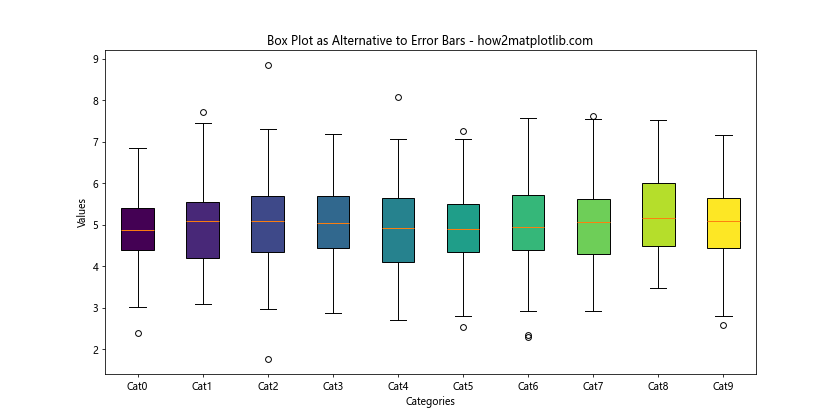
这个例子使用箱线图来显示数据的分布情况,每个箱子代表一个类别的数据分布,比单纯的误差线提供了更多信息。
6. 结合其他图表元素
我们可以将不同颜色的误差线与其他图表元素结合,以创建更丰富的可视化效果:
6.1 添加数据标签
我们可以在条形图上添加数据标签,同时保留不同颜色的误差线:
import matplotlib.pyplot as plt
import numpy as np

categories = ['A', 'B', 'C', 'D']
values = [3, 7, 2, 5]
errors = [0.5, 1.2, 0.3, 0.8]
colors = ['red', 'green', 'blue', 'orange']

plt.figure(figsize=(8, 6))
bars = plt.bar(categories, values, color=colors)

for i, bar in enumerate(bars):
    plt.errorbar(bar.get_x() + bar.get_width() / 2, values[i], yerr=errors[i],
                 ecolor=colors[i], capsize=5, fmt='none')
    plt.text(bar.get_x() + bar.get_width() / 2, values[i], f'{values[i]}±{errors[i]}',
             ha='center', va='bottom')

plt.title('Bar Plot with Error Bars and Data Labels - how2matplotlib.com')
plt.xlabel('Categories')
plt.ylabel('Values')
plt.ylim(0, max(values) + max(errors) + 1)  # 调整y轴范围以适应标签
plt.show()
Output:
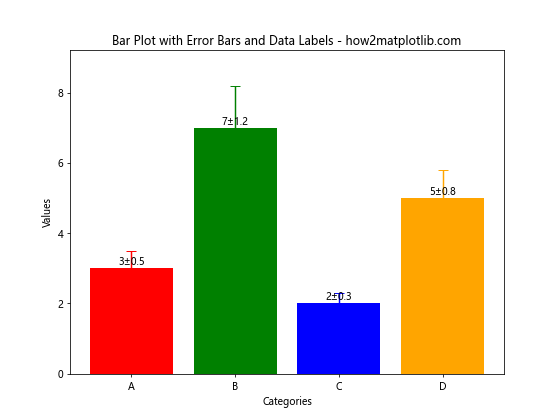
这个例子在每个条形上方添加了数据标签,显示数值和误差。
6.2 结合折线图
我们可以将条形图、误差线和折线图结合,以显示多个相关数据系列:
import matplotlib.pyplot as plt
import numpy as np

categories = ['A', 'B', 'C', 'D']
values1 = [3, 7, 2, 5]
values2 = [2, 5, 3, 4]
errors1 = [0.5, 1.2, 0.3, 0.8]
colors = ['red', 'green', 'blue', 'orange']

plt.figure(figsize=(10, 6))
bars = plt.bar(categories, values1, color=colors, alpha=0.7)

for i, bar in enumerate(bars):
    plt.errorbar(bar.get_x() + bar.get_width() / 2, values1[i], yerr=errors1[i],
                 ecolor=colors[i], capsize=5, fmt='none')

plt.plot(categories, values2, marker='o', color='purple', linewidth=2, label='Line Series')

plt.title('Combined Bar and Line Plot with Error Bars - how2matplotlib.com')
plt.xlabel('Categories')
plt.ylabel('Values')
plt.legend()
plt.show()
Output:
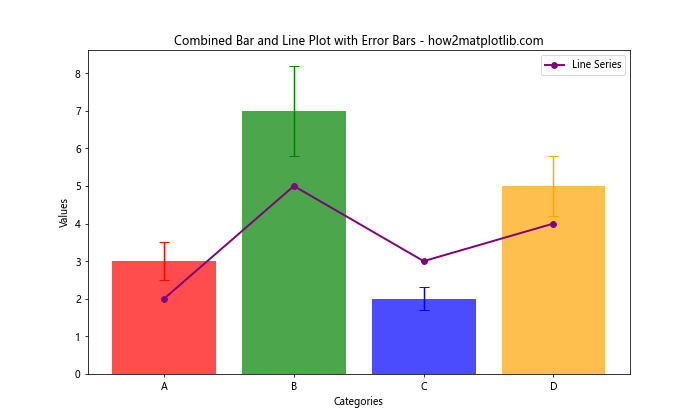
这个例子展示了如何将条形图、误差线和折线图结合在一起,以比较两个数据系列。
总结
在Matplotlib中设置不同颜色的误差线可以大大提高数据可视化的效果和信息传递能力。通过本文介绍的各种技巧和方法,我们可以根据具体需求灵活地调整误差线的颜色、样式和格式。无论是处理简单的数据集还是复杂的大规模数据,这些技巧都能帮助我们创建出既美观又信息丰富的图表。
在实际应用中,选择合适的颜色方案、考虑数据的特性、结合其他图表元素,都是创建有效可视化的关键。同时,我们还需要注意图表的可读性和accessibility,确保不同颜色的使用不会给色盲读者带来困扰。
通过不断实践和探索,我们可以掌握更多Matplotlib的高级技巧,创造出更加专业和吸引人的数据可视化作品。记住,好的数据可视化不仅仅是展示数据,更是讲述数据背后的故事,帮助观众更好地理解和洞察数据所蕴含的信息。
 极客教程
极客教程