Matplotlib中创建堆叠百分比条形图的全面指南
参考:Stacked Percentage Bar Plot In MatPlotLib
堆叠百分比条形图是数据可视化中一种强大而直观的图表类型,它能够有效地展示不同类别在整体中的占比情况。本文将详细介绍如何使用Matplotlib库在Python中创建堆叠百分比条形图,包括基础概念、各种样式设置以及高级技巧。
1. 堆叠百分比条形图简介
堆叠百分比条形图是堆叠条形图的一种变体,它将每个类别的数值转换为百分比,使得每个条形的总高度都为100%。这种图表特别适合用于比较不同组之间各个类别的相对比例。
让我们从一个简单的例子开始:
import matplotlib.pyplot as plt
import numpy as np

categories = ['Category A', 'Category B', 'Category C']
values1 = [30, 40, 30]
values2 = [20, 50, 30]

fig, ax = plt.subplots(figsize=(10, 6))

ax.bar(categories, values1, label='Group 1')
ax.bar(categories, values2, bottom=values1, label='Group 2')

ax.set_ylabel('Percentage')
ax.set_title('Stacked Bar Plot - how2matplotlib.com')
ax.legend()

plt.show()
Output:
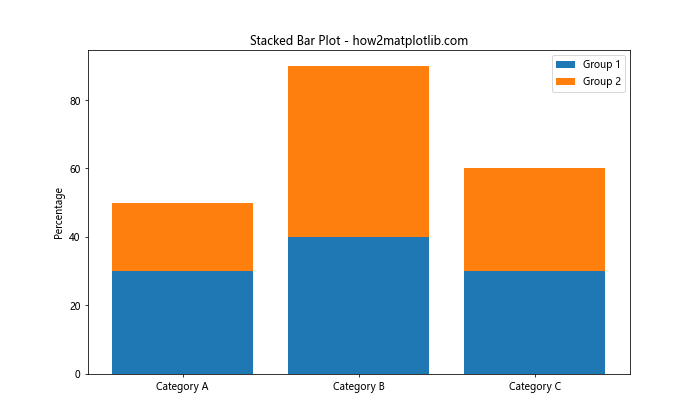
在这个例子中,我们创建了一个简单的堆叠条形图。但是,这还不是一个百分比堆叠条形图。接下来,我们将学习如何将其转换为百分比形式。
2. 数据准备
创建堆叠百分比条形图的第一步是准备数据。我们需要将原始数据转换为百分比形式。这通常涉及以下步骤:
- 计算每个类别的总和
- 将每个值除以相应类别的总和
让我们看一个例子:
import matplotlib.pyplot as plt
import numpy as np

categories = ['Category A', 'Category B', 'Category C']
values1 = [30, 40, 30]
values2 = [20, 50, 30]

# 计算百分比
totals = np.array(values1) + np.array(values2)
percentages1 = np.array(values1) / totals * 100
percentages2 = np.array(values2) / totals * 100

fig, ax = plt.subplots(figsize=(10, 6))

ax.bar(categories, percentages1, label='Group 1')
ax.bar(categories, percentages2, bottom=percentages1, label='Group 2')

ax.set_ylabel('Percentage')
ax.set_title('Stacked Percentage Bar Plot - how2matplotlib.com')
ax.legend()

plt.show()
Output:
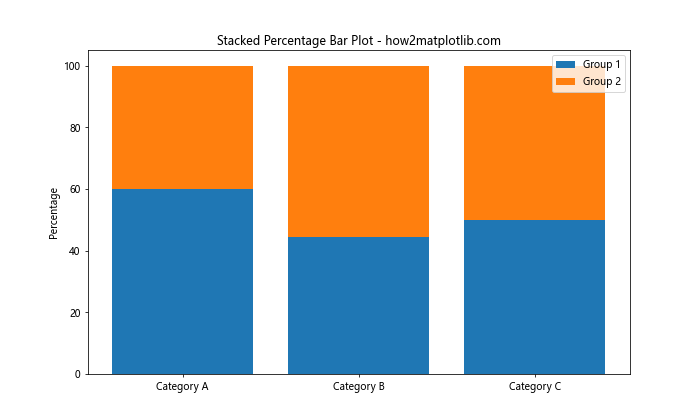
在这个例子中,我们首先计算了每个类别的总和,然后将原始值转换为百分比。这样,每个条形的总高度都是100%。
3. 创建基本的堆叠百分比条形图
现在我们已经准备好了百分比数据,让我们创建一个基本的堆叠百分比条形图:
import matplotlib.pyplot as plt
import numpy as np

categories = ['Category A', 'Category B', 'Category C', 'Category D']
group1 = [20, 35, 30, 35]
group2 = [25, 25, 20, 45]
group3 = [55, 40, 50, 20]

# 计算百分比
totals = np.array(group1) + np.array(group2) + np.array(group3)
percentages1 = np.array(group1) / totals * 100
percentages2 = np.array(group2) / totals * 100
percentages3 = np.array(group3) / totals * 100

fig, ax = plt.subplots(figsize=(12, 7))

ax.bar(categories, percentages1, label='Group 1')
ax.bar(categories, percentages2, bottom=percentages1, label='Group 2')
ax.bar(categories, percentages3, bottom=percentages1+percentages2, label='Group 3')

ax.set_ylabel('Percentage')
ax.set_title('Stacked Percentage Bar Plot - how2matplotlib.com')
ax.legend(loc='upper right')

# 添加百分比标签
for i, category in enumerate(categories):
    total = percentages1[i] + percentages2[i] + percentages3[i]
    ax.text(i, total, f'{total:.1f}%', ha='center', va='bottom')

plt.show()
Output:
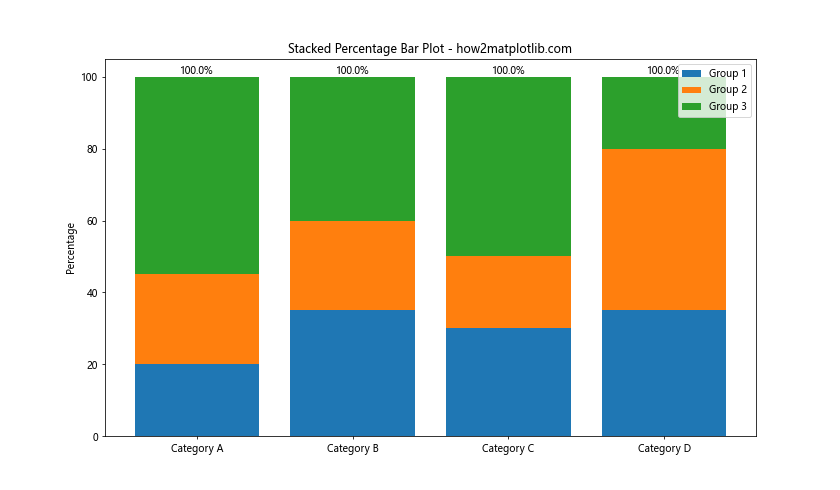
这个例子展示了如何创建一个包含三个组的堆叠百分比条形图。我们还添加了总百分比标签在每个条形的顶部。
4. 自定义颜色和样式
为了使图表更具吸引力和可读性,我们可以自定义颜色和样式:
import matplotlib.pyplot as plt
import numpy as np

categories = ['Category A', 'Category B', 'Category C', 'Category D']
group1 = [20, 35, 30, 35]
group2 = [25, 25, 20, 45]
group3 = [55, 40, 50, 20]

totals = np.array(group1) + np.array(group2) + np.array(group3)
percentages1 = np.array(group1) / totals * 100
percentages2 = np.array(group2) / totals * 100
percentages3 = np.array(group3) / totals * 100

fig, ax = plt.subplots(figsize=(12, 7))

colors = ['#ff9999', '#66b3ff', '#99ff99']
ax.bar(categories, percentages1, label='Group 1', color=colors[0])
ax.bar(categories, percentages2, bottom=percentages1, label='Group 2', color=colors[1])
ax.bar(categories, percentages3, bottom=percentages1+percentages2, label='Group 3', color=colors[2])

ax.set_ylabel('Percentage', fontsize=12)
ax.set_title('Customized Stacked Percentage Bar Plot - how2matplotlib.com', fontsize=16)
ax.legend(loc='upper right', fontsize=10)

ax.spines['top'].set_visible(False)
ax.spines['right'].set_visible(False)

plt.show()
Output:
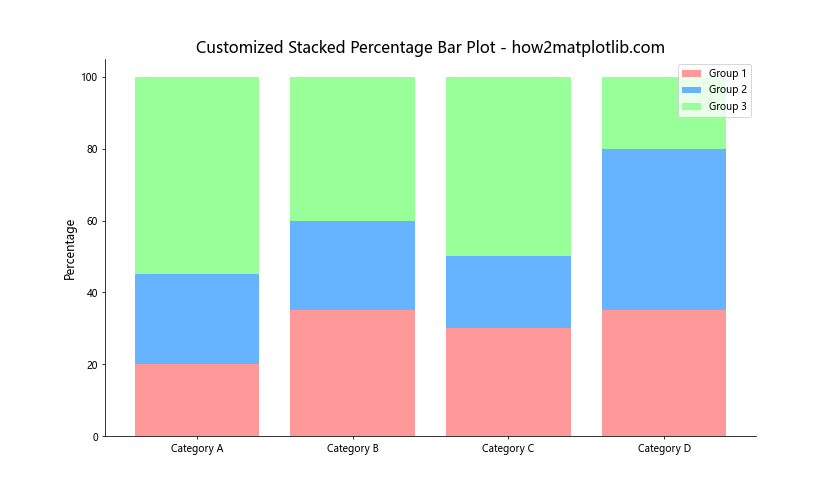
在这个例子中,我们使用了自定义的颜色方案,调整了字体大小,并移除了顶部和右侧的边框线,使图表看起来更加清晰和现代。
5. 添加数据标签
为了使图表更加信息丰富,我们可以在每个部分添加数据标签:
import matplotlib.pyplot as plt
import numpy as np

categories = ['Category A', 'Category B', 'Category C', 'Category D']
group1 = [20, 35, 30, 35]
group2 = [25, 25, 20, 45]
group3 = [55, 40, 50, 20]

totals = np.array(group1) + np.array(group2) + np.array(group3)
percentages1 = np.array(group1) / totals * 100
percentages2 = np.array(group2) / totals * 100
percentages3 = np.array(group3) / totals * 100

fig, ax = plt.subplots(figsize=(12, 7))

colors = ['#ff9999', '#66b3ff', '#99ff99']
bars1 = ax.bar(categories, percentages1, label='Group 1', color=colors[0])
bars2 = ax.bar(categories, percentages2, bottom=percentages1, label='Group 2', color=colors[1])
bars3 = ax.bar(categories, percentages3, bottom=percentages1+percentages2, label='Group 3', color=colors[2])

ax.set_ylabel('Percentage', fontsize=12)
ax.set_title('Stacked Percentage Bar Plot with Labels - how2matplotlib.com', fontsize=16)
ax.legend(loc='upper right', fontsize=10)

def add_labels(bars):
    for bar in bars:
        height = bar.get_height()
        ax.text(bar.get_x() + bar.get_width()/2, bar.get_y() + height/2,
                f'{height:.1f}%', ha='center', va='center')

add_labels(bars1)
add_labels(bars2)
add_labels(bars3)

plt.show()
Output:
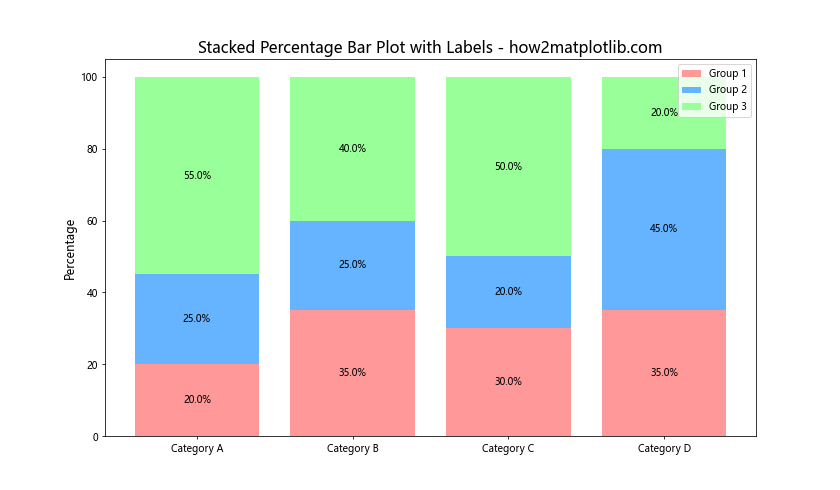
这个例子展示了如何在每个条形的中心添加百分比标签,使得数据更容易被读取和理解。
6. 水平堆叠百分比条形图
有时,水平方向的堆叠百分比条形图可能更适合某些数据集或布局需求:
import matplotlib.pyplot as plt
import numpy as np

categories = ['Category A', 'Category B', 'Category C', 'Category D']
group1 = [20, 35, 30, 35]
group2 = [25, 25, 20, 45]
group3 = [55, 40, 50, 20]

totals = np.array(group1) + np.array(group2) + np.array(group3)
percentages1 = np.array(group1) / totals * 100
percentages2 = np.array(group2) / totals * 100
percentages3 = np.array(group3) / totals * 100

fig, ax = plt.subplots(figsize=(12, 7))

colors = ['#ff9999', '#66b3ff', '#99ff99']
ax.barh(categories, percentages1, label='Group 1', color=colors[0])
ax.barh(categories, percentages2, left=percentages1, label='Group 2', color=colors[1])
ax.barh(categories, percentages3, left=percentages1+percentages2, label='Group 3', color=colors[2])

ax.set_xlabel('Percentage', fontsize=12)
ax.set_title('Horizontal Stacked Percentage Bar Plot - how2matplotlib.com', fontsize=16)
ax.legend(loc='lower right', fontsize=10)

for i, category in enumerate(categories):
    total = percentages1[i] + percentages2[i] + percentages3[i]
    ax.text(total, i, f'{total:.1f}%', ha='left', va='center')

plt.show()
Output:
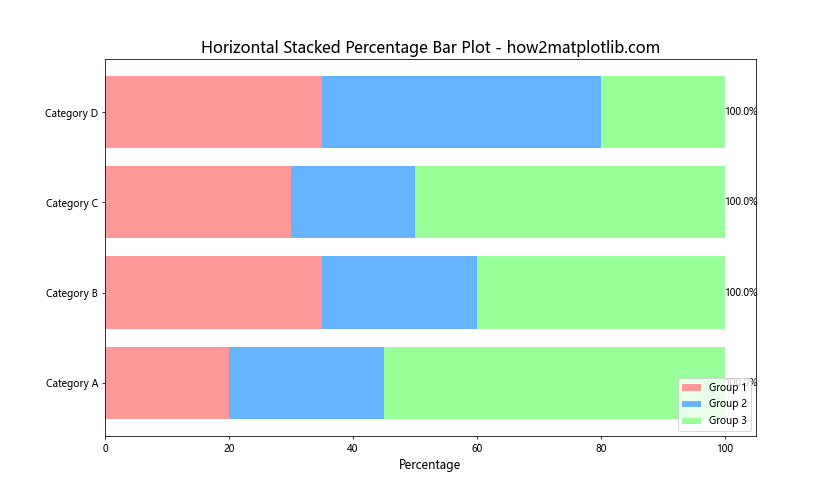
这个例子创建了一个水平方向的堆叠百分比条形图,并在每个条形的末端添加了总百分比标签。
7. 使用Pandas数据框
在实际应用中,我们经常需要处理Pandas数据框。以下是如何使用Pandas数据框创建堆叠百分比条形图:
import matplotlib.pyplot as plt
import pandas as pd

data = {
    'Category': ['A', 'B', 'C', 'D'],
    'Group1': [20, 35, 30, 35],
    'Group2': [25, 25, 20, 45],
    'Group3': [55, 40, 50, 20]
}

df = pd.DataFrame(data)
df_percentage = df.set_index('Category')
df_percentage = df_percentage.div(df_percentage.sum(axis=1), axis=0) * 100

ax = df_percentage.plot(kind='bar', stacked=True, figsize=(12, 7))

ax.set_ylabel('Percentage')
ax.set_title('Stacked Percentage Bar Plot using Pandas - how2matplotlib.com')
ax.legend(title='Groups', bbox_to_anchor=(1.05, 1), loc='upper left')

for c in ax.containers:
    ax.bar_label(c, fmt='%.1f%%', label_type='center')

plt.tight_layout()
plt.show()
Output:
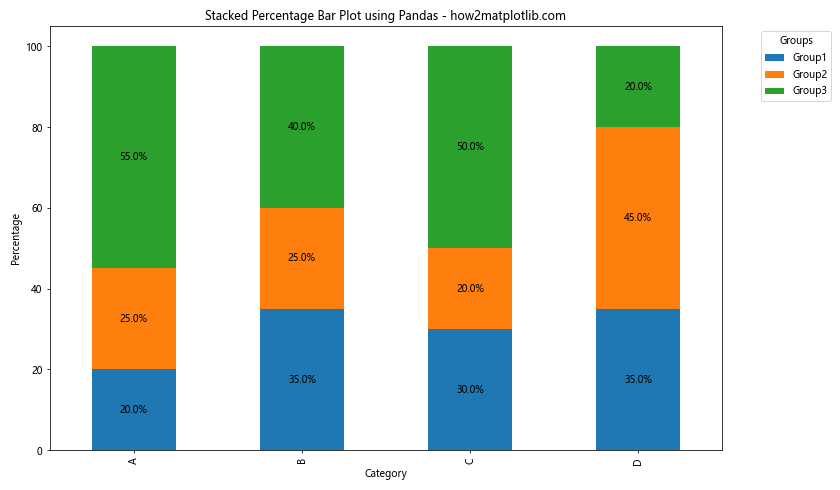
这个例子展示了如何使用Pandas数据框创建堆叠百分比条形图,并在每个部分添加百分比标签。
8. 添加网格线
为了提高可读性,我们可以添加网格线:
import matplotlib.pyplot as plt
import numpy as np

categories = ['Category A', 'Category B', 'Category C', 'Category D']
group1 = [20, 35, 30, 35]
group2 = [25, 25, 20, 45]
group3 = [55, 40, 50, 20]

totals = np.array(group1) + np.array(group2) + np.array(group3)
percentages1 = np.array(group1) / totals * 100
percentages2 = np.array(group2) / totals * 100
percentages3 = np.array(group3) / totals * 100

fig, ax = plt.subplots(figsize=(12, 7))

colors = ['#ff9999', '#66b3ff', '#99ff99']
ax.bar(categories, percentages1, label='Group 1', color=colors[0])
ax.bar(categories, percentages2, bottom=percentages1, label='Group 2', color=colors[1])
ax.bar(categories, percentages3, bottom=percentages1+percentages2, label='Group 3', color=colors[2])

ax.set_ylabel('Percentage', fontsize=12)
ax.set_title('Stacked Percentage Bar Plot with Grid - how2matplotlib.com', fontsize=16)
ax.legend(loc='upper right', fontsize=10)

ax.grid(axis='y', linestyle='--', alpha=0.7)
ax.set_axisbelow(True)

plt.show()
Output:
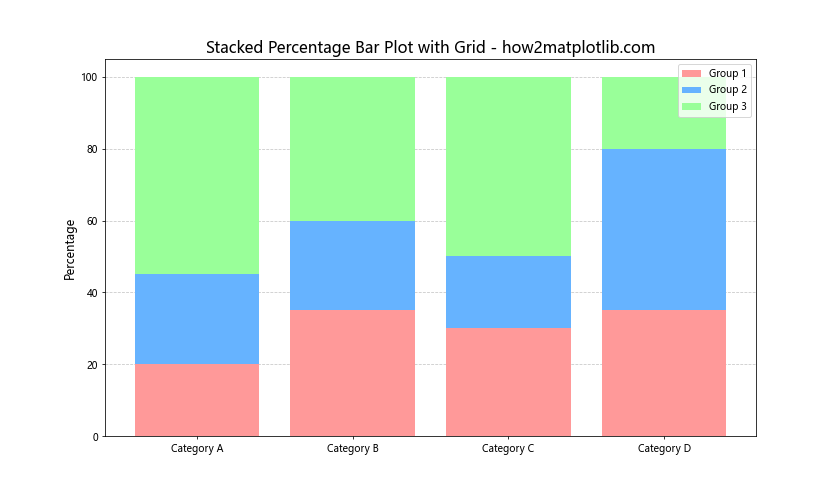
这个例子添加了水平网格线,使得比较不同类别的百分比更加容易。
9. 使用不同的颜色映射
我们可以使用Matplotlib的颜色映射来自动生成一组和谐的颜色:
import matplotlib.pyplot as plt
import numpy as np

categories = ['Category A', 'Category B', 'Category C', 'Category D']
group1 = [20, 35, 30, 35]
group2 = [25, 25, 20, 45]
group3 = [55, 40, 50, 20]

totals = np.array(group1) + np.array(group2) + np.array(group3)
percentages1 = np.array(group1) / totals * 100
percentages2 = np.array(group2) / totals * 100
percentages3 = np.array(group3) / totals * 100

fig, ax = plt.subplots(figsize=(12, 7))

cmap = plt.cm.viridis
colors = cmap(np.linspace(0, 1, 3))

ax.bar(categories, percentages1, label='Group 1', color=colors[0])
ax.bar(categories, percentages2, bottom=percentages1, label='Group 2', color=colors[1])
ax.bar(categories, percentages3, bottom=percentages1+percentages2, label='Group 3', color=colors[2])

ax.set_ylabel('Percentage', fontsize=12)
ax.set_title('Stacked Percentage Bar Plot with Color Map - how2matplotlib.com', fontsize=16)
ax.legend(loc='upper right', fontsize=10)

plt.show()
Output:
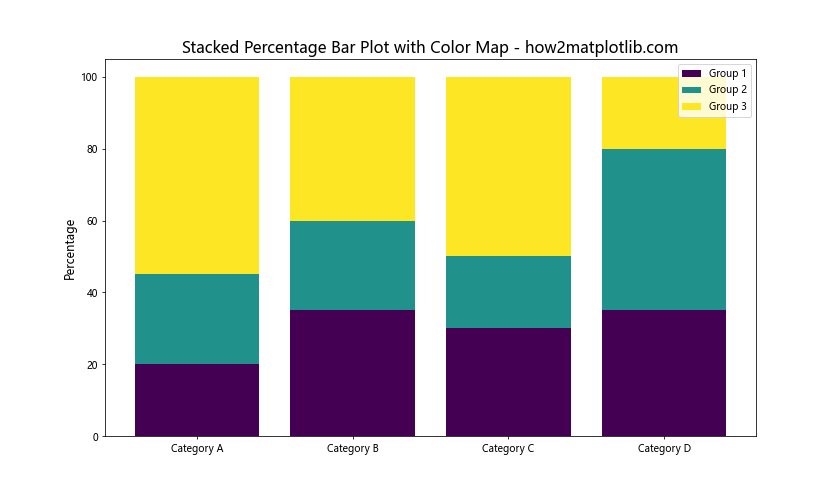
这个例子使用了 viridis 颜色映射来为不同的组生成颜色。你可以尝试其他颜色映射,如 plt.cm.plasma 或 plt.cm.coolwarm,以获得不同的视觉效果。
10. 添加误差条
在某些情况下,我们可能需要在堆叠百分比条形图中显示误差范围:
import matplotlib.pyplot as plt
import numpy as np

categories = ['Category A', 'Category B', 'Category C', 'Category D']
group1 = [20, 35, 30, 35]
group2 = [25, 25, 20, 45]
group3 = [55, 40, 50, 20]
errors = [2, 3, 4, 3]  # 误差值

totals = np.array(group1) + np.array(group2) + np.array(group3)
percentages1 = np.array(group1) / totals * 100
percentages2 = np.array(group2) / totals * 100
percentages3 = np.array(group3) / totals * 100

fig, ax = plt.subplots(figsize=(12, 7))

ax.bar(categories, percentages1, label='Group 1')
ax.bar(categories, percentages2, bottom=percentages1, label='Group 2')
bars = ax.bar(categories, percentages3, bottom=percentages1+percentages2, label='Group 3')

ax.errorbar(categories, 100, yerr=errors, fmt='none', capsize=5, color='black')

ax.set_ylabel('Percentage', fontsize=12)
ax.set_title('Stacked Percentage Bar Plot with Error Bars - how2matplotlib.com', fontsize=16)
ax.legend(loc='upper right', fontsize=10)

plt.show()
这个例子在每个堆叠条形的顶部添加了误差条,表示数据的不确定性或变异性。
11. 使用分组堆叠百分比条形图
有时,我们可能需要比较多个组之间的堆叠百分比:
import matplotlib.pyplot as plt
import numpy as np

categories = ['Category A', 'Category B', 'Category C']
group1 = {'Low': [20, 30, 25], 'Medium': [30, 40, 35], 'High': [50, 30, 40]}
group2 = {'Low': [25, 25, 30], 'Medium': [35, 45, 40], 'High': [40, 30, 30]}

x = np.arange(len(categories))
width = 0.35

fig, ax = plt.subplots(figsize=(12, 7))

def create_percentage_stack(data):
    totals = np.array(data['Low']) + np.array(data['Medium']) + np.array(data['High'])
    return [np.array(data['Low'])/totals*100,
            np.array(data['Medium'])/totals*100,
            np.array(data['High'])/totals*100]

percentages1 = create_percentage_stack(group1)
percentages2 = create_percentage_stack(group2)

ax.bar(x - width/2, percentages1[0], width, label='Low')
ax.bar(x - width/2, percentages1[1], width, bottom=percentages1[0], label='Medium')
ax.bar(x - width/2, percentages1[2], width, bottom=percentages1[0]+percentages1[1], label='High')

ax.bar(x + width/2, percentages2[0], width)
ax.bar(x + width/2, percentages2[1], width, bottom=percentages2[0])
ax.bar(x + width/2, percentages2[2], width, bottom=percentages2[0]+percentages2[1])

ax.set_ylabel('Percentage')
ax.set_title('Grouped Stacked Percentage Bar Plot - how2matplotlib.com')
ax.set_xticks(x)
ax.set_xticklabels(categories)
ax.legend()

plt.show()
Output:
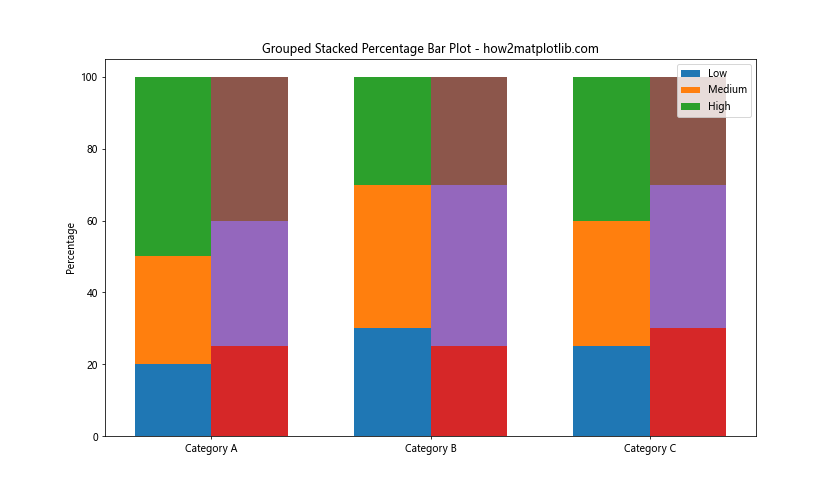
这个例子创建了一个分组堆叠百分比条形图,允许我们比较两个不同组之间的百分比分布。
12. 添加数据表格
为了提供更详细的信息,我们可以在图表下方添加一个数据表格:
import matplotlib.pyplot as plt
import numpy as np

categories = ['Category A', 'Category B', 'Category C', 'Category D']
group1 = [20, 35, 30, 35]
group2 = [25, 25, 20, 45]
group3 = [55, 40, 50, 20]

totals = np.array(group1) + np.array(group2) + np.array(group3)
percentages1 = np.array(group1) / totals * 100
percentages2 = np.array(group2) / totals * 100
percentages3 = np.array(group3) / totals * 100

fig, (ax, table_ax) = plt.subplots(2, 1, figsize=(12, 10), gridspec_kw={'height_ratios': [3, 1]})

ax.bar(categories, percentages1, label='Group 1')
ax.bar(categories, percentages2, bottom=percentages1, label='Group 2')
ax.bar(categories, percentages3, bottom=percentages1+percentages2, label='Group 3')

ax.set_ylabel('Percentage')
ax.set_title('Stacked Percentage Bar Plot with Data Table - how2matplotlib.com')
ax.legend(loc='upper right')

table_data = [
    ['Category'] + categories,
    ['Group 1'] + [f'{p:.1f}%' for p in percentages1],
    ['Group 2'] + [f'{p:.1f}%' for p in percentages2],
    ['Group 3'] + [f'{p:.1f}%' for p in percentages3]
]

table = table_ax.table(cellText=table_data, loc='center', cellLoc='center')
table.auto_set_font_size(False)
table.set_fontsize(10)
table.scale(1, 1.5)
table_ax.axis('off')

plt.tight_layout()
plt.show()
Output:
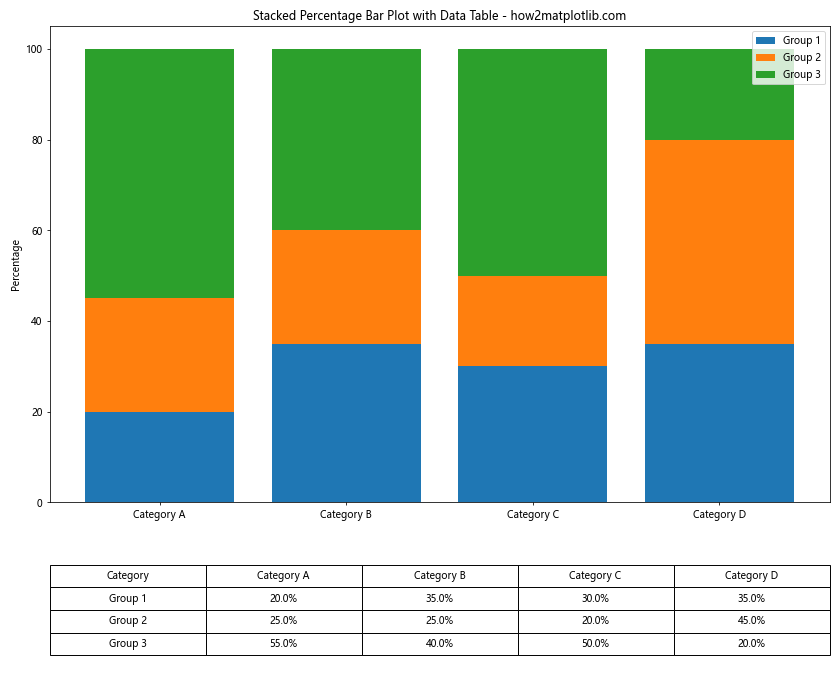
这个例子在堆叠百分比条形图下方添加了一个数据表格,提供了每个类别和组的具体百分比值。
13. 使用极坐标系
为了创建一个独特的视觉效果,我们可以在极坐标系中绘制堆叠百分比条形图:
import matplotlib.pyplot as plt
import numpy as np

categories = ['Category A', 'Category B', 'Category C', 'Category D', 'Category E']
group1 = [20, 35, 30, 35, 25]
group2 = [25, 25, 20, 45, 30]
group3 = [55, 40, 50, 20, 45]

totals = np.array(group1) + np.array(group2) + np.array(group3)
percentages1 = np.array(group1) / totals * 100
percentages2 = np.array(group2) / totals * 100
percentages3 = np.array(group3) / totals * 100

fig, ax = plt.subplots(figsize=(10, 10), subplot_kw=dict(projection='polar'))

theta = np.linspace(0.0, 2 * np.pi, len(categories), endpoint=False)
width = 0.5

ax.bar(theta, percentages1, width=width, bottom=0.0, label='Group 1')
ax.bar(theta, percentages2, width=width, bottom=percentages1, label='Group 2')
ax.bar(theta, percentages3, width=width, bottom=percentages1+percentages2, label='Group 3')

ax.set_xticks(theta)
ax.set_xticklabels(categories)
ax.set_title('Polar Stacked Percentage Bar Plot - how2matplotlib.com')
ax.legend(loc='lower right', bbox_to_anchor=(1.1, 0.1))

plt.show()
Output:
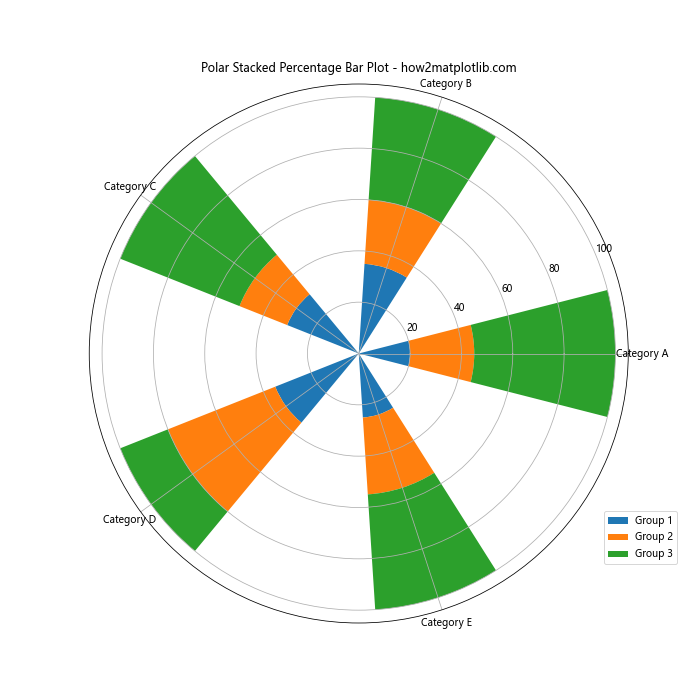
这个例子创建了一个极坐标系中的堆叠百分比条形图,为数据可视化提供了一个独特的视角。
14. 添加注释
有时,我们可能需要在图表中添加特定的注释来突出某些信息:
import matplotlib.pyplot as plt
import numpy as np

categories = ['Category A', 'Category B', 'Category C', 'Category D']
group1 = [20, 35, 30, 35]
group2 = [25, 25, 20, 45]
group3 = [55, 40, 50, 20]

totals = np.array(group1) + np.array(group2) + np.array(group3)
percentages1 = np.array(group1) / totals * 100
percentages2 = np.array(group2) / totals * 100
percentages3 = np.array(group3) / totals * 100

fig, ax = plt.subplots(figsize=(12, 7))

ax.bar(categories, percentages1, label='Group 1')
ax.bar(categories, percentages2, bottom=percentages1, label='Group 2')
ax.bar(categories, percentages3, bottom=percentages1+percentages2, label='Group 3')

ax.set_ylabel('Percentage')
ax.set_title('Stacked Percentage Bar Plot with Annotations - how2matplotlib.com')
ax.legend(loc='upper right')

# 添加注释
max_index = np.argmax(percentages3)
max_value = percentages3[max_index]
ax.annotate(f'Max: {max_value:.1f}%',
            xy=(max_index, sum([percentages1[max_index], percentages2[max_index], max_value])),
            xytext=(max_index, sum([percentages1[max_index], percentages2[max_index], max_value]) + 10),
            arrowprops=dict(facecolor='black', shrink=0.05),
            horizontalalignment='center')

plt.show()
Output:
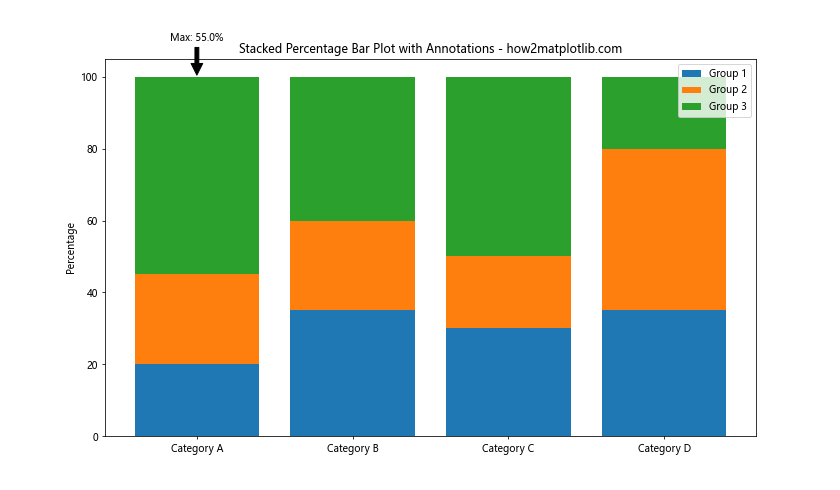
这个例子在堆叠百分比条形图中添加了一个注释,指出了Group 3中的最大值。
15. 使用不同的条形宽度
我们可以通过调整条形的宽度来强调某些类别:
import matplotlib.pyplot as plt
import numpy as np

categories = ['Category A', 'Category B', 'Category C', 'Category D']
group1 = [20, 35, 30, 35]
group2 = [25, 25, 20, 45]
group3 = [55, 40, 50, 20]

totals = np.array(group1) + np.array(group2) + np.array(group3)
percentages1 = np.array(group1) / totals * 100
percentages2 = np.array(group2) / totals * 100
percentages3 = np.array(group3) / totals * 100

fig, ax = plt.subplots(figsize=(12, 7))

x = np.arange(len(categories))
widths = [0.5, 0.7, 0.9, 0.6]  # 不同的宽度

ax.bar(x, percentages1, width=widths, label='Group 1')
ax.bar(x, percentages2, width=widths, bottom=percentages1, label='Group 2')
ax.bar(x, percentages3, width=widths, bottom=percentages1+percentages2, label='Group 3')

ax.set_ylabel('Percentage')
ax.set_title('Stacked Percentage Bar Plot with Varying Widths - how2matplotlib.com')
ax.set_xticks(x)
ax.set_xticklabels(categories)
ax.legend(loc='upper right')

plt.show()
Output:
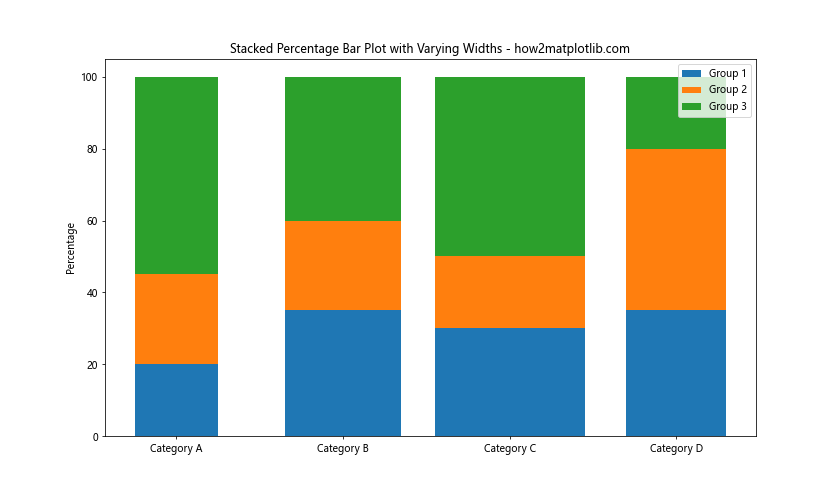
这个例子展示了如何使用不同的条形宽度来强调某些类别或创造视觉兴趣。
结论
堆叠百分比条形图是一种强大的数据可视化工具,可以有效地展示不同类别和组之间的比例关系。通过使用Matplotlib,我们可以创建各种样式的堆叠百分比条形图,包括垂直和水平方向、添加误差条、使用不同的颜色方案、添加数据标签和注释等。
在实际应用中,选择合适的图表样式和定制选项对于有效传达数据信息至关重要。根据你的具体需求和数据特征,你可以组合使用本文中介绍的各种技巧来创建最适合你的堆叠百分比条形图。
记住,好的数据可视化不仅要准确呈现数据,还要让观众能够轻松理解和解释数据。因此,在创建图表时,始终要考虑你的目标受众和你想要传达的主要信息。
通过掌握这些技巧,你将能够使用Matplotlib创建出既美观又信息丰富的堆叠百分比条形图,为你的数据分析和展示工作增添价值。
 极客教程
极客教程