Matplotlib 中使用 plt.subplots 和 title 创建多子图布局和设置标题
Matplotlib 是 Python 中最流行的数据可视化库之一,它提供了丰富的绘图功能和灵活的自定义选项。在进行数据分析和科学研究时,我们经常需要在一个图形中展示多个相关的图表,或者为图表添加标题以提供更多信息。本文将详细介绍如何使用 Matplotlib 中的 plt.subplots() 函数创建多子图布局,以及如何使用 title() 方法为图表设置标题。
1. plt.subplots() 函数简介
plt.subplots() 是 Matplotlib 中用于创建一个图形和一组子图的函数。它允许我们在一个窗口中绘制多个相关的图表,使得数据的比较和展示更加直观和高效。
1.1 基本用法
让我们从一个简单的例子开始,创建一个包含两个子图的图形:
import matplotlib.pyplot as plt
import numpy as np

# 创建一个包含两个子图的图形
fig, (ax1, ax2) = plt.subplots(1, 2, figsize=(10, 4))

# 在第一个子图中绘制正弦曲线
x = np.linspace(0, 2*np.pi, 100)
ax1.plot(x, np.sin(x))
ax1.set_title('Sine Curve - how2matplotlib.com')

# 在第二个子图中绘制余弦曲线
ax2.plot(x, np.cos(x))
ax2.set_title('Cosine Curve - how2matplotlib.com')

plt.tight_layout()
plt.show()
Output:
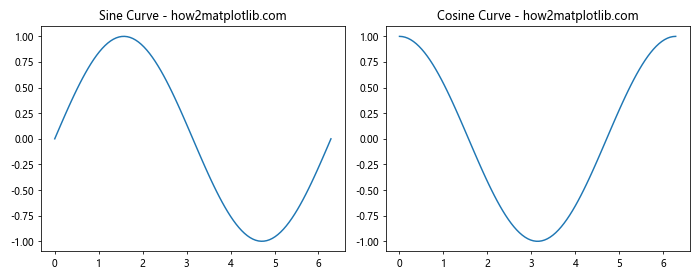
在这个例子中,我们使用 plt.subplots(1, 2) 创建了一个包含两个并排的子图的图形。figsize=(10, 4) 参数设置了图形的大小为 10×4 英寸。函数返回一个元组,包含图形对象 fig 和一个包含两个 Axes 对象的元组 (ax1, ax2)。我们可以使用这些 Axes 对象在各自的子图中绘制内容。
1.2 调整子图布局
plt.subplots() 函数提供了多个参数来调整子图的布局:
import matplotlib.pyplot as plt

# 创建一个 2x3 的子图网格,共享 y 轴
fig, axes = plt.subplots(2, 3, figsize=(12, 8), sharey=True)

# 遍历所有子图并添加一些文本
for i, ax in enumerate(axes.flat):
    ax.text(0.5, 0.5, f'Subplot {i+1} - how2matplotlib.com',
            ha='center', va='center')
    ax.set_title(f'Title {i+1}')

plt.tight_layout()
plt.show()
Output:
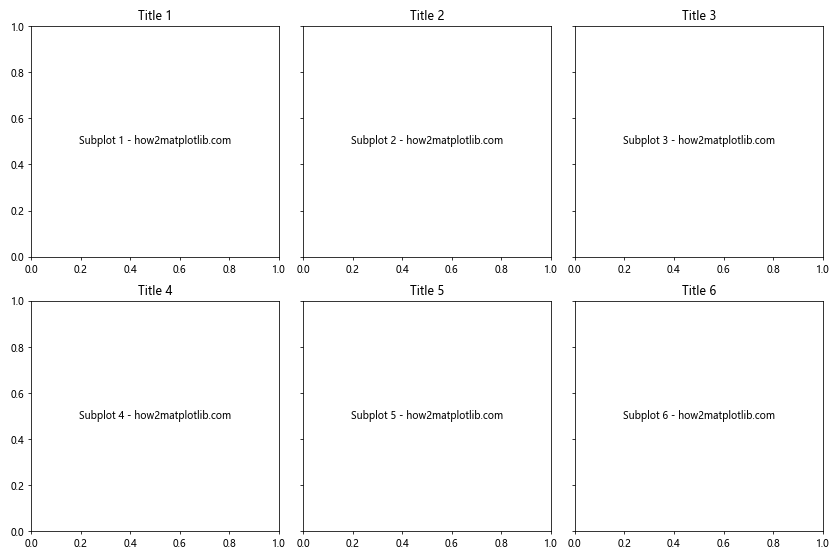
在这个例子中,我们创建了一个 2×3 的子图网格。sharey=True 参数使得所有子图共享相同的 y 轴范围。我们使用 axes.flat 属性来遍历所有子图,并在每个子图中添加一些文本和标题。
1.3 子图间距调整
我们可以使用 plt.subplots() 的 hspace 和 wspace 参数来调整子图之间的间距:
import matplotlib.pyplot as plt
import numpy as np

# 创建一个 2x2 的子图网格,调整间距
fig, axes = plt.subplots(2, 2, figsize=(10, 10),
                         gridspec_kw={'hspace': 0.3, 'wspace': 0.3})

# 在每个子图中绘制不同的函数
x = np.linspace(0, 10, 100)
functions = [np.sin, np.cos, np.tan, np.exp]
titles = ['Sine', 'Cosine', 'Tangent', 'Exponential']

for ax, func, title in zip(axes.flat, functions, titles):
    ax.plot(x, func(x))
    ax.set_title(f'{title} - how2matplotlib.com')

plt.show()
Output:
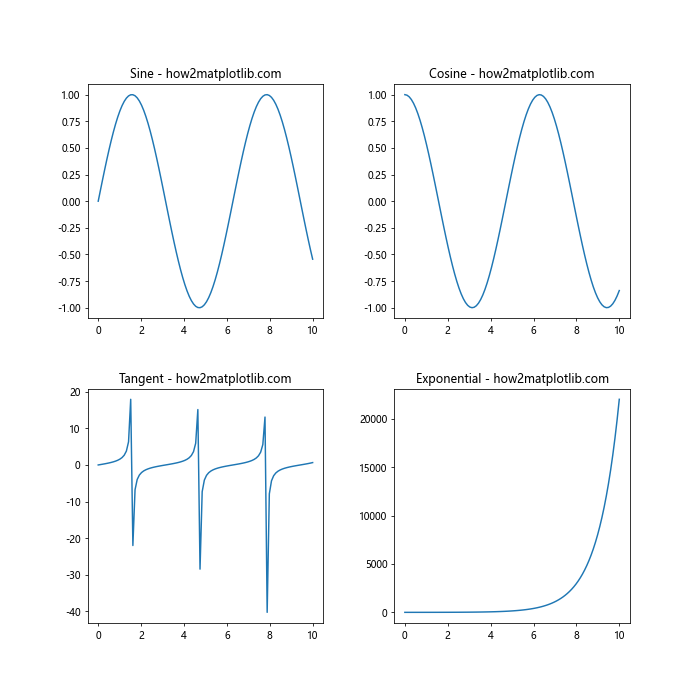
在这个例子中,我们使用 gridspec_kw 参数来设置子图之间的水平和垂直间距。hspace 控制垂直间距,wspace 控制水平间距。
2. 设置图形标题
为图形添加标题是提供上下文信息和增强可读性的重要方式。Matplotlib 提供了多种方法来设置标题。
2.1 使用 fig.suptitle() 设置总标题
对于包含多个子图的图形,我们可以使用 fig.suptitle() 方法来设置一个总标题:
import matplotlib.pyplot as plt
import numpy as np

# 创建一个包含四个子图的图形
fig, axes = plt.subplots(2, 2, figsize=(10, 8))

# 设置总标题
fig.suptitle('Various Mathematical Functions - how2matplotlib.com', fontsize=16)

# 在每个子图中绘制不同的函数
x = np.linspace(0, 2*np.pi, 100)
functions = [np.sin, np.cos, np.tan, np.exp]
titles = ['Sine', 'Cosine', 'Tangent', 'Exponential']

for ax, func, title in zip(axes.flat, functions, titles):
    ax.plot(x, func(x))
    ax.set_title(title)

plt.tight_layout(rect=[0, 0.03, 1, 0.95])  # 调整布局以适应总标题
plt.show()
Output:

在这个例子中,我们使用 fig.suptitle() 为整个图形设置了一个总标题。fontsize 参数用于调整标题的字体大小。注意,我们使用 plt.tight_layout(rect=[0, 0.03, 1, 0.95]) 来调整布局,以确保总标题不会与子图重叠。
2.2 为每个子图设置标题
我们可以使用 ax.set_title() 方法为每个子图单独设置标题:
import matplotlib.pyplot as plt
import numpy as np

# 创建一个 2x2 的子图网格
fig, axes = plt.subplots(2, 2, figsize=(10, 8))

# 设置总标题
fig.suptitle('Trigonometric Functions - how2matplotlib.com', fontsize=16)

# 在每个子图中绘制不同的三角函数
x = np.linspace(0, 2*np.pi, 100)
functions = [np.sin, np.cos, np.tan, np.sinh]
titles = ['Sine', 'Cosine', 'Tangent', 'Hyperbolic Sine']

for ax, func, title in zip(axes.flat, functions, titles):
    ax.plot(x, func(x))
    ax.set_title(f'{title} Function', fontsize=12)
    ax.set_xlabel('x')
    ax.set_ylabel('y')

plt.tight_layout(rect=[0, 0.03, 1, 0.95])
plt.show()
Output:

在这个例子中,我们为每个子图设置了单独的标题,并添加了 x 轴和 y 轴的标签。这种方法允许我们为每个子图提供更具体的描述。
2.3 调整标题样式
Matplotlib 允许我们自定义标题的样式,包括颜色、字体、位置等:
import matplotlib.pyplot as plt
import numpy as np

# 创建一个图形和一个子图
fig, ax = plt.subplots(figsize=(8, 6))

# 绘制一个简单的曲线
x = np.linspace(0, 10, 100)
y = np.sin(x) * np.exp(-0.1 * x)
ax.plot(x, y)

# 设置带有自定义样式的标题
ax.set_title('Damped Sine Wave - how2matplotlib.com',
             fontsize=16,
             color='navy',
             fontweight='bold',
             style='italic',
             loc='left',
             pad=20)

ax.set_xlabel('Time')
ax.set_ylabel('Amplitude')

plt.tight_layout()
plt.show()
Output:
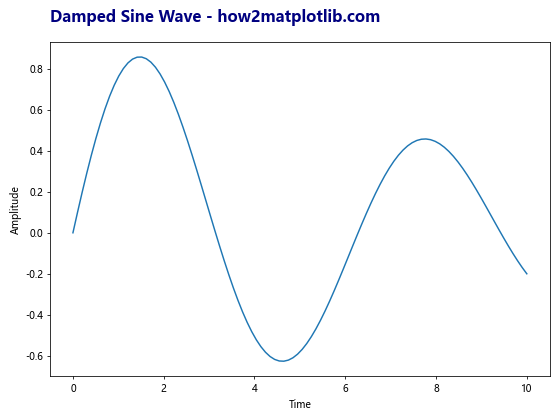
在这个例子中,我们使用了多个参数来自定义标题的样式:
– fontsize: 设置字体大小
– color: 设置字体颜色
– fontweight: 设置字体粗细
– style: 设置字体样式(如斜体)
– loc: 设置标题位置
– pad: 设置标题与图表之间的距离
3. 高级子图布局技巧
3.1 不规则子图布局
有时我们需要创建不规则的子图布局。Matplotlib 的 GridSpec 类提供了更灵活的布局选项:
import matplotlib.pyplot as plt
import matplotlib.gridspec as gridspec
import numpy as np

# 创建图形
fig = plt.figure(figsize=(12, 8))

# 创建不规则的网格布局
gs = gridspec.GridSpec(3, 3)

# 创建子图
ax1 = fig.add_subplot(gs[0, :])
ax2 = fig.add_subplot(gs[1, :-1])
ax3 = fig.add_subplot(gs[1:, -1])
ax4 = fig.add_subplot(gs[-1, 0])
ax5 = fig.add_subplot(gs[-1, -2])

# 在每个子图中添加一些内容
x = np.linspace(0, 2*np.pi, 100)
ax1.plot(x, np.sin(x), label='Sine')
ax1.set_title('Sine Wave - how2matplotlib.com')
ax1.legend()

ax2.plot(x, np.cos(x), label='Cosine')
ax2.set_title('Cosine Wave - how2matplotlib.com')
ax2.legend()

ax3.plot(x, np.tan(x), label='Tangent')
ax3.set_title('Tangent Wave - how2matplotlib.com')
ax3.legend()

ax4.plot(x, np.exp(x), label='Exponential')
ax4.set_title('Exponential Function - how2matplotlib.com')
ax4.legend()

ax5.plot(x, np.log(x), label='Logarithm')
ax5.set_title('Logarithm Function - how2matplotlib.com')
ax5.legend()

plt.tight_layout()
plt.show()
Output:
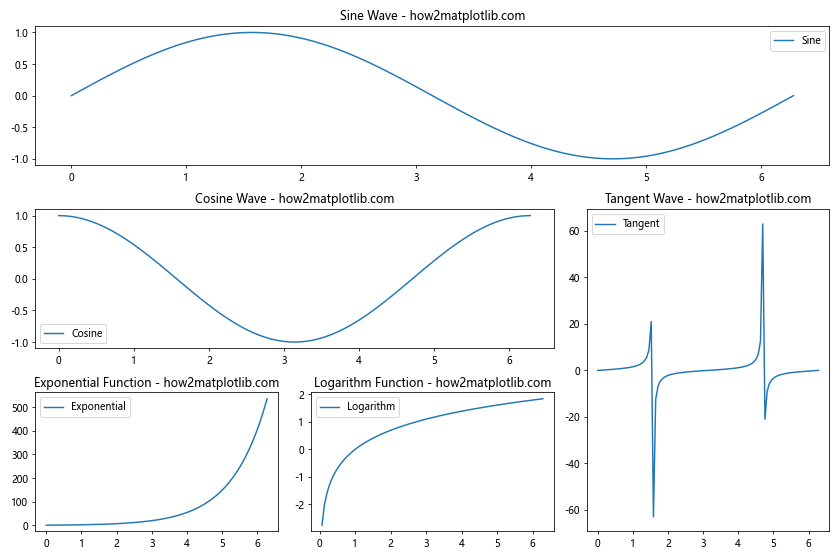
在这个例子中,我们使用 GridSpec 创建了一个 3×3 的网格,然后通过索引来定义不同大小和位置的子图。这种方法允许我们创建复杂的、不规则的子图布局。
3.2 子图中的子图
Matplotlib 还允许我们在子图中创建更多的子图,这对于创建复杂的嵌套布局非常有用:
import matplotlib.pyplot as plt
import numpy as np

# 创建主图形和子图
fig, (ax1, ax2) = plt.subplots(1, 2, figsize=(12, 5))

# 在第一个子图中绘制一个简单的曲线
x = np.linspace(0, 10, 100)
ax1.plot(x, np.sin(x))
ax1.set_title('Main Plot - how2matplotlib.com')

# 在第二个子图中创建一个嵌套的子图网格
gs = ax2.get_gridspec()
subgs = gs[1].subgridspec(2, 2)

for i, sax in enumerate(subgs):
    subax = fig.add_subplot(sax)
    subax.plot(x, np.sin(x + i*np.pi/2))
    subax.set_title(f'Subplot {i+1} - how2matplotlib.com')

ax2.set_title('Nested Subplots', fontsize=16)
ax2.axis('off')  # 隐藏主子图的轴

plt.tight_layout()
plt.show()
Output:
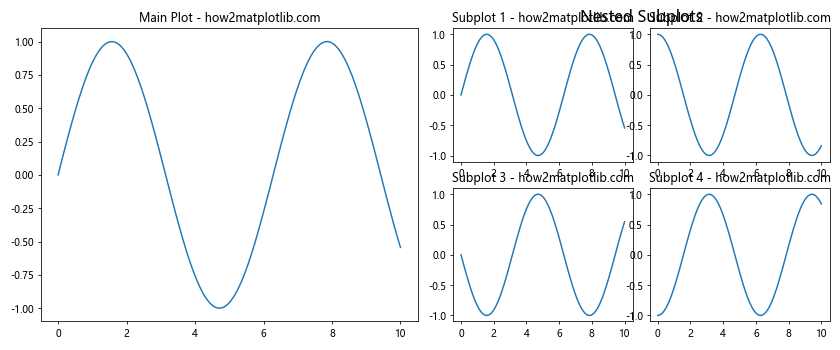
在这个例子中,我们在右侧的子图中创建了一个 2×2 的嵌套子图网格。这种技术可以用来创建复杂的、多层次的数据可视化。
4. 自定义子图和标题样式
4.1 使用不同的颜色主题
我们可以为不同的子图使用不同的颜色主题,以增强视觉效果和区分度:
import matplotlib.pyplot as plt
import numpy as np

# 创建一个 2x2 的子图网格
fig, axes = plt.subplots(2, 2, figsize=(12, 10))

# 设置不同的颜色主题
color_themes = ['viridis', 'plasma', 'inferno', 'magma']

# 在每个子图中绘制不同的函数,并应用不同的颜色主题
x = np.linspace(0, 10, 100)
functions = [np.sin, np.cos, np.exp, np.log]
titles = ['Sine', 'Cosine', 'Exponential', 'Logarithm']

for ax, func, title, cmap in zip(axes.flat, functions, titles, color_themes):
    y = func(x)
    im = ax.imshow(y.reshape(10, 10), cmap=cmap, aspect='auto', extent=[0, 10, 0, 10])
    ax.set_title(f'{title} - how2matplotlib.com', fontsize=14)
    fig.colorbar(im, ax=ax)

fig.suptitle('Functions with Different Color Themes', fontsize=16)
plt.tight_layout(rect=[0, 0.03, 1, 0.95])
plt.show()
Output:
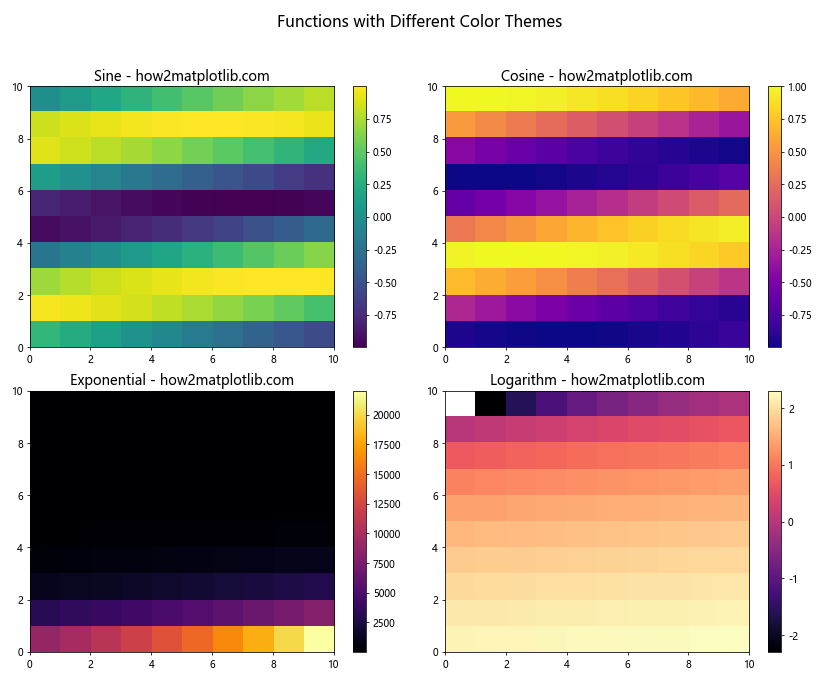
在这个例子中,我们为每个子图使用了不同的颜色主题,并使用 imshow() 函数来创建热图。这种方法可以帮助我们在一个图形中展示多个相关但不同的数据集。
4.2 自定义标题和轴标签样式
我们可以进一步自定义标题和轴标签的样式,以创建更专业和美观的图表:
import matplotlib.pyplot as plt
import numpy as np

# 创建一个 2x2 的子图网格
fig, axes = plt.subplots(2, 2, figsize=(12, 10))

# 自定义字体样式
title_font = {'fontname':'Arial', 'size':'16', 'color':'navy', 'weight':'bold'}
axis_font = {'fontname':'Arial', 'size':'12'}

# 在每个子图中绘制不同的函数
x = np.linspace(0, 2*np.pi, 100)
functions = [np.sin, np.cos, np.tan, np.exp]
titles = ['Sine', 'Cosine', 'Tangent', 'Exponential']

for ax, func, title in zip(axes.flat, functions, titles):
    ax.plot(x, func(x), linewidth=2)
    ax.set_title(f'{title} Function - how2matplotlib.com', **title_font)
    ax.set_xlabel('X-axis', **axis_font)
    ax.set_ylabel('Y-axis', **axis_font)
    ax.grid(True, linestyle='--', alpha=0.7)

fig.suptitle('Mathematical Functions Showcase', fontsize=20, fontweight='bold')
plt.tight_layout(rect=[0, 0.03, 1, 0.95])
plt.show()
Output:
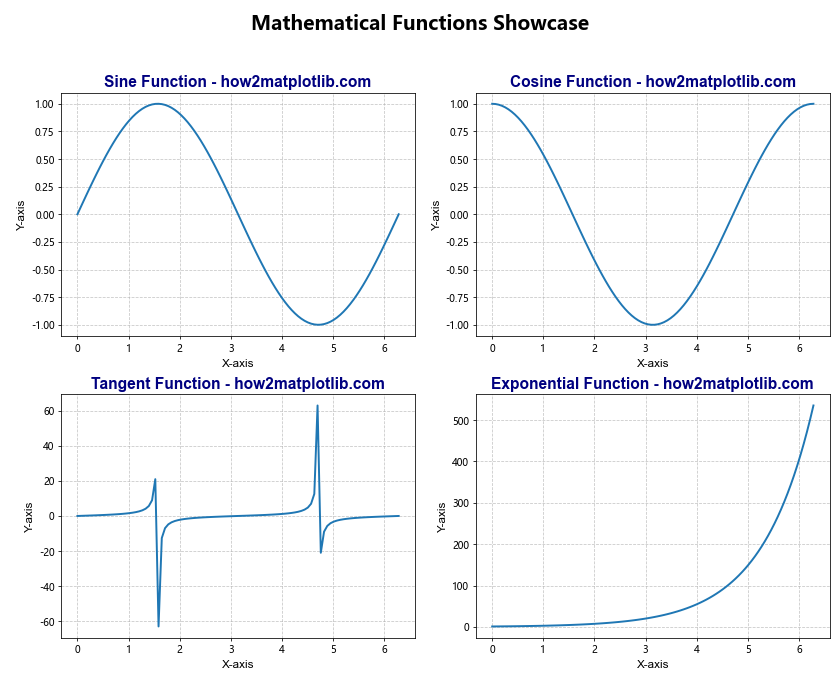
在这个例子中,我们为标题和轴标签定义了自定义的字体样式。我们还添加了网格线来增强可读性,并使用 tight_layout() 函数来自动调整子图的位置,以避免重叠。
4.3 添加文本注释
在某些情况下,我们可能需要在图表中添加额外的文本注释来解释特定的数据点或趋势:
import matplotlib.pyplot as plt
import numpy as np

# 创建一个图形和一个子图
fig, ax = plt.subplots(figsize=(10, 6))

# 生成数据
x = np.linspace(0, 10, 100)
y = np.sin(x) * np.exp(-0.1 * x)

# 绘制曲线
ax.plot(x, y, 'b-', linewidth=2)

# 添加标题和轴标签
ax.set_title('Damped Sine Wave with Annotations - how2matplotlib.com', fontsize=16)
ax.set_xlabel('Time', fontsize=12)
ax.set_ylabel('Amplitude', fontsize=12)

# 添加文本注释
ax.annotate('Peak', xy=(1.5, 0.9), xytext=(3, 0.8),
            arrowprops=dict(facecolor='black', shrink=0.05),
            fontsize=12)

ax.annotate('Decay', xy=(8, 0.1), xytext=(6, -0.2),
            arrowprops=dict(facecolor='red', shrink=0.05),
            fontsize=12, color='red')

# 添加文本框
ax.text(5, 0.5, 'y = sin(x) * exp(-0.1x)', fontsize=12,
        bbox=dict(facecolor='yellow', alpha=0.5))

plt.grid(True, linestyle='--', alpha=0.7)
plt.tight_layout()
plt.show()
Output:
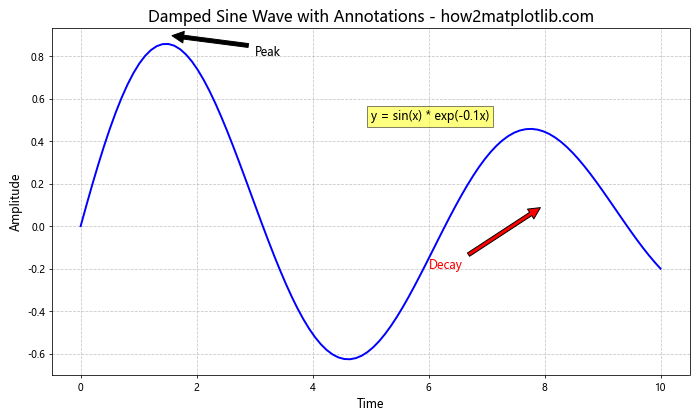
在这个例子中,我们使用 annotate() 函数添加了带箭头的注释,并使用 text() 函数添加了一个带背景的文本框。这些注释可以帮助读者更好地理解图表中的重要特征。
5. 结合其他 Matplotlib 功能
5.1 在子图中使用不同类型的图表
Matplotlib 支持多种类型的图表,我们可以在不同的子图中使用不同类型的图表来展示多样化的数据:
import matplotlib.pyplot as plt
import numpy as np

# 创建一个 2x2 的子图网格
fig, axes = plt.subplots(2, 2, figsize=(12, 10))

# 准备数据
x = np.linspace(0, 10, 100)
y1 = np.sin(x)
y2 = np.exp(-x/10)

# 1. 线图
axes[0, 0].plot(x, y1)
axes[0, 0].set_title('Line Plot - how2matplotlib.com')

# 2. 散点图
axes[0, 1].scatter(x, y2, c=y2, cmap='viridis')
axes[0, 1].set_title('Scatter Plot - how2matplotlib.com')

# 3. 条形图
categories = ['A', 'B', 'C', 'D']
values = [3, 7, 2, 5]
axes[1, 0].bar(categories, values)
axes[1, 0].set_title('Bar Plot - how2matplotlib.com')

# 4. 饼图
sizes = [15, 30, 45, 10]
axes[1, 1].pie(sizes, labels=categories, autopct='%1.1f%%', startangle=90)
axes[1, 1].set_title('Pie Chart - how2matplotlib.com')

plt.tight_layout()
plt.show()
Output:

这个例子展示了如何在一个图形中结合使用线图、散点图、条形图和饼图。这种方法可以帮助我们在一个视图中展示多种类型的数据或分析结果。
5.2 使用 3D 子图
Matplotlib 还支持 3D 绘图,我们可以在子图中创建 3D 图表:
import matplotlib.pyplot as plt
import numpy as np
from mpl_toolkits.mplot3d import Axes3D

# 创建一个 2x2 的子图网格,包括一个 3D 子图
fig = plt.figure(figsize=(12, 10))

ax1 = fig.add_subplot(221)
ax2 = fig.add_subplot(222, projection='3d')
ax3 = fig.add_subplot(223)
ax4 = fig.add_subplot(224)

# 1. 2D 等高线图
x = np.linspace(-5, 5, 100)
y = np.linspace(-5, 5, 100)
X, Y = np.meshgrid(x, y)
Z = np.sin(np.sqrt(X**2 + Y**2))
ax1.contourf(X, Y, Z, cmap='viridis')
ax1.set_title('Contour Plot - how2matplotlib.com')

# 2. 3D 表面图
ax2.plot_surface(X, Y, Z, cmap='viridis')
ax2.set_title('3D Surface Plot - how2matplotlib.com')

# 3. 2D 热图
ax3.imshow(Z, cmap='plasma', extent=[-5, 5, -5, 5])
ax3.set_title('Heatmap - how2matplotlib.com')

# 4. 2D 向量场
x, y = np.meshgrid(np.arange(-2, 2, 0.2), np.arange(-2, 2, 0.2))
u = np.cos(x)*y
v = np.sin(x)*y
ax4.quiver(x, y, u, v)
ax4.set_title('Vector Field - how2matplotlib.com')

plt.tight_layout()
plt.show()
Output:

这个例子展示了如何在一个图形中结合使用 2D 和 3D 图表,包括等高线图、3D 表面图、热图和向量场。这种组合可以帮助我们从不同角度分析和展示复杂的数据集。
6. 保存和导出图形
创建完图形后,我们通常需要保存或导出它们以便在其他地方使用。Matplotlib 提供了多种保存图形的方法:
import matplotlib.pyplot as plt
import numpy as np

# 创建一个简单的图形
fig, ax = plt.subplots(figsize=(8, 6))
x = np.linspace(0, 10, 100)
ax.plot(x, np.sin(x))
ax.set_title('Sine Wave - how2matplotlib.com')

# 保存为 PNG 文件
plt.savefig('sine_wave.png', dpi=300, bbox_inches='tight')

# 保存为 PDF 文件
plt.savefig('sine_wave.pdf', bbox_inches='tight')

# 保存为 SVG 文件
plt.savefig('sine_wave.svg', bbox_inches='tight')

plt.show()
Output:
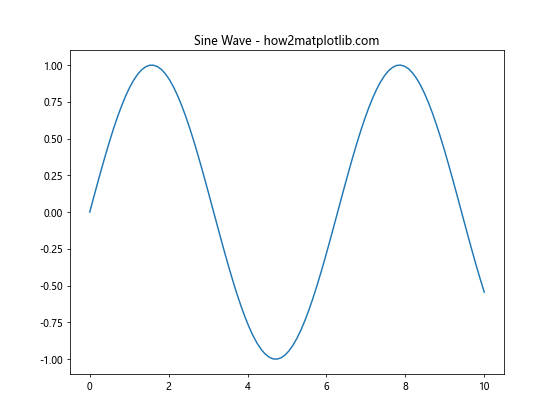
在这个例子中,我们展示了如何将同一个图形保存为不同的文件格式。dpi 参数控制图像的分辨率,bbox_inches='tight' 确保图形的所有部分都被包含在保存的文件中。
总结
本文详细介绍了如何使用 Matplotlib 中的 plt.subplots() 函数创建多子图布局,以及如何使用 title() 方法为图表设置标题。我们探讨了创建基本子图、调整子图布局、设置不同类型的标题、自定义样式等多个方面。此外,我们还讨论了如何结合其他 Matplotlib 功能,如使用不同类型的图表和 3D 绘图,以创建更复杂和信息丰富的可视化。
通过掌握这些技术,你可以创建出更专业、更具信息量的数据可视化,无论是用于数据分析、科学研究还是商业报告。记住,好的数据可视化不仅仅是展示数据,更是讲述数据背后的故事。通过合理使用子图布局和标题,你可以更有效地组织和传达复杂的信息。
继续实践和探索 Matplotlib 的其他功能,你会发现更多创造性的方式来展示你的数据。希望这篇文章能够帮助你更好地理解和使用 Matplotlib 中的 plt.subplots() 和 title() 功能,从而创建出更加出色的数据可视化作品。
 极客教程
极客教程