Matplotlib中XAxis.get_url()函数的全面指南与应用
参考:Matplotlib.axis.XAxis.get_url() in function Python
Matplotlib是Python中最流行的数据可视化库之一,它提供了丰富的绘图功能和自定义选项。在Matplotlib中,轴(Axis)是图表的重要组成部分,而XAxis.get_url()函数则是与X轴相关的一个特殊方法。本文将深入探讨XAxis.get_url()函数的用法、特点及其在Python数据可视化中的应用。
1. XAxis.get_url()函数简介
XAxis.get_url()是Matplotlib库中axis模块下XAxis类的一个方法。这个函数的主要作用是获取与X轴相关联的URL。在Matplotlib中,我们可以为图表的各个元素(如轴、标签、图例等)添加URL链接,这些链接可以在保存为特定格式(如SVG)的图表中被激活,允许用户通过点击进行交互。
让我们从一个简单的例子开始:
import matplotlib.pyplot as plt

fig, ax = plt.subplots()
ax.plot([1, 2, 3, 4], [1, 4, 2, 3], label='Data from how2matplotlib.com')
ax.set_xlabel('X-axis')
ax.set_ylabel('Y-axis')
ax.set_title('Simple Plot')

# 为X轴设置URL
ax.xaxis.set_url('https://how2matplotlib.com')

# 获取X轴的URL
url = ax.xaxis.get_url()
print(f"X-axis URL: {url}")

plt.show()
Output:
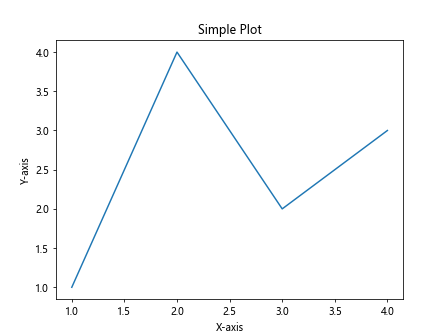
在这个例子中,我们首先创建了一个简单的线图,然后使用set_url()方法为X轴设置了一个URL。随后,我们使用get_url()方法获取并打印了这个URL。
2. XAxis.get_url()的工作原理
XAxis.get_url()函数本质上是一个getter方法,它返回之前通过set_url()方法设置的URL字符串。如果没有设置过URL,它将返回None。这个函数不接受任何参数,直接调用即可。
以下是一个更详细的示例,展示了get_url()的工作原理:
import matplotlib.pyplot as plt

fig, (ax1, ax2) = plt.subplots(2, 1, figsize=(8, 8))

# 第一个子图
ax1.plot([1, 2, 3, 4], [1, 4, 2, 3], label='Data from how2matplotlib.com')
ax1.set_title('Subplot 1 - With URL')
ax1.xaxis.set_url('https://how2matplotlib.com/xaxis')

# 第二个子图
ax2.plot([1, 2, 3, 4], [3, 1, 4, 2], label='More data from how2matplotlib.com')
ax2.set_title('Subplot 2 - Without URL')

# 获取并打印URL
print(f"Subplot 1 X-axis URL: {ax1.xaxis.get_url()}")
print(f"Subplot 2 X-axis URL: {ax2.xaxis.get_url()}")

plt.tight_layout()
plt.show()
Output:
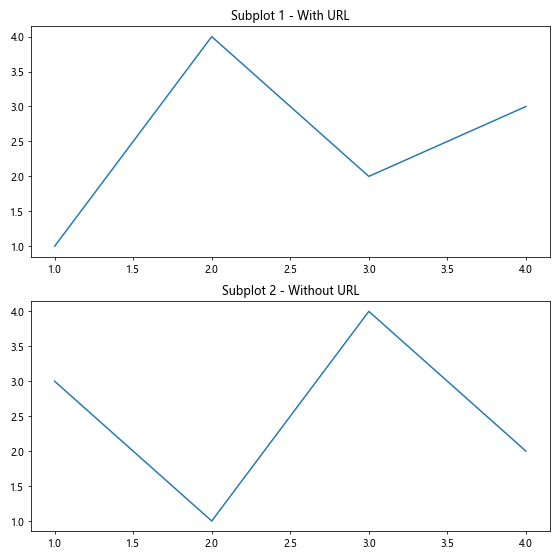
在这个例子中,我们创建了两个子图。第一个子图的X轴设置了URL,而第二个没有。当我们调用get_url()方法时,第一个子图返回了设置的URL,而第二个子图返回了None。
3. XAxis.get_url()的应用场景
XAxis.get_url()函数在以下几个场景中特别有用:
3.1 交互式图表
当创建交互式图表时,我们可能希望用户能够通过点击轴或标签来获取更多信息。在这种情况下,我们可以为轴设置URL,然后使用get_url()来验证或检索这些URL。
import matplotlib.pyplot as plt
from matplotlib.backends.backend_svg import FigureCanvasSVG

fig, ax = plt.subplots()
ax.plot([1, 2, 3, 4], [1, 4, 2, 3], label='Interactive data from how2matplotlib.com')
ax.set_xlabel('Click for more info')
ax.set_title('Interactive Plot')

# 设置交互式URL
ax.xaxis.set_url('https://how2matplotlib.com/interactive')

# 验证URL设置
print(f"X-axis URL: {ax.xaxis.get_url()}")

# 保存为SVG以支持交互
plt.savefig('interactive_plot.svg', format='svg')
plt.show()
Output:
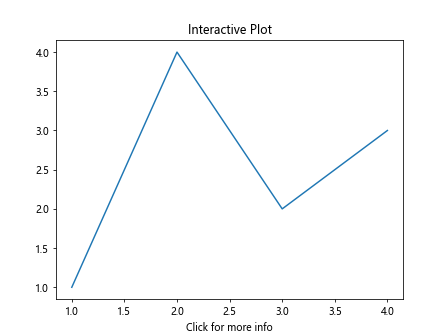
在这个例子中,我们为X轴设置了一个URL,并将图表保存为SVG格式。在支持SVG的查看器中,用户可以点击X轴标签来访问设置的URL。
3.2 图表元数据
get_url()方法也可以用于检索图表的元数据。例如,我们可能想要在图表中嵌入数据源的链接,或者指向更详细解释的页面。
import matplotlib.pyplot as plt

fig, ax = plt.subplots()
ax.plot([1, 2, 3, 4], [1, 4, 2, 3], label='Data from how2matplotlib.com')
ax.set_title('Plot with Metadata')

# 设置元数据URL
ax.xaxis.set_url('https://how2matplotlib.com/data_source')
ax.yaxis.set_url('https://how2matplotlib.com/methodology')

# 检索和打印元数据
print(f"Data source: {ax.xaxis.get_url()}")
print(f"Methodology: {ax.yaxis.get_url()}")

plt.show()
Output:
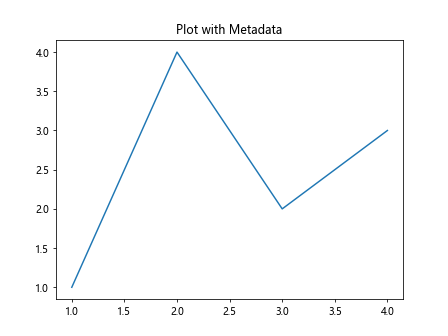
在这个例子中,我们为X轴和Y轴分别设置了不同的URL,代表数据源和方法论的链接。通过get_url()方法,我们可以轻松检索这些元数据信息。
3.3 动态URL生成
在某些情况下,我们可能需要根据数据动态生成URL。get_url()方法可以用来验证这些动态生成的URL是否正确设置。
import matplotlib.pyplot as plt
import random

def generate_url(data):
    return f"https://how2matplotlib.com/data/{sum(data)}"

fig, ax = plt.subplots()
data = [random.randint(1, 10) for _ in range(5)]
ax.bar(range(1, 6), data, label='Random data from how2matplotlib.com')
ax.set_title('Dynamic URL Generation')

# 动态生成并设置URL
url = generate_url(data)
ax.xaxis.set_url(url)

# 验证URL设置
print(f"Dynamically generated URL: {ax.xaxis.get_url()}")

plt.show()
Output:
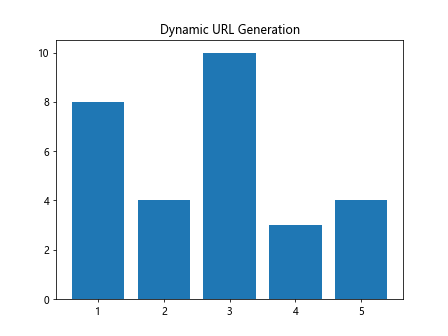
在这个例子中,我们根据随机生成的数据创建了一个动态URL,并将其设置为X轴的URL。然后使用get_url()方法来验证URL是否正确设置。
4. XAxis.get_url()与其他轴属性的结合使用
XAxis.get_url()方法通常与其他轴属性和方法结合使用,以创建更丰富的图表。以下是一些常见的组合:
4.1 结合轴标签
我们可以将URL与轴标签结合,为用户提供更多上下文信息:
import matplotlib.pyplot as plt

fig, ax = plt.subplots()
ax.plot([1, 2, 3, 4], [1, 4, 2, 3], label='Data from how2matplotlib.com')
ax.set_title('Combining URL with Axis Label')

# 设置带URL的X轴标签
ax.set_xlabel('X-axis (Click for info)')
ax.xaxis.set_url('https://how2matplotlib.com/x_axis_info')

# 打印标签和URL
print(f"X-axis label: {ax.get_xlabel()}")
print(f"X-axis URL: {ax.xaxis.get_url()}")

plt.show()
Output:
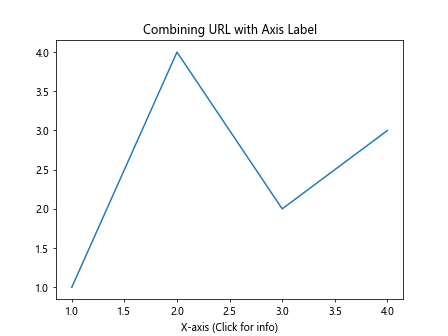
在这个例子中,我们为X轴设置了一个描述性的标签,并为其添加了一个URL。这样,用户可以通过点击轴标签获取更多信息。
4.2 与刻度标签结合
我们还可以为特定的刻度标签设置URL:
import matplotlib.pyplot as plt

fig, ax = plt.subplots()
ax.plot([1, 2, 3, 4], [1, 4, 2, 3], label='Data from how2matplotlib.com')
ax.set_title('URLs for Specific Tick Labels')

# 设置刻度标签和URL
ticks = [1, 2, 3, 4]
labels = ['A', 'B', 'C', 'D']
urls = [f'https://how2matplotlib.com/data/{label}' for label in labels]

ax.set_xticks(ticks)
ax.set_xticklabels(labels)

for label, url in zip(ax.get_xticklabels(), urls):
    label.set_url(url)

# 验证URL设置
for label in ax.get_xticklabels():
    print(f"Label {label.get_text()} URL: {label.get_url()}")

plt.show()
Output:
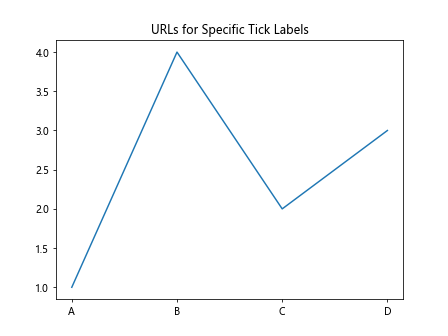
在这个例子中,我们为每个X轴刻度标签设置了不同的URL。这允许用户点击特定的刻度标签来获取与该数据点相关的信息。
4.3 与图例结合
我们可以为图例中的元素设置URL,并使用get_url()方法进行验证:
import matplotlib.pyplot as plt

fig, ax = plt.subplots()
line, = ax.plot([1, 2, 3, 4], [1, 4, 2, 3], label='Data from how2matplotlib.com')
ax.set_title('URL in Legend')

# 创建图例并设置URL
legend = ax.legend()
legend.get_texts()[0].set_url('https://how2matplotlib.com/legend_info')

# 验证图例URL设置
print(f"Legend URL: {legend.get_texts()[0].get_url()}")

# 对比X轴URL(未设置)
print(f"X-axis URL: {ax.xaxis.get_url()}")

plt.show()
Output:
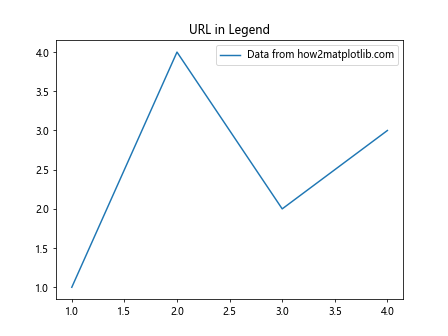
在这个例子中,我们为图例中的文本设置了URL,而不是为X轴设置URL。这展示了get_url()方法在不同图表元素中的应用。
5. XAxis.get_url()在不同类型图表中的应用
XAxis.get_url()方法可以应用于各种类型的图表。以下是一些常见图表类型的示例:
5.1 散点图
import matplotlib.pyplot as plt
import numpy as np

fig, ax = plt.subplots()
x = np.random.rand(50)
y = np.random.rand(50)
colors = np.random.rand(50)
sizes = 1000 * np.random.rand(50)

scatter = ax.scatter(x, y, c=colors, s=sizes, alpha=0.5, label='Scatter data from how2matplotlib.com')
ax.set_title('Scatter Plot with URL')

# 设置X轴URL
ax.xaxis.set_url('https://how2matplotlib.com/scatter_plot')

# 验证URL设置
print(f"Scatter plot X-axis URL: {ax.xaxis.get_url()}")

plt.colorbar(scatter)
plt.show()
Output:
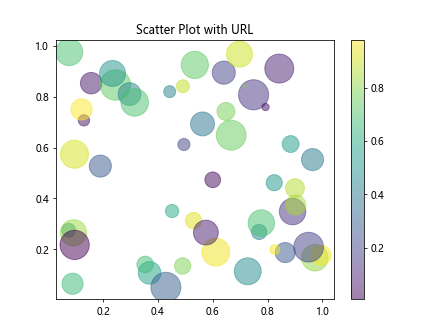
在这个散点图例子中,我们为X轴设置了一个URL,可能链接到解释散点图数据分布的页面。
5.2 柱状图
import matplotlib.pyplot as plt
import numpy as np

fig, ax = plt.subplots()
categories = ['A', 'B', 'C', 'D', 'E']
values = np.random.randint(1, 100, size=5)

ax.bar(categories, values, label='Bar data from how2matplotlib.com')
ax.set_title('Bar Chart with URL')

# 为每个柱子设置不同的URL
for i, rect in enumerate(ax.patches):
    rect.set_url(f'https://how2matplotlib.com/bar/{categories[i]}')

# 验证URL设置
for i, rect in enumerate(ax.patches):
    print(f"Bar {categories[i]} URL: {rect.get_url()}")

# X轴URL
ax.xaxis.set_url('https://how2matplotlib.com/bar_chart')
print(f"X-axis URL: {ax.xaxis.get_url()}")

plt.show()
Output:
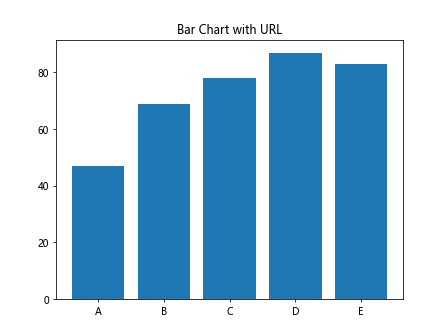
在这个柱状图例子中,我们不仅为X轴设置了URL,还为每个柱子单独设置了URL。这允许用户点击特定的柱子获取更多信息。
5.3 折线图
import matplotlib.pyplot as plt
import numpy as np

fig, ax = plt.subplots()
x = np.linspace(0, 10, 100)
y1 = np.sin(x)
y2 = np.cos(x)

line1, = ax.plot(x, y1, label='Sin curve from how2matplotlib.com')
line2, = ax.plot(x, y2, label='Cos curve from how2matplotlib.com')
ax.set_title('Line Plot with URLs')

# 为线条设置URL
line1.set_url('https://how2matplotlib.com/sin_curve')
line2.set_url('https://how2matplotlib.com/cos_curve')

# X轴URL
ax.xaxis.set_url('https://how2matplotlib.com/line_plot')

# 验证URL设置
print(f"Sin curve URL: {line1.get_url()}")
print(f"Cos curve URL: {line2.get_url()}")
print(f"X-axis URL: {ax.xaxis.get_url()}")

plt.legend()
plt.show()
Output:
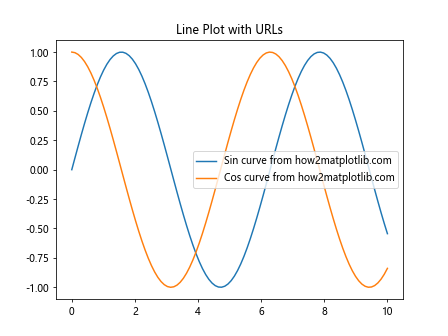
在这个折线图例子中,我们为两条线和X轴分别设置了不同的URL。这种方法可以用于提供每条线代表的数据的详细信息。
5.4 饼图
import matplotlib.pyplot as plt

fig, ax = plt.subplots()
sizes = [30,30, 20, 15, 10]
labels = ['A', 'B', 'C', 'D', 'E']
explode = (0, 0.1, 0, 0, 0)

patches, texts, autotexts = ax.pie(sizes, explode=explode, labels=labels, autopct='%1.1f%%',
                                   shadow=True, startangle=90)
ax.axis('equal')
ax.set_title('Pie Chart with URLs')

# 为每个扇形设置URL
for i, patch in enumerate(patches):
    patch.set_url(f'https://how2matplotlib.com/pie/{labels[i]}')

# 验证URL设置
for i, patch in enumerate(patches):
    print(f"Slice {labels[i]} URL: {patch.get_url()}")

plt.show()
Output:
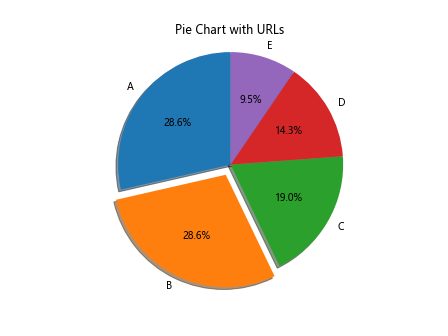
在这个饼图例子中,我们为每个扇形设置了独立的URL。虽然饼图没有传统意义上的X轴,但我们仍然可以为图表的各个部分添加URL。
6. XAxis.get_url()在动态图表中的应用
XAxis.get_url()方法也可以在动态更新的图表中使用,例如在动画或实时数据可视化中。以下是一些示例:
6.1 动画图表
import matplotlib.pyplot as plt
import matplotlib.animation as animation
import numpy as np

fig, ax = plt.subplots()
x = np.arange(0, 2*np.pi, 0.01)
line, = ax.plot(x, np.sin(x))

def animate(i):
    line.set_ydata(np.sin(x + i/10.0))
    return line,

def init():
    line.set_ydata(np.ma.array(x, mask=True))
    return line,

ani = animation.FuncAnimation(fig, animate, np.arange(1, 200), init_func=init,
                              interval=25, blit=True)

ax.set_title('Animated Plot with URL')
ax.xaxis.set_url('https://how2matplotlib.com/animated_plot')

print(f"Animated plot X-axis URL: {ax.xaxis.get_url()}")

plt.show()
Output:
在这个动画图表的例子中,我们为X轴设置了一个静态URL。即使图表在动态更新,URL仍然保持不变。
6.2 实时数据更新
import matplotlib.pyplot as plt
import numpy as np
from matplotlib.animation import FuncAnimation

fig, ax = plt.subplots()
x_data = []
y_data = []
line, = ax.plot([], [], 'r-')

ax.set_xlim(0, 100)
ax.set_ylim(-1, 1)
ax.set_title('Real-time Data Plot with URL')

def init():
    return line,

def update(frame):
    x_data.append(frame)
    y_data.append(np.sin(frame * 0.1))
    line.set_data(x_data, y_data)
    return line,

ani = FuncAnimation(fig, update, frames=np.linspace(0, 100, 100),
                    init_func=init, blit=True)

ax.xaxis.set_url('https://how2matplotlib.com/realtime_data')

print(f"Real-time plot X-axis URL: {ax.xaxis.get_url()}")

plt.show()
Output:
在这个实时数据更新的例子中,我们模拟了一个不断接收新数据点的场景。尽管数据在不断更新,X轴的URL保持不变。
7. XAxis.get_url()的高级应用
除了基本用法外,XAxis.get_url()还可以在一些高级场景中发挥作用:
7.1 多轴图表
import matplotlib.pyplot as plt
import numpy as np

fig, (ax1, ax2) = plt.subplots(2, 1, figsize=(8, 8))

# 第一个子图
x1 = np.linspace(0, 10, 100)
ax1.plot(x1, np.sin(x1), label='Sin curve from how2matplotlib.com')
ax1.set_title('Upper Plot')
ax1.xaxis.set_url('https://how2matplotlib.com/upper_plot')

# 第二个子图
x2 = np.linspace(0, 10, 100)
ax2.plot(x2, np.cos(x2), label='Cos curve from how2matplotlib.com')
ax2.set_title('Lower Plot')
ax2.xaxis.set_url('https://how2matplotlib.com/lower_plot')

# 验证URL设置
print(f"Upper plot X-axis URL: {ax1.xaxis.get_url()}")
print(f"Lower plot X-axis URL: {ax2.xaxis.get_url()}")

plt.tight_layout()
plt.show()
Output:
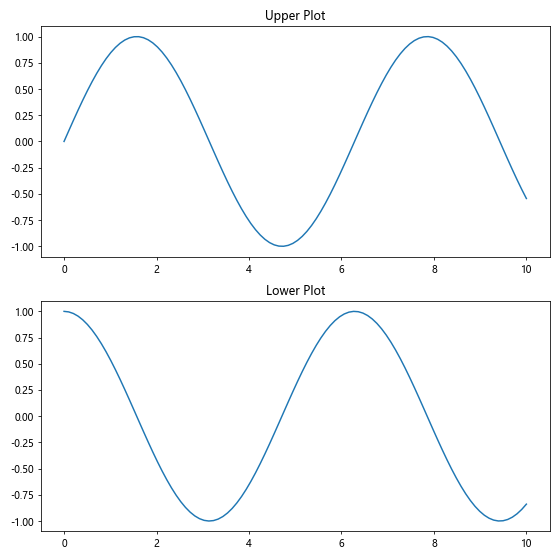
在这个多轴图表的例子中,我们为两个子图的X轴分别设置了不同的URL。这允许我们为不同的数据集提供独立的参考链接。
7.2 3D图表
import matplotlib.pyplot as plt
import numpy as np
from mpl_toolkits.mplot3d import Axes3D

fig = plt.figure()
ax = fig.add_subplot(111, projection='3d')

# 生成数据
x = np.arange(-5, 5, 0.25)
y = np.arange(-5, 5, 0.25)
x, y = np.meshgrid(x, y)
r = np.sqrt(x**2 + y**2)
z = np.sin(r)

# 绘制3D表面
surf = ax.plot_surface(x, y, z, cmap='viridis')

ax.set_title('3D Surface Plot with URL')
ax.set_xlabel('X axis')
ax.set_ylabel('Y axis')
ax.set_zlabel('Z axis')

# 为X轴设置URL
ax.xaxis.set_url('https://how2matplotlib.com/3d_plot')

# 验证URL设置
print(f"3D plot X-axis URL: {ax.xaxis.get_url()}")

plt.show()
Output:
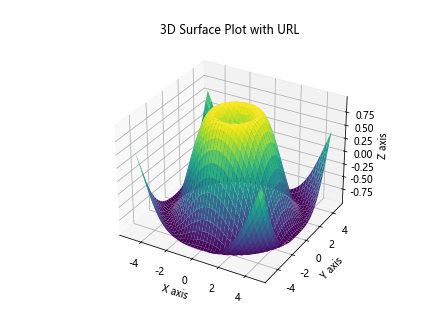
在这个3D图表的例子中,我们为X轴设置了URL。虽然3D图表的交互性更复杂,但URL仍然可以用于提供额外的信息或链接。
7.3 自定义坐标系
import matplotlib.pyplot as plt
import numpy as np

fig, ax = plt.subplots()

# 创建极坐标系
r = np.arange(0, 2, 0.01)
theta = 2 * np.pi * r

ax.plot(theta, r, label='Spiral from how2matplotlib.com')
ax.set_rmax(2)
ax.set_rticks([0.5, 1, 1.5, 2])
ax.set_rlabel_position(-22.5)
ax.grid(True)

ax.set_title("Polar Plot with URL")

# 为径向轴设置URL
ax.xaxis.set_url('https://how2matplotlib.com/polar_plot')

# 验证URL设置
print(f"Polar plot radial axis URL: {ax.xaxis.get_url()}")

plt.show()
在这个极坐标系的例子中,我们为径向轴设置了URL。这展示了XAxis.get_url()方法在非笛卡尔坐标系中的应用。
8. XAxis.get_url()的注意事项和最佳实践
在使用XAxis.get_url()方法时,有一些注意事项和最佳实践需要考虑:
- URL可见性:请记住,设置的URL在大多数情况下对用户是不可见的,除非图表被保存为支持交互的格式(如SVG)。
-
合适的URL:确保设置的URL是相关且有用的。避免使用过长或复杂的URL。
-
安全性:如果您的图表将被公开分享,请确保URL不包含敏感信息。
-
一致性:在整个图表或一系列图表中保持URL使用的一致性,以提供良好的用户体验。
-
文档化:在图表的说明或文档中提及URL的存在和用途,以便用户知道如何利用这些链接。
-
测试:在不同的查看器和平台上测试URL的功能,确保它们在各种环境中都能正常工作。
-
更新维护:定期检查和更新URL,确保它们始终指向有效的资源。
9. 结论
XAxis.get_url()函数是Matplotlib库中一个强大而灵活的工具,它允许我们为图表的X轴添加额外的元数据和交互性。通过本文的详细介绍和多样化的示例,我们看到了这个函数在各种图表类型和应用场景中的潜力。
从简单的静态图表到复杂的动态可视化,XAxis.get_url()都可以发挥作用,为用户提供更丰富的信息和更好的交互体验。无论是用于数据源引用、方法论说明,还是提供更深入的分析链接,这个函数都能满足多样化的需求。
在实际应用中,合理使用XAxis.get_url()可以显著提升数据可视化的信息量和用户体验。然而,也要注意合理使用,避免过度复杂化图表。通过遵循最佳实践和注意事项,我们可以充分发挥这个功能的潜力,创造出既信息丰富又易于理解的数据可视化作品。
随着数据可视化领域的不断发展,像XAxis.get_url()这样的功能将在未来扮演越来越重要的角色,为数据分析和展示提供更多可能性。
 极客教程
极客教程