Matplotlib中XAxis.get_figure()函数的全面指南与应用
参考:Matplotlib.axis.XAxis.get_figure() function in Python
Matplotlib是Python中最流行的数据可视化库之一,它提供了丰富的绘图功能和灵活的API。在Matplotlib的众多组件中,轴(Axis)是非常重要的一部分,它负责管理图表的刻度、标签和范围等属性。本文将深入探讨Matplotlib中axis.XAxis.get_figure()函数的用法、特性和应用场景,帮助读者更好地理解和使用这个强大的工具。
1. XAxis.get_figure()函数简介
XAxis.get_figure()是Matplotlib库中axis.XAxis类的一个方法。这个函数的主要作用是获取与当前X轴对象相关联的Figure对象。通过这个函数,我们可以方便地访问和操作整个图表,而不仅仅局限于X轴本身。
让我们来看一个简单的示例:
import matplotlib.pyplot as plt

# 创建一个新的Figure和Axes
fig, ax = plt.subplots()

# 绘制一些数据
ax.plot([1, 2, 3, 4], [1, 4, 2, 3], label='Data from how2matplotlib.com')

# 获取X轴对象
x_axis = ax.xaxis

# 使用get_figure()获取Figure对象
figure = x_axis.get_figure()

# 设置Figure的标题
figure.suptitle('Figure obtained from XAxis.get_figure()')

plt.show()
Output:

在这个例子中,我们首先创建了一个Figure和Axes,然后绘制了一些数据。接着,我们获取了X轴对象,并使用get_figure()方法获取了与之关联的Figure对象。最后,我们使用这个Figure对象设置了整个图表的标题。
2. XAxis.get_figure()的工作原理
要理解XAxis.get_figure()的工作原理,我们需要先了解Matplotlib的图表层次结构。在Matplotlib中,Figure是最顶层的容器,它可以包含一个或多个Axes(子图)。每个Axes又包含了XAxis和YAxis对象,用于管理X轴和Y轴的属性。
当我们调用XAxis.get_figure()时,Matplotlib会沿着这个层次结构向上查找,直到找到包含当前XAxis对象的Figure。这个过程是自动的,我们不需要手动指定任何参数。
下面是一个更详细的示例,展示了这个层次结构:
import matplotlib.pyplot as plt

# 创建一个2x2的子图网格
fig, axs = plt.subplots(2, 2)

# 在每个子图中绘制一些数据
for i, ax in enumerate(axs.flat):
    ax.plot([1, 2, 3, 4], [i+1, i+2, i+3, i+4], label=f'Data {i+1} from how2matplotlib.com')
    ax.set_title(f'Subplot {i+1}')

# 获取左上角子图的X轴对象
x_axis = axs[0, 0].xaxis

# 使用get_figure()获取Figure对象
figure = x_axis.get_figure()

# 设置Figure的整体标题
figure.suptitle('Multiple subplots in one Figure')

plt.tight_layout()
plt.show()
Output:
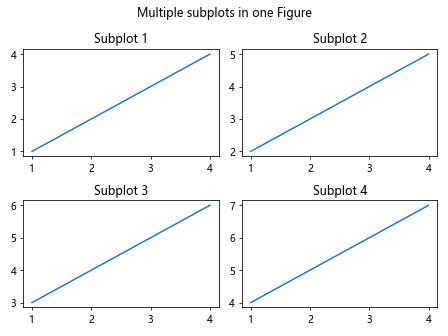
在这个例子中,我们创建了一个2×2的子图网格,并在每个子图中绘制了不同的数据。然后,我们获取了左上角子图的X轴对象,并使用get_figure()方法获取了整个Figure对象。最后,我们为整个Figure设置了一个总标题。
3. XAxis.get_figure()的常见应用场景
3.1 调整整个图表的属性
使用XAxis.get_figure()获取Figure对象后,我们可以方便地调整整个图表的属性,如大小、背景色等。
import matplotlib.pyplot as plt

fig, ax = plt.subplots()
ax.plot([1, 2, 3, 4], [1, 4, 2, 3], label='Data from how2matplotlib.com')

x_axis = ax.xaxis
figure = x_axis.get_figure()

# 调整Figure的大小
figure.set_size_inches(10, 6)

# 设置Figure的背景色
figure.patch.set_facecolor('#f0f0f0')

plt.show()
Output:
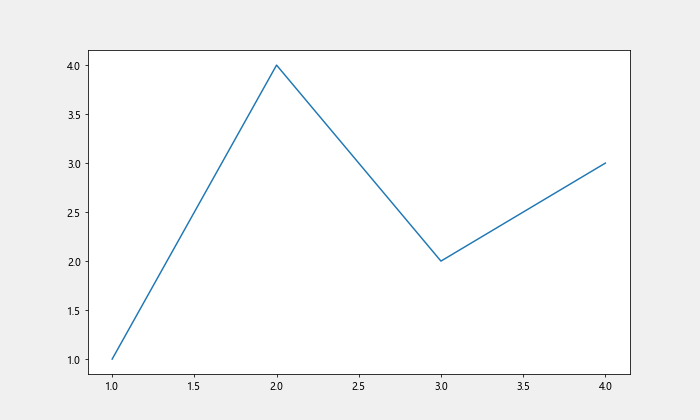
在这个例子中,我们通过set_size_inches()方法调整了Figure的大小,并使用patch.set_facecolor()方法设置了背景色。
3.2 添加新的子图
我们可以使用XAxis.get_figure()获取的Figure对象来添加新的子图:
import matplotlib.pyplot as plt

fig, ax = plt.subplots()
ax.plot([1, 2, 3, 4], [1, 4, 2, 3], label='Data from how2matplotlib.com')

x_axis = ax.xaxis
figure = x_axis.get_figure()

# 添加一个新的子图
new_ax = figure.add_subplot(212)
new_ax.plot([1, 2, 3, 4], [4, 3, 2, 1], label='New data from how2matplotlib.com')

plt.tight_layout()
plt.show()
Output:
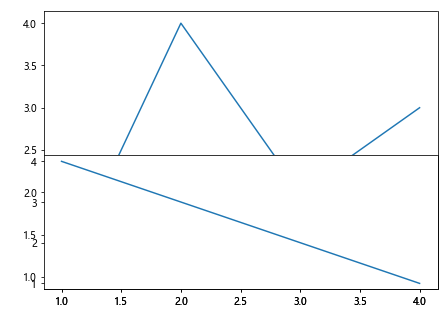
在这个例子中,我们使用add_subplot()方法在原有图表下方添加了一个新的子图。
3.3 保存图表
通过XAxis.get_figure()获取的Figure对象,我们可以方便地保存整个图表:
import matplotlib.pyplot as plt

fig, ax = plt.subplots()
ax.plot([1, 2, 3, 4], [1, 4, 2, 3], label='Data from how2matplotlib.com')

x_axis = ax.xaxis
figure = x_axis.get_figure()

# 保存图表
figure.savefig('my_plot.png', dpi=300, bbox_inches='tight')

plt.show()
Output:
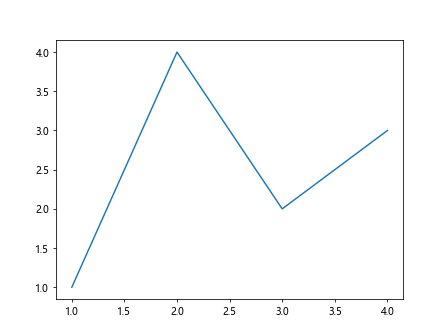
在这个例子中,我们使用savefig()方法将图表保存为PNG格式的文件,并设置了DPI(每英寸点数)和边界裁剪选项。
4. XAxis.get_figure()与其他Matplotlib组件的交互
4.1 与Legend的交互
我们可以使用XAxis.get_figure()获取的Figure对象来调整图例的位置:
import matplotlib.pyplot as plt

fig, ax = plt.subplots()
ax.plot([1, 2, 3, 4], [1, 4, 2, 3], label='Data from how2matplotlib.com')
ax.legend()

x_axis = ax.xaxis
figure = x_axis.get_figure()

# 调整图例位置
figure.legend(loc='upper left', bbox_to_anchor=(0.1, 0.9))

plt.show()
Output:

在这个例子中,我们使用figure.legend()方法重新设置了图例的位置。
4.2 与Colorbar的交互
当我们使用颜色映射(colormap)时,可以通过XAxis.get_figure()获取的Figure对象来添加颜色条:
import matplotlib.pyplot as plt
import numpy as np

fig, ax = plt.subplots()
data = np.random.rand(10, 10)
im = ax.imshow(data, cmap='viridis')

x_axis = ax.xaxis
figure = x_axis.get_figure()

# 添加颜色条
cbar = figure.colorbar(im)
cbar.set_label('Data from how2matplotlib.com')

plt.show()
Output:
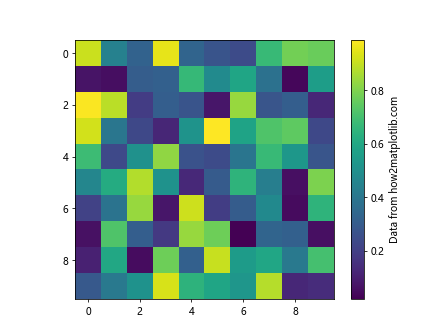
在这个例子中,我们使用figure.colorbar()方法为热图添加了一个颜色条。
4.3 与Annotation的交互
我们可以使用XAxis.get_figure()获取的Figure对象来添加跨越多个子图的注释:
import matplotlib.pyplot as plt

fig, (ax1, ax2) = plt.subplots(1, 2, figsize=(10, 4))
ax1.plot([1, 2, 3, 4], [1, 4, 2, 3])
ax2.plot([1, 2, 3, 4], [3, 2, 4, 1])

x_axis = ax1.xaxis
figure = x_axis.get_figure()

# 添加跨越子图的注释
figure.text(0.5, 0.95, 'Data from how2matplotlib.com', ha='center', va='top')

plt.show()
Output:
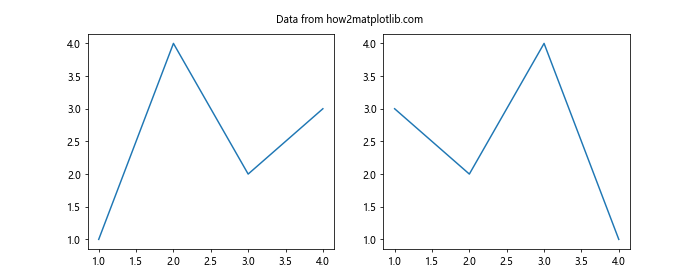
在这个例子中,我们使用figure.text()方法在Figure的顶部添加了一个居中的文本注释。
5. XAxis.get_figure()在复杂图表中的应用
5.1 创建子图网格
在复杂的图表布局中,XAxis.get_figure()可以帮助我们更灵活地管理子图:
import matplotlib.pyplot as plt
import matplotlib.gridspec as gridspec

fig = plt.figure(figsize=(12, 8))
gs = gridspec.GridSpec(3, 3)

ax1 = fig.add_subplot(gs[0, :])
ax2 = fig.add_subplot(gs[1, :-1])
ax3 = fig.add_subplot(gs[1:, -1])
ax4 = fig.add_subplot(gs[-1, 0])
ax5 = fig.add_subplot(gs[-1, -2])

ax1.plot([1, 2, 3, 4], [1, 4, 2, 3], label='Data 1 from how2matplotlib.com')
ax2.plot([1, 2, 3, 4], [3, 1, 4, 2], label='Data 2 from how2matplotlib.com')
ax3.plot([1, 2, 3, 4], [2, 3, 1, 4], label='Data 3 from how2matplotlib.com')
ax4.plot([1, 2, 3, 4], [4, 2, 3, 1], label='Data 4 from how2matplotlib.com')
ax5.plot([1, 2, 3, 4], [1, 3, 2, 4], label='Data 5 from how2matplotlib.com')

x_axis = ax1.xaxis
figure = x_axis.get_figure()

figure.suptitle('Complex layout with GridSpec')

plt.tight_layout()
plt.show()
Output:
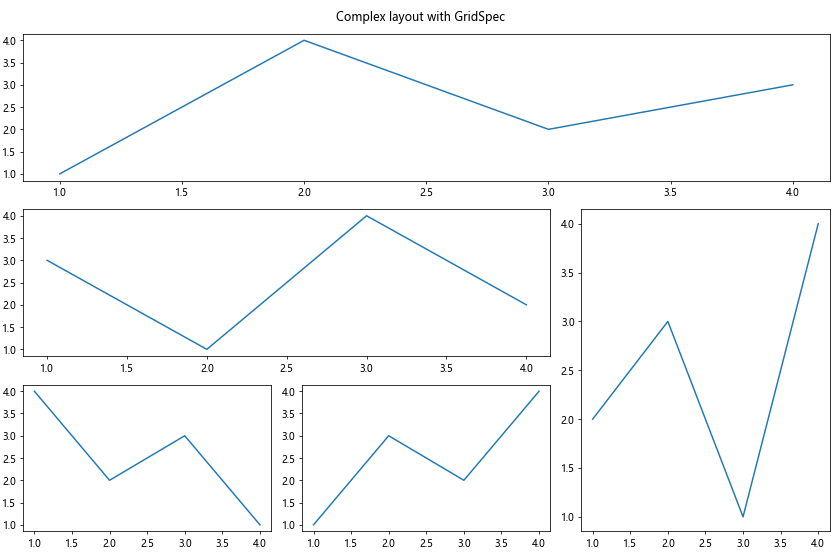
在这个例子中,我们使用GridSpec创建了一个复杂的子图布局,然后通过XAxis.get_figure()获取Figure对象并设置了总标题。
5.2 添加共享的colorbar
对于包含多个子图的复杂图表,我们可以使用XAxis.get_figure()来添加一个共享的colorbar:
import matplotlib.pyplot as plt
import numpy as np

fig, (ax1, ax2) = plt.subplots(1, 2, figsize=(10, 4))

data1 = np.random.rand(10, 10)
data2 = np.random.rand(10, 10)

im1 = ax1.imshow(data1, cmap='viridis')
im2 = ax2.imshow(data2, cmap='viridis')

x_axis = ax1.xaxis
figure = x_axis.get_figure()

# 添加共享的colorbar
cbar = figure.colorbar(im1, ax=[ax1, ax2])
cbar.set_label('Data from how2matplotlib.com')

plt.tight_layout()
plt.show()
Output:
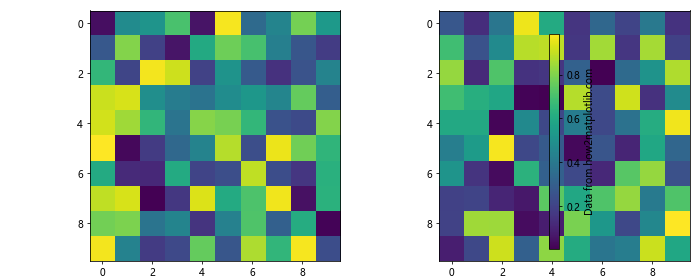
在这个例子中,我们为两个子图创建了一个共享的colorbar,并使用figure.colorbar()方法将其添加到Figure中。
5.3 创建嵌套的子图
XAxis.get_figure()还可以帮助我们创建嵌套的子图结构:
import matplotlib.pyplot as plt

fig = plt.figure(figsize=(12, 8))

# 创建主要的子图
ax1 = fig.add_subplot(221)
ax2 = fig.add_subplot(222)
ax3 = fig.add_subplot(223)
ax4 = fig.add_subplot(224)

# 在ax4中创建嵌套的子图
x_axis = ax4.xaxis
figure = x_axis.get_figure()
inner_ax = figure.add_axes([0.6, 0.6, 0.3, 0.3])

ax1.plot([1, 2, 3, 4], [1, 4, 2, 3], label='Data 1 from how2matplotlib.com')
ax2.plot([1, 2, 3, 4], [3, 1, 4, 2], label='Data 2 from how2matplotlib.com')
ax3.plot([1, 2, 3, 4], [2, 3, 1, 4], label='Data 3 from how2matplotlib.com')
ax4.plot([1, 2, 3, 4], [4, 2, 3, 1], label='Data 4 from how2matplotlib.com')
inner_ax.plot([1, 2, 3, 4], [1, 3, 2, 4], label='Nested data from how2matplotlib.com')

plt.tight_layout()
plt.show()
Output:
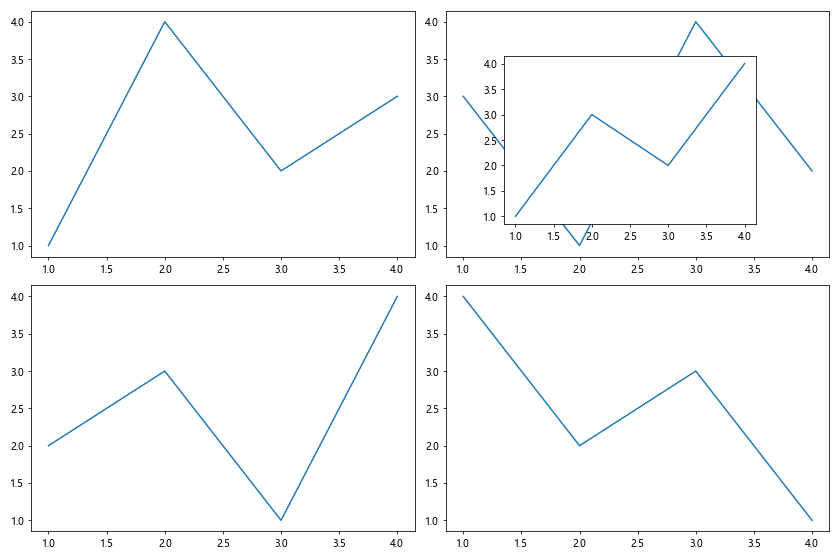
在这个例子中,我们使用figure.add_axes()方法在一个子图内创建了一个嵌套的小图。
6. XAxis.get_figure()的高级技巧
6.1 动态调整子图布局
使用XAxis.get_figure(),我们可以在运行时动态调整子图的布局:
import matplotlib.pyplot as plt

fig, (ax1, ax2) = plt.subplots(2, 1, figsize=(8, 8))

ax1.plot([1, 2, 3, 4], [1, 4, 2, 3], label='Data 1 from how2matplotlib.com')
ax2.plot([1, 2, 3, 4], [3, 1, 4, 2], label='Data 2 from how2matplotlib.com')

x_axis = ax1.xaxis
figure = x_figure()

# 动态调整子图布局
figure.subplots_adjust(hspace=0.5)

plt.show()
在这个例子中,我们使用figure.subplots_adjust()方法动态调整了子图之间的垂直间距。
6.2 添加自定义图例
我们可以使用XAxis.get_figure()来创建一个自定义的图例,并将其放置在Figure的任意位置:
import matplotlib.pyplot as plt
import matplotlib.patches as patches

fig, ax = plt.subplots()

ax.plot([1, 2, 3, 4], [1, 4, 2, 3], label='Data from how2matplotlib.com')

x_axis = ax.xaxis
figure = x_axis.get_figure()

# 创建自定义图例
legend_elements = [patches.Patch(facecolor='red', edgecolor='r', label='Red'),
                   patches.Patch(facecolor='green', edgecolor='g', label='Green'),
                   patches.Patch(facecolor='blue', edgecolor='b', label='Blue')]

figure.legend(handles=legend_elements, loc='center right', bbox_to_anchor=(1.2, 0.5))

plt.tight_layout()
plt.show()
Output:
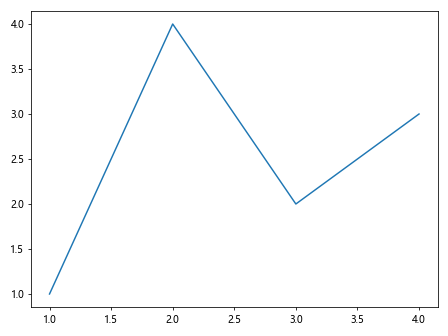
在这个例子中,我们创建了一个包含自定义颜色块的图例,并使用figure.legend()方法将其放置在Figure的右侧。
6.3 创建交互式图表
结合XAxis.get_figure()和Matplotlib的事件处理系统,我们可以创建交互式图表:
import matplotlib.pyplot as plt

fig, ax = plt.subplots()

ax.plot([1, 2, 3, 4], [1, 4, 2, 3], label='Data from how2matplotlib.com')

x_axis = ax.xaxis
figure = x_axis.get_figure()

def on_click(event):
    if event.inaxes == ax:
        ax.text(event.xdata, event.ydata, f'Clicked: ({event.xdata:.2f}, {event.ydata:.2f})')
        figure.canvas.draw()

figure.canvas.mpl_connect('button_press_event', on_click)

plt.show()
Output:
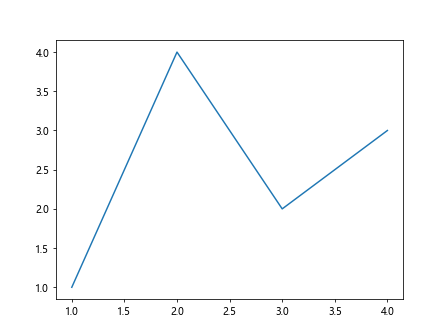
在这个例子中,我们定义了一个点击事件处理函数,当用户点击图表时,会在点击位置显示坐标信息。
7. XAxis.get_figure()的性能考虑
虽然XAxis.get_figure()是一个非常有用的方法,但在处理大量数据或复杂图表时,我们需要注意一些性能问题:
7.1 缓存Figure对象
如果需要多次使用Figure对象,最好将其缓存起来,而不是每次都调用get_figure():
import matplotlib.pyplot as plt

fig, ax = plt.subplots()

ax.plot([1, 2, 3, 4], [1, 4, 2, 3], label='Data from how2matplotlib.com')

x_axis = ax.xaxis
figure = x_axis.get_figure()  # 只调用一次get_figure()

# 多次使用figure对象
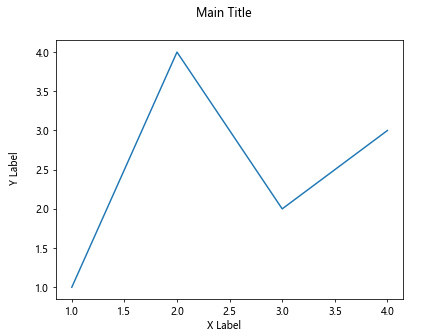
figure.suptitle('Main Title')
figure.text(0.5, 0.02, 'X Label', ha='center')
figure.text(0.02, 0.5, 'Y Label', va='center', rotation='vertical')

plt.show()
Output:
7.2 避免频繁更新
在交互式应用中,避免频繁调用figure.canvas.draw(),因为这可能会导致性能下降:
import matplotlib.pyplot as plt
import numpy as np

fig, ax = plt.subplots()

x_axis = ax.xaxis
figure = x_axis.get_figure()

line, = ax.plot([], [], label='Data from how2matplotlib.com')

def update(frame):
    x = np.linspace(0, 2*np.pi, 100)
    y = np.sin(x + frame/10)
    line.set_data(x, y)
    ax.relim()
    ax.autoscale_view()
    return line,

from matplotlib.animation import FuncAnimation
ani = FuncAnimation(figure, update, frames=100, blit=True)

plt.show()
Output:
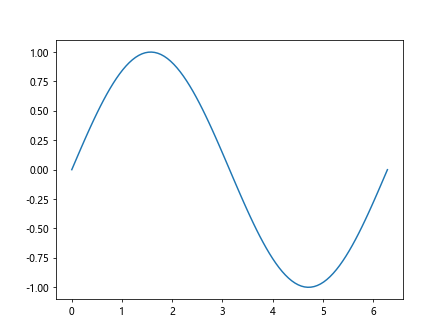
在这个例子中,我们使用FuncAnimation创建了一个动画,而不是手动更新图表。
8. XAxis.get_figure()的常见问题和解决方案
8.1 处理多个Figure
当处理多个Figure时,确保使用正确的XAxis对象:
import matplotlib.pyplot as plt

fig1, ax1 = plt.subplots()
fig2, ax2 = plt.subplots()

ax1.plot([1, 2, 3, 4], [1, 4, 2, 3], label='Data 1 from how2matplotlib.com')
ax2.plot([1, 2, 3, 4], [3, 1, 4, 2], label='Data 2 from how2matplotlib.com')

x_axis1 = ax1.xaxis
x_axis2 = ax2.xaxis

figure1 = x_axis1.get_figure()
figure2 = x_axis2.get_figure()

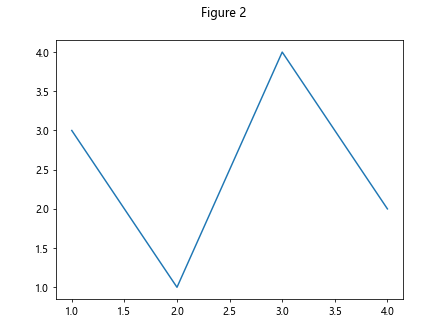
figure1.suptitle('Figure 1')
figure2.suptitle('Figure 2')

plt.show()
Output:
8.2 处理子图中的XAxis
在处理子图时,确保使用正确的子图的XAxis:
import matplotlib.pyplot as plt

fig, (ax1, ax2) = plt.subplots(1, 2)

ax1.plot([1, 2, 3, 4], [1, 4, 2, 3], label='Data 1 from how2matplotlib.com')
ax2.plot([1, 2, 3, 4], [3, 1, 4, 2], label='Data 2 from how2matplotlib.com')

x_axis1 = ax1.xaxis
x_axis2 = ax2.xaxis

figure1 = x_axis1.get_figure()
figure2 = x_axis2.get_figure()

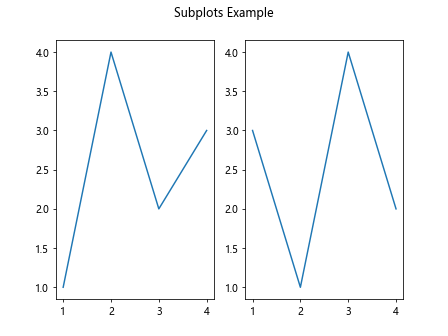
# figure1 和 figure2 实际上是同一个Figure对象
assert figure1 is figure2

figure1.suptitle('Subplots Example')

plt.show()
Output:
9. 总结
XAxis.get_figure()是Matplotlib中一个强大而灵活的方法,它允许我们从XAxis对象轻松获取相关的Figure对象。通过这个方法,我们可以方便地调整整个图表的属性、添加新的子图、保存图表、与其他Matplotlib组件交互,以及创建复杂的图表布局。
在使用XAxis.get_figure()时,我们需要注意一些性能考虑,如缓存Figure对象和避免频繁更新。同时,在处理多个Figure或子图时,要确保使用正确的XAxis对象。
通过本文的详细介绍和丰富的示例,相信读者已经对XAxis.get_figure()有了深入的理解,并能够在自己的数据可视化项目中灵活运用这个方法。无论是创建简单的折线图,还是构建复杂的交互式可视化,XAxis.get_figure()都是一个不可或缺的工具。
 极客教程
极客教程