Matplotlib中的axis.Tick.findobj()函数:深入探索对象查找机制
参考:Matplotlib.axis.Tick.findobj() function in Python
Matplotlib是Python中最流行的数据可视化库之一,它提供了丰富的绘图功能和自定义选项。在Matplotlib的众多组件中,axis.Tick类扮演着重要的角色,它代表了坐标轴上的刻度。而findobj()方法则是axis.Tick类的一个强大工具,用于在Matplotlib图形对象层次结构中查找特定类型的对象。本文将深入探讨axis.Tick.findobj()函数的用法、特性和应用场景,帮助读者更好地理解和利用这一功能。
1. axis.Tick.findobj()函数概述
axis.Tick.findobj()函数是Matplotlib库中axis.Tick类的一个方法,用于在给定的Matplotlib对象及其子对象中查找特定类型的对象。这个函数的强大之处在于它能够递归地搜索对象树,找出所有匹配指定条件的对象。
1.1 函数语法
axis.Tick.findobj()函数的基本语法如下:
Tick.findobj(match=None, include_self=True)
参数说明:
– match:可选参数,用于指定要查找的对象类型或匹配条件。可以是一个类、类型或者一个返回布尔值的函数。
– include_self:布尔值,默认为True。指定是否将当前Tick对象本身包含在搜索结果中。
1.2 返回值
findobj()函数返回一个列表,包含所有匹配指定条件的对象。
2. 基本用法示例
让我们从一个简单的例子开始,了解axis.Tick.findobj()函数的基本用法。
import matplotlib.pyplot as plt
import matplotlib.text as mtext

fig, ax = plt.subplots()
ax.set_title("how2matplotlib.com Example")
ax.plot([1, 2, 3, 4], [1, 4, 2, 3])

# 获取x轴的第一个刻度
x_tick = ax.xaxis.get_major_ticks()[0]

# 使用findobj()查找所有Text对象
text_objects = x_tick.findobj(mtext.Text)

print(f"Found {len(text_objects)} Text objects")

plt.show()
Output:
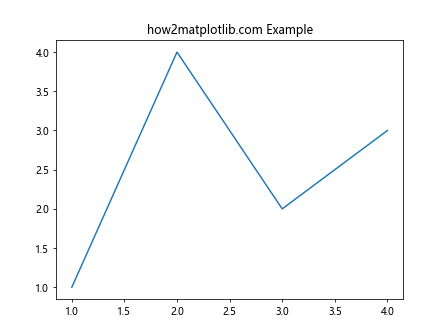
在这个例子中,我们首先创建了一个简单的折线图。然后,我们获取x轴的第一个主刻度,并使用findobj()方法查找与该刻度相关的所有Text对象。这些Text对象通常包括刻度标签。
3. 高级查找技巧
axis.Tick.findobj()函数的强大之处在于它的灵活性。我们可以使用不同的匹配条件来精确定位我们需要的对象。
3.1 使用类型匹配
我们可以使用Python的内置类型或Matplotlib的特定类作为匹配条件。
import matplotlib.pyplot as plt
import matplotlib.lines as mlines

fig, ax = plt.subplots()
ax.set_title("how2matplotlib.com Advanced Example")
ax.plot([1, 2, 3, 4], [1, 4, 2, 3])

# 获取y轴的所有刻度
y_ticks = ax.yaxis.get_major_ticks()

# 查找所有Line2D对象
line_objects = []
for tick in y_ticks:
    line_objects.extend(tick.findobj(mlines.Line2D))

print(f"Found {len(line_objects)} Line2D objects")

plt.show()
Output:
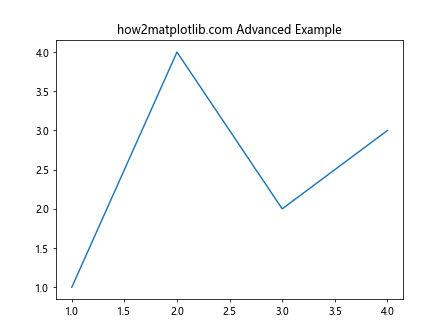
在这个例子中,我们遍历y轴的所有刻度,并使用findobj()查找每个刻度相关的Line2D对象。这些对象通常代表刻度线。
3.2 使用自定义函数匹配
findobj()函数还允许我们使用自定义函数作为匹配条件,这为我们提供了更大的灵活性。
import matplotlib.pyplot as plt
import matplotlib.text as mtext

fig, ax = plt.subplots()
ax.set_title("how2matplotlib.com Custom Matching")
ax.plot([1, 2, 3, 4], [1, 4, 2, 3])

# 自定义匹配函数
def match_text_with_1(obj):
    return isinstance(obj, mtext.Text) and '1' in obj.get_text()

# 获取所有刻度
all_ticks = ax.xaxis.get_major_ticks() + ax.yaxis.get_major_ticks()

# 查找文本包含'1'的Text对象
text_with_1 = []
for tick in all_ticks:
    text_with_1.extend(tick.findobj(match_text_with_1))

print(f"Found {len(text_with_1)} Text objects containing '1'")

plt.show()
Output:
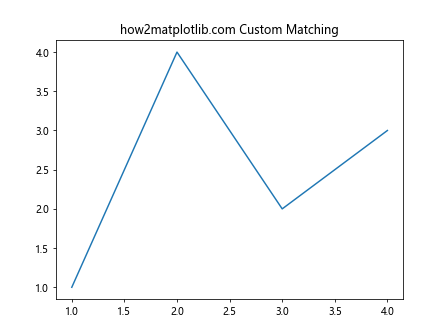
在这个例子中,我们定义了一个自定义函数match_text_with_1,它检查对象是否是Text类型,并且其文本内容包含字符’1’。然后我们使用这个函数作为findobj()的匹配条件,查找所有符合条件的对象。
4. 实际应用场景
axis.Tick.findobj()函数在许多实际场景中都非常有用。让我们探讨一些常见的应用。
4.1 修改特定刻度的样式
假设我们想要突出显示某些特定的刻度,我们可以使用findobj()来定位这些刻度,然后修改它们的样式。
import matplotlib.pyplot as plt
import matplotlib.text as mtext

fig, ax = plt.subplots()
ax.set_title("how2matplotlib.com Highlight Ticks")
ax.plot([1, 2, 3, 4, 5], [1, 4, 2, 3, 5])

# 获取所有x轴刻度
x_ticks = ax.xaxis.get_major_ticks()

# 定义匹配函数,查找值为3的刻度标签
def match_value_3(obj):
    return isinstance(obj, mtext.Text) and obj.get_text() == '3'

# 查找并修改值为3的刻度标签
for tick in x_ticks:
    label = tick.findobj(match_value_3)
    if label:
        label[0].set_color('red')
        label[0].set_fontweight('bold')

plt.show()
Output:
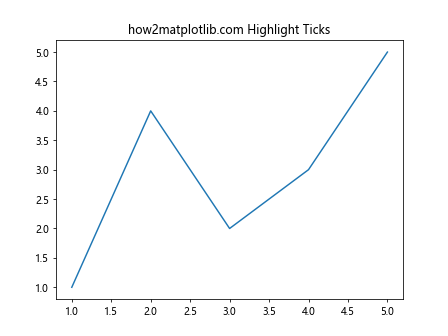
在这个例子中,我们定义了一个匹配函数来查找值为’3’的刻度标签。然后,我们遍历所有x轴刻度,找到匹配的标签并修改其颜色和字体粗细。
4.2 隐藏特定刻度线
有时我们可能想要隐藏某些特定的刻度线,而保留其他刻度线。findobj()函数可以帮助我们精确定位这些刻度线。
import matplotlib.pyplot as plt
import matplotlib.lines as mlines

fig, ax = plt.subplots()
ax.set_title("how2matplotlib.com Hide Specific Ticks")
ax.plot([1, 2, 3, 4, 5], [1, 4, 2, 3, 5])

# 获取所有y轴刻度
y_ticks = ax.yaxis.get_major_ticks()

# 定义匹配函数,查找偶数位置的刻度线
def match_even_ticks(obj):
    return isinstance(obj, mlines.Line2D) and obj.get_ydata()[0] % 2 == 0

# 隐藏偶数位置的刻度线
for tick in y_ticks:
    even_tick_lines = tick.findobj(match_even_ticks)
    for line in even_tick_lines:
        line.set_visible(False)

plt.show()
Output:
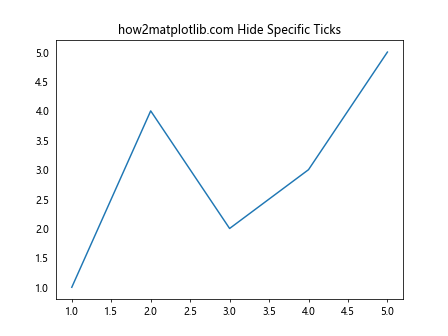
在这个例子中,我们定义了一个匹配函数来查找y轴上偶数位置的刻度线。然后,我们遍历所有y轴刻度,找到匹配的刻度线并将其隐藏。
5. 性能考虑
虽然axis.Tick.findobj()函数非常强大和灵活,但在处理大型或复杂的图表时,过度使用可能会影响性能。这是因为findobj()函数需要递归遍历对象树,这在对象数量很大时可能会变得耗时。
5.1 优化查找策略
为了提高性能,我们可以采取一些策略来优化findobj()的使用:
- 限制搜索范围:如果可能,尽量在较小的对象子集上调用
findobj(),而不是在整个图表对象上调用。 -
使用更具体的匹配条件:越具体的匹配条件通常能更快地过滤掉不相关的对象。
-
缓存结果:如果需要多次使用相同的查找结果,考虑将结果缓存起来,而不是每次都重新查找。
让我们看一个优化示例:
import matplotlib.pyplot as plt
import matplotlib.text as mtext

fig, ax = plt.subplots()
ax.set_title("how2matplotlib.com Optimized Search")
ax.plot([1, 2, 3, 4, 5], [1, 4, 2, 3, 5])

# 获取所有x轴刻度
x_ticks = ax.xaxis.get_major_ticks()

# 缓存查找结果
text_objects = {}
for i, tick in enumerate(x_ticks):
    text_objects[i] = tick.findobj(mtext.Text)

# 使用缓存的结果
for i, texts in text_objects.items():
    for text in texts:
        if text.get_text() == '3':
            text.set_color('red')
        elif text.get_text() == '5':
            text.set_color('blue')

plt.show()
Output:
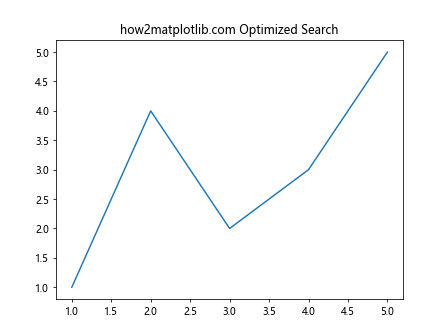
在这个优化的例子中,我们首先将所有刻度的Text对象缓存到一个字典中。然后,我们使用这个缓存的结果来修改特定的刻度标签,而不是每次都重新调用findobj()。
6. 与其他Matplotlib功能的集成
axis.Tick.findobj()函数可以与Matplotlib的其他功能无缝集成,使得复杂的图表定制变得更加容易。
6.1 结合事件处理
我们可以将findobj()与Matplotlib的事件处理系统结合使用,实现动态的图表交互。
import matplotlib.pyplot as plt
import matplotlib.text as mtext

fig, ax = plt.subplots()
ax.set_title("how2matplotlib.com Interactive Example")
ax.plot([1, 2, 3, 4, 5], [1, 4, 2, 3, 5])

def on_click(event):
    if event.inaxes:
        x_ticks = event.inaxes.xaxis.get_major_ticks()
        for tick in x_ticks:
            labels = tick.findobj(mtext.Text)
            for label in labels:
                if float(label.get_text()) == round(event.xdata):
                    label.set_color('red')
                else:
                    label.set_color('black')
        plt.draw()

fig.canvas.mpl_connect('button_press_event', on_click)

plt.show()
Output:
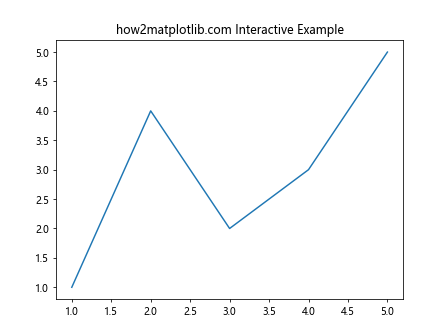
在这个交互式示例中,我们定义了一个点击事件处理函数。当用户点击图表时,函数使用findobj()查找与点击位置最接近的x轴刻度标签,并将其颜色改为红色。
6.2 自定义刻度格式化
findobj()还可以用于实现复杂的刻度格式化。例如,我们可以根据某些条件动态地更改刻度标签的格式。
import matplotlib.pyplot as plt
import matplotlib.text as mtext

fig, ax = plt.subplots()
ax.set_title("how2matplotlib.com Custom Tick Formatting")
ax.plot([1, 2, 3, 4, 5], [100, 400, 200, 300, 500])

def format_ticks(axis):
    ticks = axis.get_major_ticks()
    for tick in ticks:
        label = tick.findobj(mtext.Text)[0]
        value = float(label.get_text())
        if value > 300:
            label.set_text(f"{value:.0f}+")
            label.set_color('red')
        else:
            label.set_text(f"{value:.0f}")

format_ticks(ax.yaxis)

plt.show()
在这个例子中,我们定义了一个format_ticks函数来自定义y轴的刻度标签。对于大于300的值,我们在标签后添加一个”+”号并将其颜色设为红色。这种方法可以很容易地扩展到更复杂的格式化需求。
7. 处理特殊情况
在使用axis.Tick.findobj()函数时,我们可能会遇到一些特殊情况。了解如何处理这些情况可以帮助我们更好地利用这个功能。
7.1 处理空结果
有时,findobj()可能返回空列表,表示没有找到匹配的对象。我们应该在代码中处理这种情况。
import matplotlib.pyplot as plt
import matplotlib.patches as mpatches

fig, ax = plt.subplots()
ax.set_title("how2matplotlib.com Handling Empty Results")
ax.plot([1, 2, 3, 4, 5],[1, 4, 2, 3, 5])

# 获取所有x轴刻度
x_ticks = ax.xaxis.get_major_ticks()

# 尝试查找不存在的对象类型
for tick in x_ticks:
    rectangles = tick.findobj(mpatches.Rectangle)
    if rectangles:
        print("Found rectangles")
    else:
        print("No rectangles found for this tick")

plt.show()
Output:
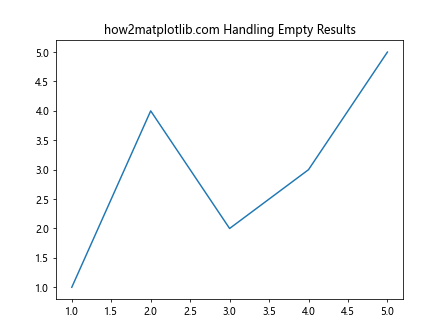
在这个例子中,我们尝试在刻度中查找Rectangle对象,这通常是不存在的。我们通过检查返回列表是否为空来处理这种情况。
7.2 处理多层嵌套对象
有时,我们可能需要在多层嵌套的对象结构中进行搜索。findobj()函数会自动递归搜索所有子对象,但我们可能需要额外的逻辑来处理复杂的结构。
import matplotlib.pyplot as plt
import matplotlib.text as mtext
import matplotlib.lines as mlines

fig, ax = plt.subplots()
ax.set_title("how2matplotlib.com Nested Objects")
line, = ax.plot([1, 2, 3, 4, 5], [1, 4, 2, 3, 5], label="Data")
ax.legend()

def deep_search(obj, max_depth=5):
    depth = 0
    objects = [obj]
    all_found = []

    while objects and depth < max_depth:
        next_level = []
        for o in objects:
            found = o.findobj(match=(mtext.Text, mlines.Line2D), include_self=False)
            all_found.extend(found)
            next_level.extend([f for f in found if hasattr(f, 'findobj')])
        objects = next_level
        depth += 1

    return all_found

found_objects = deep_search(fig)
print(f"Found {len(found_objects)} Text and Line2D objects")

plt.show()
在这个例子中,我们定义了一个deep_search函数,它使用广度优先搜索来查找图表中的所有Text和Line2D对象,包括深层嵌套的对象。这种方法可以帮助我们在复杂的图表结构中找到所需的对象。
8. 错误处理和调试
在使用axis.Tick.findobj()函数时,适当的错误处理和调试技巧可以帮助我们更有效地解决问题。
8.1 异常处理
虽然findobj()函数本身不太可能引发异常,但在处理返回的对象时可能会出现问题。我们应该使用try-except块来捕获和处理可能的异常。
import matplotlib.pyplot as plt
import matplotlib.text as mtext

fig, ax = plt.subplots()
ax.set_title("how2matplotlib.com Error Handling")
ax.plot([1, 2, 3, 4, 5], [1, 4, 2, 3, 5])

x_ticks = ax.xaxis.get_major_ticks()

for tick in x_ticks:
    try:
        text_objects = tick.findobj(mtext.Text)
        for text in text_objects:
            value = float(text.get_text())
            if value > 3:
                text.set_color('red')
    except ValueError as e:
        print(f"Error processing tick: {e}")
    except Exception as e:
        print(f"Unexpected error: {e}")

plt.show()
Output:
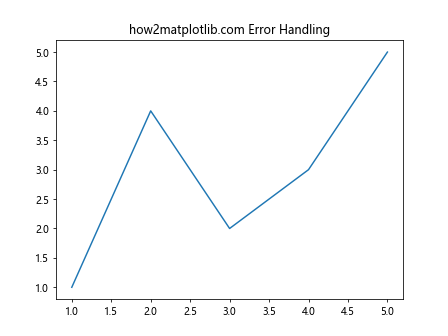
在这个例子中,我们使用try-except块来处理可能出现的ValueError(例如,当文本不能转换为浮点数时)和其他未预期的异常。
8.2 调试技巧
当findobj()没有返回预期的结果时,可以使用一些调试技巧来帮助诊断问题。
import matplotlib.pyplot as plt
import matplotlib.artist as martist

fig, ax = plt.subplots()
ax.set_title("how2matplotlib.com Debugging")
ax.plot([1, 2, 3, 4, 5], [1, 4, 2, 3, 5])

def debug_findobj(obj, match=None):
    found = obj.findobj(match=match)
    print(f"Searching in {type(obj).__name__}")
    print(f"Found {len(found)} objects:")
    for item in found:
        print(f"  - {type(item).__name__}: {item}")
    return found

x_ticks = ax.xaxis.get_major_ticks()
for tick in x_ticks:
    debug_findobj(tick, match=martist.Artist)

plt.show()
Output:
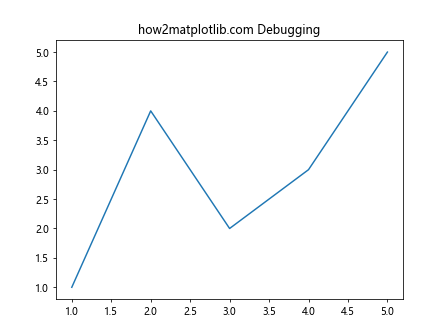
在这个调试示例中,我们创建了一个debug_findobj函数,它不仅执行findobj()操作,还打印出详细的搜索信息。这可以帮助我们了解搜索过程中发生了什么,以及为什么某些对象可能没有被找到。
9. 高级应用:自定义Tick类
了解了axis.Tick.findobj()的工作原理后,我们可以考虑创建自定义的Tick类来扩展其功能。这可以让我们更灵活地控制刻度的行为和外观。
import matplotlib.pyplot as plt
from matplotlib.axis import Tick
import matplotlib.text as mtext

class CustomTick(Tick):
    def __init__(self, *args, **kwargs):
        super().__init__(*args, **kwargs)
        self.label_color = 'black'

    def findobj(self, match=None, include_self=True):
        found = super().findobj(match, include_self)
        if isinstance(match, type) and issubclass(match, mtext.Text):
            for obj in found:
                obj.set_color(self.label_color)
        return found

fig, ax = plt.subplots()
ax.set_title("how2matplotlib.com Custom Tick Class")
ax.plot([1, 2, 3, 4, 5], [1, 4, 2, 3, 5])

# 替换默认的Tick类
ax.xaxis.set_tick_params(which='both', direction='out', length=6, width=2, color='r')
ax.xaxis.set_major_formatter(plt.FuncFormatter(lambda x, p: f"{x:.0f}"))
ax.xaxis.set_major_locator(plt.MaxNLocator(integer=True))

for tick in ax.xaxis.get_major_ticks():
    new_tick = CustomTick(tick.axes, tick.loc, tick.label1, tick.label2, major=tick.majorTicks)
    new_tick.label_color = 'blue' if float(tick.label1.get_text()) % 2 == 0 else 'green'
    ax.xaxis.majorTicks[ax.xaxis.majorTicks.index(tick)] = new_tick

plt.show()
在这个高级示例中,我们创建了一个CustomTick类,它继承自Matplotlib的Tick类。我们重写了findobj方法,使其在查找Text对象时自动设置标签颜色。然后,我们用这个自定义类替换了x轴上的默认刻度,并根据刻度值的奇偶性设置不同的颜色。
10. 结合其他Matplotlib功能
axis.Tick.findobj()函数可以与Matplotlib的其他高级功能结合使用,创造出更复杂和动态的可视化效果。
10.1 动画效果
我们可以结合Matplotlib的动画功能,创建动态变化的刻度效果。
import matplotlib.pyplot as plt
import matplotlib.animation as animation
import matplotlib.text as mtext
import numpy as np

fig, ax = plt.subplots()
ax.set_title("how2matplotlib.com Animated Ticks")
line, = ax.plot([], [])
ax.set_xlim(0, 2*np.pi)
ax.set_ylim(-1, 1)

def animate(frame):
    x = np.linspace(0, 2*np.pi, 100)
    y = np.sin(x + frame/10)
    line.set_data(x, y)

    for tick in ax.xaxis.get_major_ticks():
        label = tick.findobj(mtext.Text)[0]
        value = float(label.get_text())
        label.set_color(plt.cm.viridis(value / (2*np.pi)))

    return line,

ani = animation.FuncAnimation(fig, animate, frames=100, interval=50, blit=True)
plt.show()
在这个动画示例中,我们创建了一个正弦波动画,并使用findobj()函数动态地改变x轴刻度标签的颜色。颜色根据刻度值在一个连续的颜色映射中变化。
10.2 交互式图表
我们还可以结合Matplotlib的交互式功能,创建响应用户输入的动态刻度。
import matplotlib.pyplot as plt
from matplotlib.widgets import Slider
import matplotlib.text as mtext

fig, ax = plt.subplots()
plt.subplots_adjust(bottom=0.25)
ax.set_title("how2matplotlib.com Interactive Ticks")
t = np.arange(0.0, 1.0, 0.001)
s = np.sin(2*np.pi*t)
line, = ax.plot(t, s)

ax_slider = plt.axes([0.1, 0.1, 0.8, 0.03])
slider = Slider(ax_slider, 'Frequency', 0.1, 10.0, valinit=1)

def update(val):
    freq = slider.val
    line.set_ydata(np.sin(2*np.pi*freq*t))

    for tick in ax.yaxis.get_major_ticks():
        label = tick.findobj(mtext.Text)[0]
        value = float(label.get_text())
        if abs(value) > 0.5:
            label.set_fontweight('bold')
        else:
            label.set_fontweight('normal')

    fig.canvas.draw_idle()

slider.on_changed(update)

plt.show()
在这个交互式示例中,我们创建了一个滑块来控制正弦波的频率。当用户移动滑块时,我们不仅更新了图表,还使用findobj()函数来动态地改变y轴刻度标签的字体粗细,突出显示大于0.5的值。
结论
通过本文的深入探讨,我们全面了解了Matplotlib中axis.Tick.findobj()函数的用法、特性和应用场景。这个强大的工具为我们提供了精确定位和操作图表元素的能力,使得创建复杂、动态和交互式的数据可视化变得更加容易。
从基本用法到高级应用,从性能优化到错误处理,我们涵盖了使用findobj()函数时需要考虑的各个方面。通过结合Matplotlib的其他功能,如动画和交互式组件,我们还展示了如何创建更加丰富和动态的可视化效果。
掌握axis.Tick.findobj()函数不仅能够帮助我们更好地控制图表的细节,还能激发我们创造出更加独特和有吸引力的数据可视化作品。随着数据可视化在各个领域的重要性不断提升,这样的技能将变得越来越有价值。
希望本文能够帮助读者更好地理解和运用axis.Tick.findobj()函数,为创建出色的数据可视化作品提供有力的工具支持。
 极客教程
极客教程