Matplotlib中使用subplots和ylim进行多子图绘制和Y轴范围设置
Matplotlib是Python中最流行的数据可视化库之一,它提供了丰富的绘图功能和灵活的自定义选项。在进行数据分析和科学研究时,我们经常需要在同一个图形窗口中绘制多个相关的图表,以便进行比较和分析。Matplotlib的subplots功能就是为了满足这种需求而设计的。同时,为了更好地展示数据的细节和趋势,我们常常需要调整坐标轴的范围,这就是ylim函数的作用所在。本文将详细介绍如何使用Matplotlib的subplots和ylim功能来创建多子图并设置Y轴范围,以帮助读者更好地掌握这些强大的工具。
1. Matplotlib subplots简介
subplots是Matplotlib库中用于创建多个子图的函数。它允许我们在一个图形窗口中创建多个轴对象,每个轴对象都可以包含一个独立的图表。这种方法非常适合用于比较不同数据集、展示数据的不同方面或者简单地组织多个相关的图表。
1.1 subplots的基本用法
让我们从一个简单的例子开始,创建一个2×2的子图布局:
import matplotlib.pyplot as plt
import numpy as np

# 创建2x2的子图布局
fig, axs = plt.subplots(2, 2, figsize=(10, 8))

# 生成一些示例数据
x = np.linspace(0, 10, 100)
y1 = np.sin(x)
y2 = np.cos(x)
y3 = np.exp(-x/10)
y4 = x**2

# 在每个子图中绘制不同的函数
axs[0, 0].plot(x, y1)
axs[0, 0].set_title('Sine Function')
axs[0, 1].plot(x, y2)
axs[0, 1].set_title('Cosine Function')
axs[1, 0].plot(x, y3)
axs[1, 0].set_title('Exponential Decay')
axs[1, 1].plot(x, y4)
axs[1, 1].set_title('Quadratic Function')

# 调整子图之间的间距
plt.tight_layout()

# 添加整体标题
fig.suptitle('Multiple Functions - how2matplotlib.com', fontsize=16)

# 显示图形
plt.show()

# 打印输出结果
print("The figure has been displayed.")
Output:
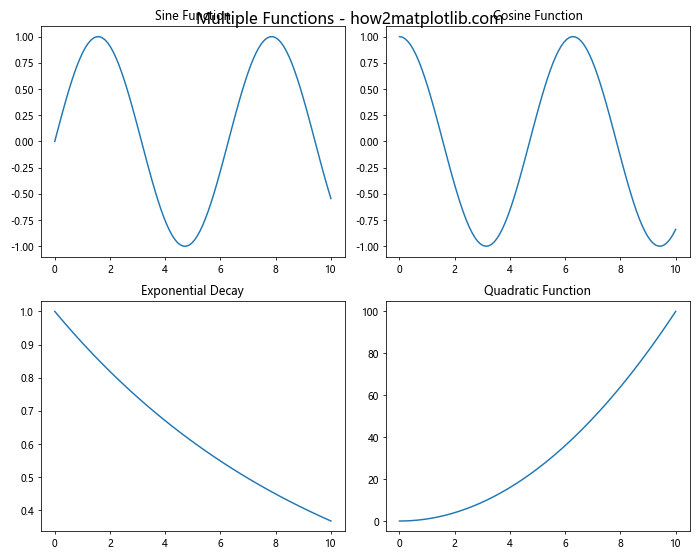
在这个例子中,我们使用plt.subplots(2, 2)创建了一个2行2列的子图布局。函数返回两个对象:fig是整个图形对象,axs是一个2×2的数组,包含了4个轴对象。我们可以通过索引axs[i, j]来访问每个子图,其中i表示行,j表示列。
我们在每个子图中绘制了不同的函数,并为每个子图设置了标题。plt.tight_layout()函数用于自动调整子图之间的间距,以避免重叠。最后,我们使用fig.suptitle()为整个图形添加了一个总标题。
1.2 自定义子图布局
subplots函数提供了多种参数来自定义子图的布局。让我们看一个更复杂的例子:
import matplotlib.pyplot as plt
import numpy as np

# 创建一个3x3的网格,但只使用其中的5个位置
fig, axs = plt.subplots(3, 3, figsize=(12, 10))

# 生成示例数据
x = np.linspace(0, 10, 100)
y1 = np.sin(x)
y2 = np.cos(x)
y3 = np.tan(x)
y4 = np.exp(x)
y5 = np.log(x)

# 在指定的子图位置绘制图形
axs[0, 0].plot(x, y1, 'r-')
axs[0, 0].set_title('Sine - how2matplotlib.com')

axs[0, 2].plot(x, y2, 'g-')
axs[0, 2].set_title('Cosine - how2matplotlib.com')

axs[1, 1].plot(x, y3, 'b-')
axs[1, 1].set_title('Tangent - how2matplotlib.com')

axs[2, 0].plot(x, y4, 'm-')
axs[2, 0].set_title('Exponential - how2matplotlib.com')

axs[2, 2].plot(x, y5, 'c-')
axs[2, 2].set_title('Logarithm - how2matplotlib.com')

# 移除未使用的子图
fig.delaxes(axs[0, 1])
fig.delaxes(axs[1, 0])
fig.delaxes(axs[1, 2])
fig.delaxes(axs[2, 1])

# 调整子图之间的间距
plt.tight_layout()

# 添加整体标题
fig.suptitle('Custom Subplot Layout - how2matplotlib.com', fontsize=16)

# 显示图形
plt.show()

# 打印输出结果
print("The custom subplot layout has been displayed.")
在这个例子中,我们创建了一个3×3的网格,但只使用了其中的5个位置来放置子图。我们使用fig.delaxes()函数移除了未使用的子图,从而创建了一个自定义的布局。这种方法允许我们创建非常灵活的图形布局,以适应各种不同的数据展示需求。
1.3 共享轴
在某些情况下,我们可能希望多个子图共享相同的X轴或Y轴。Matplotlib的subplots函数提供了sharex和sharey参数来实现这一功能:
import matplotlib.pyplot as plt
import numpy as np

# 创建2x2的子图布局,共享X轴和Y轴
fig, axs = plt.subplots(2, 2, figsize=(10, 8), sharex=True, sharey=True)

# 生成示例数据
x = np.linspace(0, 2*np.pi, 100)
y1 = np.sin(x)
y2 = np.cos(x)
y3 = np.tan(x)
y4 = np.sin(x) * np.cos(x)

# 在每个子图中绘制不同的函数
axs[0, 0].plot(x, y1)
axs[0, 0].set_title('Sine - how2matplotlib.com')

axs[0, 1].plot(x, y2)
axs[0, 1].set_title('Cosine - how2matplotlib.com')

axs[1, 0].plot(x, y3)
axs[1, 0].set_title('Tangent - how2matplotlib.com')

axs[1, 1].plot(x, y4)
axs[1, 1].set_title('Sine * Cosine - how2matplotlib.com')

# 为整个图形设置X轴和Y轴标签
fig.text(0.5, 0.04, 'X axis', ha='center')
fig.text(0.04, 0.5, 'Y axis', va='center', rotation='vertical')

# 调整子图之间的间距
plt.tight_layout()

# 添加整体标题
fig.suptitle('Shared Axes Example - how2matplotlib.com', fontsize=16)

# 显示图形
plt.show()

# 打印输出结果
print("The figure with shared axes has been displayed.")
Output:
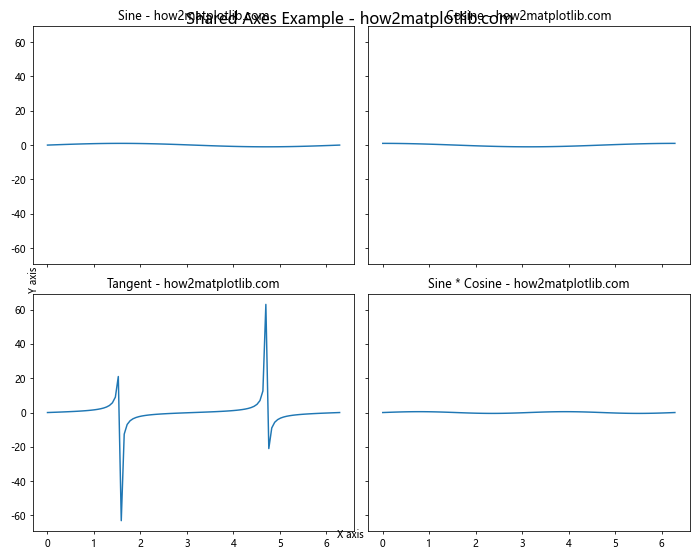
在这个例子中,我们使用sharex=True和sharey=True参数创建了共享X轴和Y轴的子图。这意味着当我们缩放或平移一个子图时,其他子图也会相应地更新。这对于比较具有相同范围的多个数据集特别有用。
我们还使用fig.text()函数为整个图形添加了X轴和Y轴的标签,因为共享轴的情况下,我们不需要为每个子图单独添加轴标签。
2. ylim函数详解
ylim函数用于设置或获取Y轴的范围。它可以帮助我们聚焦于数据的特定区域,或者确保多个图表使用相同的Y轴范围以便进行比较。
2.1 设置Y轴范围
让我们看一个简单的例子,展示如何使用ylim设置Y轴范围:
import matplotlib.pyplot as plt
import numpy as np

# 生成示例数据
x = np.linspace(0, 10, 100)
y = np.sin(x)

# 创建图形和轴对象
fig, ax = plt.subplots(figsize=(8, 6))

# 绘制数据
ax.plot(x, y)

# 设置Y轴范围
ax.set_ylim(-0.5, 0.5)

# 设置标题和轴标签
ax.set_title('Sine Function with Limited Y-axis - how2matplotlib.com')
ax.set_xlabel('X axis')
ax.set_ylabel('Y axis')

# 显示网格
ax.grid(True)

# 显示图形
plt.show()

# 打印输出结果
print("The figure with limited Y-axis has been displayed.")
Output:
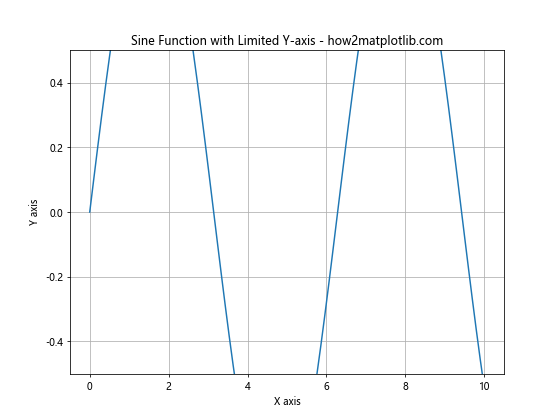
在这个例子中,我们使用ax.set_ylim(-0.5, 0.5)将Y轴的范围限制在-0.5到0.5之间。这样做可以让我们更仔细地观察正弦函数在这个范围内的行为。
2.2 自动调整Y轴范围
有时候,我们可能想要根据数据自动调整Y轴的范围,但又不想使用默认的范围。Matplotlib提供了一些有用的函数来帮助我们实现这一点:
import matplotlib.pyplot as plt
import numpy as np

# 生成示例数据
x = np.linspace(0, 10, 100)
y1 = np.sin(x)
y2 = 0.5 * np.sin(x)

# 创建图形和轴对象
fig, (ax1, ax2) = plt.subplots(1, 2, figsize=(12, 5))

# 在第一个子图中绘制数据
ax1.plot(x, y1, label='sin(x)')
ax1.plot(x, y2, label='0.5 * sin(x)')
ax1.set_title('Default Y-axis Range - how2matplotlib.com')
ax1.legend()

# 在第二个子图中绘制数据
ax2.plot(x, y1, label='sin(x)')
ax2.plot(x, y2, label='0.5 * sin(x)')
ax2.set_title('Adjusted Y-axis Range - how2matplotlib.com')
ax2.legend()

# 自动调整Y轴范围
y_min, y_max = ax2.get_ylim()
ax2.set_ylim(y_min * 1.1, y_max * 1.1)

# 添加网格
ax1.grid(True)
ax2.grid(True)

# 调整子图之间的间距
plt.tight_layout()

# 显示图形
plt.show()

# 打印输出结果
print("The figure with default and adjusted Y-axis ranges has been displayed.")
Output:
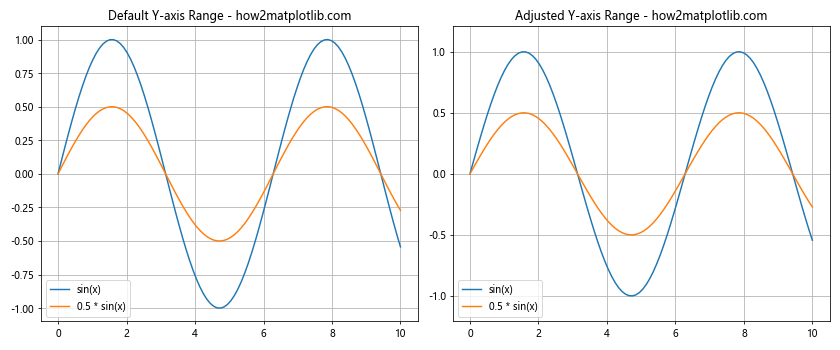
在这个例子中,我们创建了两个子图。左边的子图使用默认的Y轴范围,而右边的子图则使用了自动调整的Y轴范围。我们首先使用ax2.get_ylim()获取默认的Y轴范围,然后使用ax2.set_ylim()将范围稍微扩大了10%。这种方法可以在保持数据可见性的同时,为图表留出一些额外的空间。
2.3 在多个子图中同步Y轴范围
当我们有多个子图时,有时候我们希望它们具有相同的Y轴范围,以便进行直接比较。下面是一个实现这一目标的例子:
import matplotlib.pyplot as plt
import numpy as np

# 生成示例数据
x = np.linspace(0, 10, 100)
y1 = np.sin(x)
y2 = np.cos(x)
y3 = np.tan(x)
y4 = x**2

# 创建2x2的子图布局
fig, axs = plt.subplots(2, 2, figsize=(12, 10))

# 在每个子图中绘制不同的函数
axs[0, 0].plot(x, y1)
axs[0, 0].set_title('Sine - how2matplotlib.com')

axs[0, 1].plot(x, y2)
axs[0, 1].set_title('Cosine - how2matplotlib.com')

axs[1, 0].plot(x, y3)
axs[1, 0].set_title('Tangent - how2matplotlib.com')

axs[1, 1].plot(x, y4)
axs[1, 1].set_title('Quadratic - how2matplotlib.com')

# 找出所有子图的Y轴范围
y_min = min([ax.get_ylim()[0] for ax in axs.flat])
y_max = max([ax.get_ylim()[1] for ax in axs.flat])

# 为所有子图设置相同的Y轴范围
for ax in axs.flat:
    ax.set_ylim(y_min, y_max)
    ax.grid(True)

# 调整子图之间的间距
plt.tight_layout()

# 添加整体标题
fig.suptitle('Synchronized Y-axis Ranges - how2matplotlib.com', fontsize=16)

#显示图形
plt.show()

# 打印输出结果
print("The figure with synchronized Y-axis ranges has been displayed.")
Output:
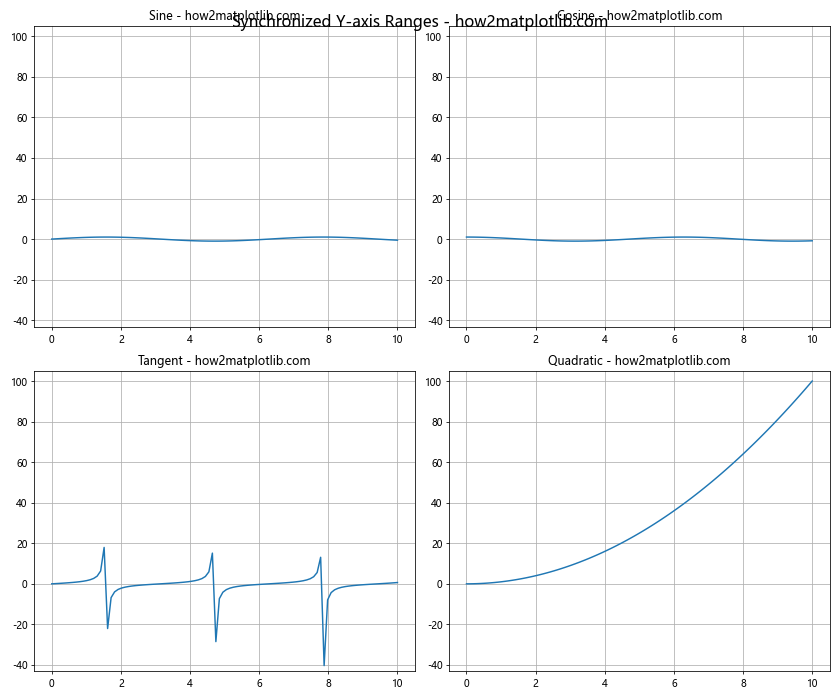
在这个例子中,我们首先创建了四个子图,每个子图绘制不同的函数。然后,我们使用列表推导式找出所有子图的Y轴最小值和最大值。最后,我们遍历所有子图,为它们设置相同的Y轴范围。这样,所有的子图都使用相同的Y轴范围,使得它们之间的比较更加直观和公平。
3. 结合subplots和ylim的高级应用
现在我们已经了解了subplots和ylim的基本用法,让我们来看一些更高级的应用,展示如何结合这两个功能来创建复杂而信息丰富的图表。
3.1 不同类型的子图组合
在实际应用中,我们可能需要在同一个图形中组合不同类型的图表。下面的例子展示了如何创建包含折线图、柱状图和散点图的复合图表:
import matplotlib.pyplot as plt
import numpy as np

# 生成示例数据
x = np.linspace(0, 10, 50)
y1 = np.sin(x)
y2 = np.exp(-x/10)
y3 = np.random.rand(15)
y4 = np.random.randn(200)

# 创建2x2的子图布局
fig, axs = plt.subplots(2, 2, figsize=(12, 10))

# 折线图
axs[0, 0].plot(x, y1, 'r-', label='Sine')
axs[0, 0].plot(x, y2, 'b--', label='Exp Decay')
axs[0, 0].set_title('Line Plot - how2matplotlib.com')
axs[0, 0].legend()
axs[0, 0].set_ylim(-1.5, 1.5)

# 柱状图
axs[0, 1].bar(range(len(y3)), y3, color='g', alpha=0.7)
axs[0, 1].set_title('Bar Plot - how2matplotlib.com')
axs[0, 1].set_ylim(0, 1.2)

# 散点图
axs[1, 0].scatter(np.random.rand(200), y4, alpha=0.5)
axs[1, 0].set_title('Scatter Plot - how2matplotlib.com')
axs[1, 0].set_ylim(-3, 3)

# 直方图
axs[1, 1].hist(y4, bins=20, color='purple', alpha=0.7)
axs[1, 1].set_title('Histogram - how2matplotlib.com')
axs[1, 1].set_ylim(0, 30)

# 为所有子图添加网格
for ax in axs.flat:
    ax.grid(True)

# 调整子图之间的间距
plt.tight_layout()

# 添加整体标题
fig.suptitle('Multiple Plot Types - how2matplotlib.com', fontsize=16)

# 显示图形
plt.show()

# 打印输出结果
print("The figure with multiple plot types has been displayed.")
Output:
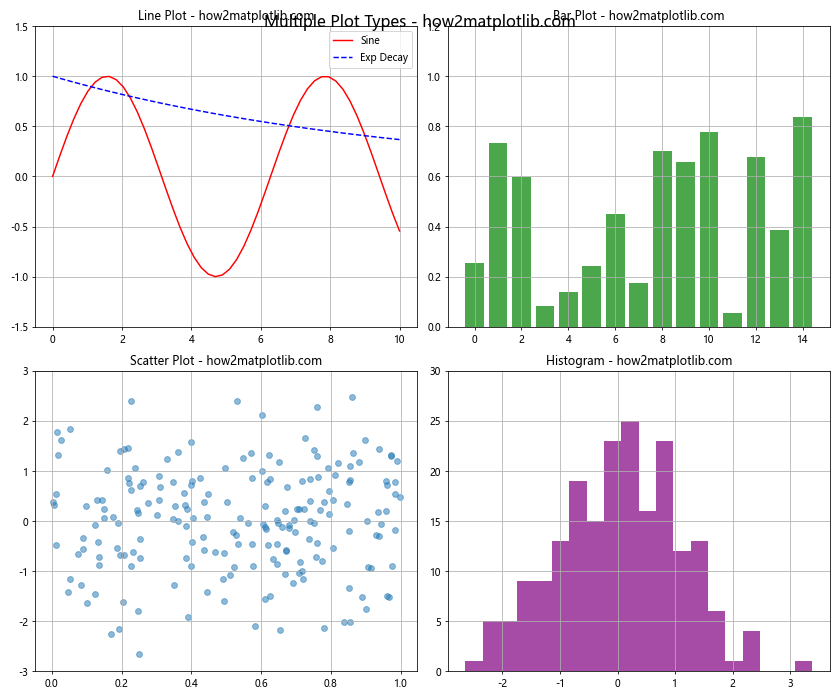
在这个例子中,我们创建了四个不同类型的子图:折线图、柱状图、散点图和直方图。每个子图都使用了不同的数据和绘图函数,并且我们为每个子图单独设置了Y轴范围,以确保数据能够被清晰地显示。
3.2 动态调整Y轴范围
有时候,我们可能需要根据数据的特性动态调整Y轴的范围。下面的例子展示了如何根据数据的百分位数来设置Y轴范围:
import matplotlib.pyplot as plt
import numpy as np

# 生成示例数据
np.random.seed(42)
data1 = np.random.exponential(scale=2, size=1000)
data2 = np.random.normal(loc=5, scale=2, size=1000)
data3 = np.random.lognormal(mean=1, sigma=0.5, size=1000)

# 创建3x1的子图布局
fig, axs = plt.subplots(3, 1, figsize=(10, 12))

datasets = [data1, data2, data3]
titles = ['Exponential Distribution', 'Normal Distribution', 'Lognormal Distribution']

for ax, data, title in zip(axs, datasets, titles):
    # 绘制直方图
    ax.hist(data, bins=50, alpha=0.7)
    ax.set_title(f'{title} - how2matplotlib.com')

    # 计算数据的百分位数
    lower_percentile = np.percentile(data, 1)
    upper_percentile = np.percentile(data, 99)

    # 设置Y轴范围
    ax.set_ylim(0, ax.get_ylim()[1])  # 保持下限为0
    ax.set_xlim(lower_percentile, upper_percentile)

    # 添加垂直线表示百分位数
    ax.axvline(lower_percentile, color='r', linestyle='--', alpha=0.5)
    ax.axvline(upper_percentile, color='r', linestyle='--', alpha=0.5)

    # 添加文本说明
    ax.text(0.05, 0.95, f'1st percentile: {lower_percentile:.2f}',
            transform=ax.transAxes, verticalalignment='top')
    ax.text(0.95, 0.95, f'99th percentile: {upper_percentile:.2f}',
            transform=ax.transAxes, verticalalignment='top', horizontalalignment='right')

# 调整子图之间的间距
plt.tight_layout()

# 添加整体标题
fig.suptitle('Dynamic Y-axis Range Adjustment - how2matplotlib.com', fontsize=16)

# 显示图形
plt.show()

# 打印输出结果
print("The figure with dynamically adjusted Y-axis ranges has been displayed.")
Output:
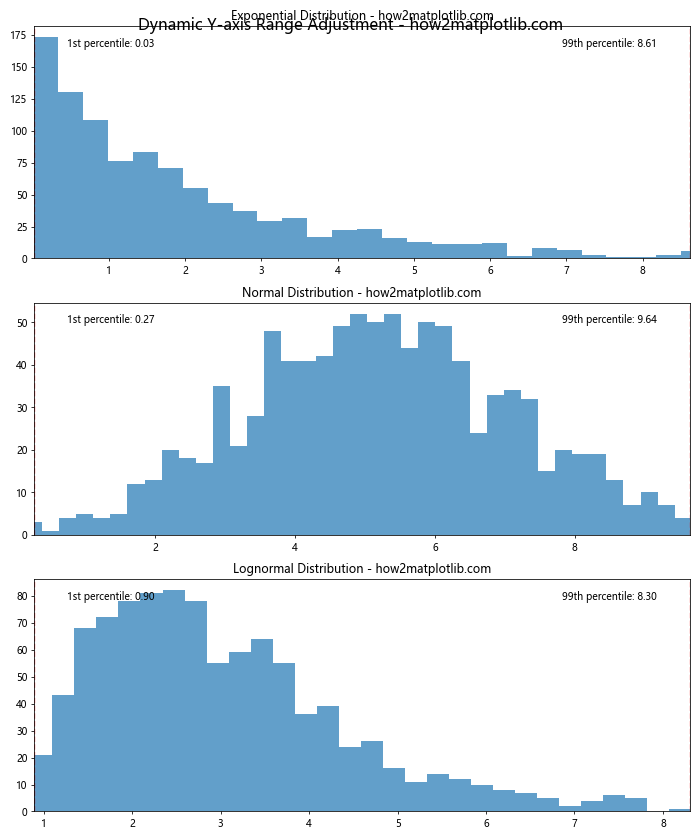
在这个例子中,我们生成了三种不同分布的数据:指数分布、正态分布和对数正态分布。对于每个分布,我们计算了1%和99%的百分位数,并使用这些值来设置X轴的范围。这种方法可以帮助我们聚焦于数据的主要部分,同时排除极端值的影响。我们还添加了垂直线和文本注释来标明这些百分位数的位置。
3.3 使用不同的Y轴范围进行对比
有时候,我们可能需要在同一个图表中比较具有不同数量级的数据。在这种情况下,使用不同的Y轴范围可能会更有帮助。下面的例子展示了如何创建具有双Y轴的图表:
import matplotlib.pyplot as plt
import numpy as np

# 生成示例数据
x = np.linspace(0, 10, 100)
y1 = np.sin(x)
y2 = 1000 * np.exp(-x/10)

# 创建图形和主轴
fig, ax1 = plt.subplots(figsize=(10, 6))

# 绘制第一个数据集
color = 'tab:blue'
ax1.set_xlabel('X axis')
ax1.set_ylabel('Sine', color=color)
ax1.plot(x, y1, color=color)
ax1.tick_params(axis='y', labelcolor=color)

# 创建第二个Y轴
ax2 = ax1.twinx()
color = 'tab:orange'
ax2.set_ylabel('Exponential Decay', color=color)
ax2.plot(x, y2, color=color)
ax2.tick_params(axis='y', labelcolor=color)

# 设置Y轴范围
ax1.set_ylim(-1.5, 1.5)
ax2.set_ylim(0, 1200)

# 添加标题
plt.title('Comparison of Different Scales - how2matplotlib.com')

# 添加图例
lines1, labels1 = ax1.get_legend_handles_labels()
lines2, labels2 = ax2.get_legend_handles_labels()
ax1.legend(lines1 + lines2, ['Sine', 'Exp Decay'], loc='upper right')

# 显示网格
ax1.grid(True)

# 显示图形
plt.show()

# 打印输出结果
print("The figure with dual Y-axes has been displayed.")
Output:
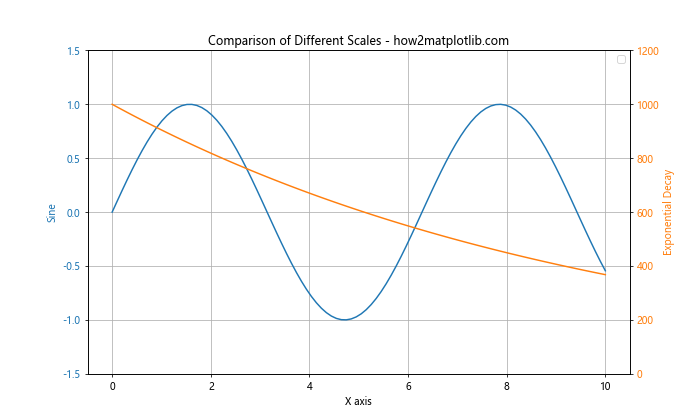
在这个例子中,我们创建了一个具有两个Y轴的图表。左侧的Y轴用于显示正弦函数,范围设置为-1.5到1.5。右侧的Y轴用于显示指数衰减函数,范围设置为0到1200。这种方法允许我们在同一个图表中比较具有非常不同数量级的数据。
3.4 使用颜色映射和等高线图
对于二维数据,我们可以使用颜色映射和等高线图来可视化。以下是一个结合了这两种技术的例子:
import matplotlib.pyplot as plt
import numpy as np

# 生成示例数据
x = np.linspace(-5, 5, 100)
y = np.linspace(-5, 5, 100)
X, Y = np.meshgrid(x, y)
Z = np.sin(np.sqrt(X**2 + Y**2))

# 创建2x2的子图布局
fig, axs = plt.subplots(2, 2, figsize=(12, 10))

# 颜色映射
im1 = axs[0, 0].imshow(Z, extent=[-5, 5, -5, 5], origin='lower', cmap='viridis')
axs[0, 0].set_title('Color Map - how2matplotlib.com')
fig.colorbar(im1, ax=axs[0, 0])

# 等高线图
cs = axs[0, 1].contour(X, Y, Z, levels=15, cmap='coolwarm')
axs[0, 1].set_title('Contour Plot - how2matplotlib.com')
fig.colorbar(cs, ax=axs[0, 1])

# 填充等高线图
cf = axs[1, 0].contourf(X, Y, Z, levels=15, cmap='RdYlBu')
axs[1, 0].set_title('Filled Contour Plot - how2matplotlib.com')
fig.colorbar(cf, ax=axs[1, 0])

# 3D表面图
from mpl_toolkits.mplot3d import Axes3D
ax = fig.add_subplot(224, projection='3d')
surf = ax.plot_surface(X, Y, Z, cmap='plasma')
ax.set_title('3D Surface Plot - how2matplotlib.com')
fig.colorbar(surf, ax=ax, shrink=0.5, aspect=5)

# 调整子图之间的间距
plt.tight_layout()

# 添加整体标题
fig.suptitle('2D Data Visualization Techniques - how2matplotlib.com', fontsize=16)

# 显示图形
plt.show()

# 打印输出结果
print("The figure with 2D data visualization techniques has been displayed.")
Output:
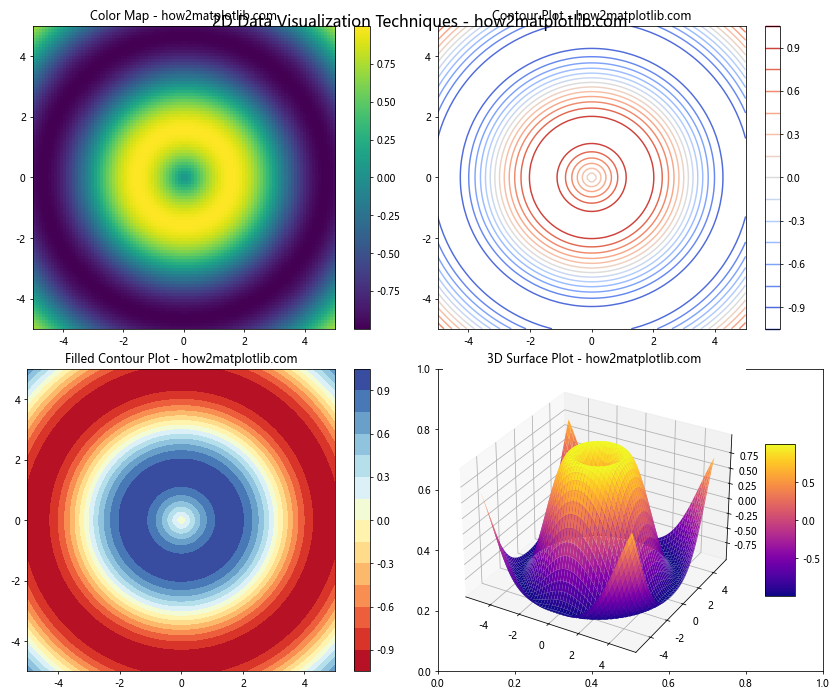
在这个例子中,我们使用了四种不同的技术来可视化同一组二维数据:颜色映射、等高线图、填充等高线图和3D表面图。每种技术都提供了数据的不同视角,可以帮助我们更好地理解数据的结构和模式。
3.5 时间序列数据的可视化
对于时间序列数据,我们可能需要特殊的处理来正确显示日期和时间。以下是一个处理时间序列数据的例子:
import matplotlib.pyplot as plt
import numpy as np
import pandas as pd

# 生成示例数据
dates = pd.date_range(start='2023-01-01', end='2023-12-31', freq='D')
values1 = np.cumsum(np.random.randn(len(dates))) + 100
values2 = np.cumsum(np.random.randn(len(dates))) + 200

# 创建DataFrame
df = pd.DataFrame({'Date': dates, 'Series1': values1, 'Series2': values2})

# 创建图形和轴对象
fig, ax = plt.subplots(figsize=(12, 6))

# 绘制时间序列数据
ax.plot(df['Date'], df['Series1'], label='Series 1')
ax.plot(df['Date'], df['Series2'], label='Series 2')

# 设置x轴为日期格式
ax.xaxis.set_major_locator(plt.MonthLocator())
ax.xaxis.set_major_formatter(plt.DateFormatter('%Y-%m'))

# 旋转x轴标签
plt.setp(ax.xaxis.get_majorticklabels(), rotation=45, ha='right')

# 设置y轴范围
y_min = min(df['Series1'].min(), df['Series2'].min())
y_max = max(df['Series1'].max(), df['Series2'].max())
ax.set_ylim(y_min - 10, y_max + 10)

# 添加标题和标签
ax.set_title('Time Series Data - how2matplotlib.com')
ax.set_xlabel('Date')
ax.set_ylabel('Value')

# 添加图例
ax.legend()

# 添加网格
ax.grid(True)

# 调整布局
plt.tight_layout()

# 显示图形
plt.show()

# 打印输出结果
print("The figure with time series data has been displayed.")
在这个例子中,我们使用pandas生成了一年的每日数据,并创建了两个时间序列。我们使用MonthLocator和DateFormatter来正确显示日期标签,并旋转标签以避免重叠。我们还动态设置了Y轴的范围,以确保所有数据点都可见。
4. 高级样式和自定义
Matplotlib提供了丰富的样式和自定义选项,让我们可以创建出专业和美观的图表。以下是一些高级样式和自定义技巧:
4.1 使用内置样式
Matplotlib提供了多种内置样式,可以快速改变图表的整体外观。以下是一个展示不同样式的例子:
import matplotlib.pyplot as plt
import numpy as np

# 生成示例数据
x = np.linspace(0, 10, 100)
y = np.sin(x)

# 创建2x2的子图布局
fig, axs = plt.subplots(2, 2, figsize=(12, 10))

# 定义要使用的样式
styles = ['default', 'seaborn', 'ggplot', 'fivethirtyeight']

# 在每个子图中使用不同的样式
for ax, style in zip(axs.flat, styles):
    with plt.style.context(style):
        ax.plot(x, y)
        ax.set_title(f'{style.capitalize()} Style - how2matplotlib.com')
        ax.set_ylim(-1.5, 1.5)

# 调整子图之间的间距
plt.tight_layout()

# 添加整体标题
fig.suptitle('Matplotlib Built-in Styles - how2matplotlib.com', fontsize=16)

# 显示图形
plt.show()

# 打印输出结果
print("The figure with different Matplotlib styles has been displayed.")
在这个例子中,我们使用了四种不同的内置样式:默认样式、Seaborn样式、ggplot样式和FiveThirtyEight样式。每种样式都有其独特的颜色方案和整体外观,可以根据需要选择最适合的样式。
4.2 自定义颜色和标记
除了使用内置样式,我们还可以自定义图表的各个元素。以下是一个展示如何自定义颜色和标记的例子:
import matplotlib.pyplot as plt
import numpy as np

# 生成示例数据
x = np.linspace(0, 10, 10)
y1 = np.sin(x)
y2 = np.cos(x)
y3 = np.tan(x)

# 创建图形和轴对象
fig, ax = plt.subplots(figsize=(10, 6))

# 绘制数据并自定义颜色和标记
ax.plot(x, y1, color='#FF5733', marker='o', linestyle='-', linewidth=2, markersize=8, label='Sine')
ax.plot(x, y2, color='#33FF57', marker='s', linestyle='--', linewidth=2, markersize=8, label='Cosine')
ax.plot(x, y3, color='#3357FF', marker='^', linestyle=':', linewidth=2, markersize=8, label='Tangent')

# 设置标题和轴标签
ax.set_title('Custom Colors and Markers - how2matplotlib.com', fontsize=16)
ax.set_xlabel('X axis', fontsize=12)
ax.set_ylabel('Y axis', fontsize=12)

# 设置Y轴范围
ax.set_ylim(-2, 2)

# 添加图例
ax.legend(fontsize=10)

# 添加网格
ax.grid(True, linestyle='--', alpha=0.7)

# 自定义刻度标签
ax.tick_params(axis='both', which='major', labelsize=10)

# 添加文本注释
ax.text(5, 1.5, 'Custom Text', fontsize=12, color='red', ha='center', va='center')

# 显示图形
plt.show()

# 打印输出结果
print("The figure with custom colors and markers has been displayed.")
Output:
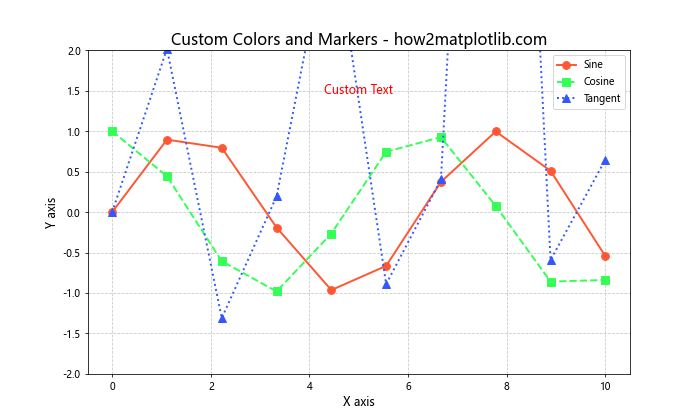
在这个例子中,我们为每条线设置了不同的颜色、标记、线型和线宽。我们使用了十六进制颜色代码来精确指定颜色,并使用不同的标记形状来区分各条线。此外,我们还自定义了标题、轴标签、图例和刻度标签的字体大小,并添加了一个文本注释。
4.3 创建自定义配色方案
对于复杂的数据可视化,创建自定义的配色方案可以帮助我们更好地传达信息。以下是一个使用自定义配色方案的例子:
import matplotlib.pyplot as plt
import numpy as np
from matplotlib.colors import LinearSegmentedColormap

# 生成示例数据
x = np.linspace(0, 10, 100)
y = np.linspace(0, 10, 100)
X, Y = np.meshgrid(x, y)
Z = np.sin(X) * np.cos(Y)

# 创建自定义配色方案
colors = ['#FFA07A', '#98FB98', '#87CEFA', '#DDA0DD', '#F0E68C']
n_bins = 100
cmap = LinearSegmentedColormap.from_list('custom_cmap', colors, N=n_bins)

# 创建图形和轴对象
fig, ax = plt.subplots(figsize=(10, 8))

# 绘制等高线图并使用自定义配色方案
cf = ax.contourf(X, Y, Z, levels=20, cmap=cmap)
cs = ax.contour(X, Y, Z, levels=20, colors='k', linewidths=0.5, alpha=0.5)

# 添加颜色条
cbar = fig.colorbar(cf, ax=ax)
cbar.set_label('Value', rotation=270, labelpad=15)

# 设置标题和轴标签
ax.set_title('Custom Color Scheme - how2matplotlib.com', fontsize=16)
ax.set_xlabel('X axis', fontsize=12)
ax.set_ylabel('Y axis', fontsize=12)

# 显示图形
plt.show()

# 打印输出结果
print("The figure with a custom color scheme has been displayed.")
Output:
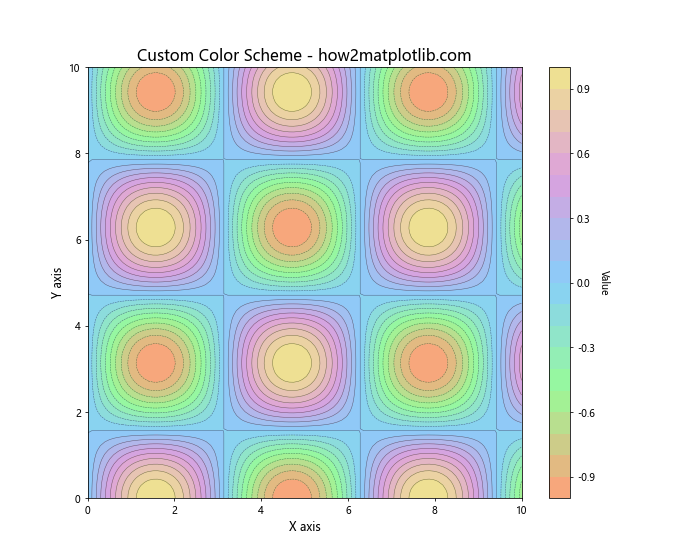
在这个例子中,我们创建了一个自定义的配色方案,使用了五种不同的颜色。我们使用LinearSegmentedColormap.from_list()函数来创建一个平滑过渡的颜色映射,然后将其应用到等高线图中。这种方法允许我们创建独特的、适合特定数据或主题的配色方案。
4.4 添加注释和箭头
在某些情况下,我们可能需要在图表上添加注释或箭头来强调某些特定的数据点或区域。以下是一个展示如何添加注释和箭头的例子:
import matplotlib.pyplot as plt
import numpy as np

# 生成示例数据
x = np.linspace(0, 10, 100)
y = np.sin(x)

# 创建图形和轴对象
fig, ax = plt.subplots(figsize=(10, 6))

# 绘制数据
ax.plot(x, y, 'b-')

# 设置Y轴范围
ax.set_ylim(-1.5, 1.5)

# 添加文本注释
ax.annotate('Local Maximum', xy=(np.pi/2, 1), xytext=(np.pi/2 - 1, 1.3),
            arrowprops=dict(facecolor='black', shrink=0.05),
            fontsize=12, ha='right', va='top')

ax.annotate('Local Minimum', xy=(3*np.pi/2, -1), xytext=(3*np.pi/2 + 1, -1.3),
            arrowprops=dict(facecolor='black', shrink=0.05),
            fontsize=12, ha='left', va='bottom')

# 添加文本框
ax.text(7, 0.5, 'Sine Wave\nPeriod = 2π', fontsize=12, bbox=dict(facecolor='white', edgecolor='black', alpha=0.7))

# 添加垂直线
ax.axvline(x=np.pi, color='r', linestyle='--', label='π')
ax.axvline(x=2*np.pi, color='g', linestyle='--', label='2π')

# 设置标题和轴标签
ax.set_title('Sine Wave with Annotations - how2matplotlib.com', fontsize=16)
ax.set_xlabel('X axis', fontsize=12)
ax.set_ylabel('Y axis', fontsize=12)

# 添加图例
ax.legend()

# 显示网格
ax.grid(True, linestyle=':', alpha=0.7)

# 显示图形
plt.show()

# 打印输出结果
print("The figure with annotations and arrows has been displayed.")
Output:
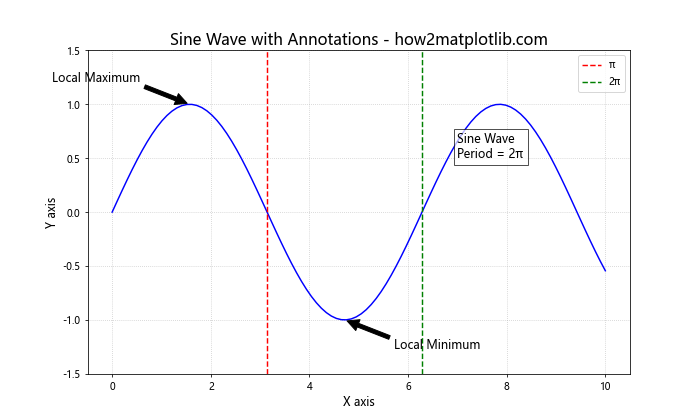
在这个例子中,我们使用annotate()函数添加了带箭头的注释,指向正弦波的局部最大值和最小值。我们还使用text()函数添加了一个带边框的文本框,解释了正弦波的周期。此外,我们还添加了两条垂直的虚线来标记π和2π的位置。这些注释和标记可以帮助读者更好地理解图表中的重要信息。
4.5 创建交互式图表
Matplotlib还支持创建交互式图表,允许用户通过鼠标操作来探索数据。以下是一个简单的交互式图表例子:
import matplotlib.pyplot as plt
import numpy as np
from matplotlib.widgets import Slider, Button

# 生成初始数据
t = np.linspace(0, 10, 1000)
a = 5
b = 2
y = a * np.sin(b * t)

# 创建图形和轴对象
fig, ax = plt.subplots(figsize=(10, 8))
plt.subplots_adjust(bottom=0.25)

# 绘制初始图形
line, = ax.plot(t, y, lw=2)
ax.set_ylim(-10, 10)

# 创建滑块的轴
ax_freq = plt.axes([0.25, 0.1, 0.65, 0.03])
ax_amp = plt.axes([0.25, 0.15, 0.65, 0.03])

# 创建滑块
s_freq = Slider(ax_freq, 'Frequency', 0.1, 10.0, valinit=b)
s_amp = Slider(ax_amp, 'Amplitude', 0.1, 10.0, valinit=a)

# 更新函数
def update(val):
    freq = s_freq.val
    amp = s_amp.val
    line.set_ydata(amp * np.sin(freq * t))
    fig.canvas.draw_idle()

# 将更新函数连接到滑块
s_freq.on_changed(update)
s_amp.on_changed(update)

# 创建重置按钮
reset_ax = plt.axes([0.8, 0.025, 0.1, 0.04])
button = Button(reset_ax, 'Reset', hovercolor='0.975')

def reset(event):
    s_freq.reset()
    s_amp.reset()
button.on_clicked(reset)

# 设置标题
ax.set_title('Interactive Sine Wave - how2matplotlib.com', fontsize=16)

# 显示图形
plt.show()

# 打印输出结果
print("The interactive figure has been displayed.")
Output:
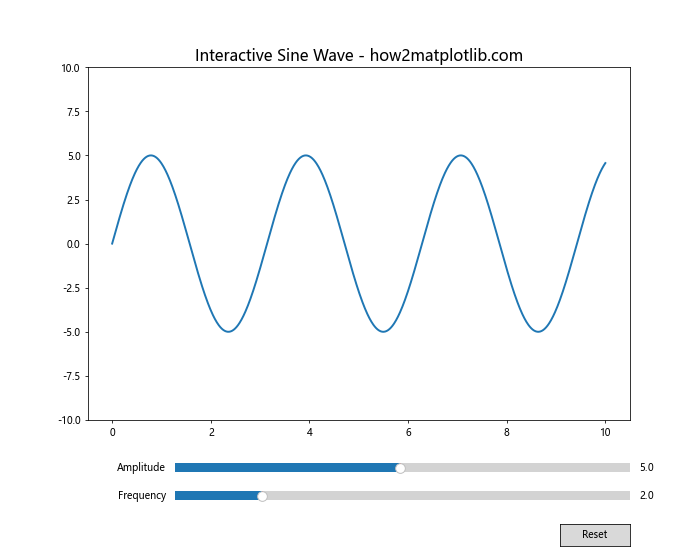
在这个例子中,我们创建了一个交互式的正弦波图表。用户可以通过滑块来调整正弦波的频率和振幅,图表会实时更新以反映这些变化。我们还添加了一个重置按钮,允许用户将参数恢复到初始值。这种交互式图表可以帮助用户更直观地理解参数变化对函数形状的影响。
5. 性能优化和大数据处理
当处理大量数据或需要创建复杂的图表时,性能可能会成为一个问题。以下是一些优化Matplotlib性能的技巧:
5.1 使用面向对象的接口
面向对象的接口通常比pyplot接口更快,特别是在创建多个图表时。以下是一个使用面向对象接口的例子:
import matplotlib.pyplot as plt
import numpy as np
import time

# 生成大量数据
n_points = 1000000
x = np.random.randn(n_points)
y = np.random.randn(n_points)

# 使用面向对象的接口
start_time = time.time()

fig, ax = plt.subplots(figsize=(10, 8))
ax.scatter(x, y, s=1, alpha=0.5)
ax.set_title('Large Dataset Scatter Plot - how2matplotlib.com', fontsize=16)
ax.set_xlabel('X axis', fontsize=12)
ax.set_ylabel('Y axis', fontsize=12)

end_time = time.time()
print(f"Time taken: {end_time - start_time:.2f} seconds")

# 显示图形
plt.show()

# 打印输出结果
print("The figure with a large dataset has been displayed.")
Output:
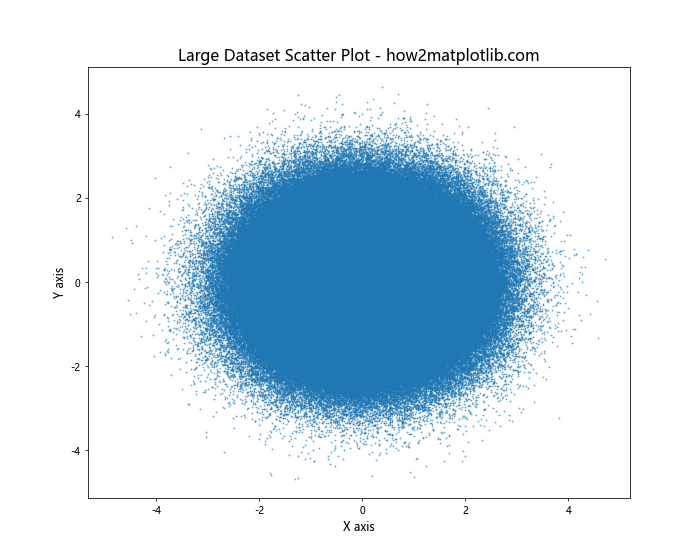
这个例子展示了如何使用面向对象的接口来绘制包含100万个点的散点图。通过直接操作轴对象(ax),我们可以更快地创建和自定义图表。
5.2 使用适当的绘图函数
对于大数据集,某些绘图函数比其他函数更高效。例如,对于大量点的散点图,plot()函数通常比scatter()函数更快:
import matplotlib.pyplot as plt
import numpy as np
import time

# 生成大量数据
n_points = 1000000
x = np.random.randn(n_points)
y = np.random.randn(n_points)

# 创建图形和轴对象
fig, (ax1, ax2) = plt.subplots(1, 2, figsize=(16, 8))

# 使用scatter()函数
start_time = time.time()
ax1.scatter(x, y, s=1, alpha=0.5)
ax1.set_title('scatter() - how2matplotlib.com', fontsize=16)
end_time = time.time()
print(f"Time taken for scatter(): {end_time - start_time:.2f} seconds")

# 使用plot()函数
start_time = time.time()
ax2.plot(x, y, 'o', markersize=1, alpha=0.5)
ax2.set_title('plot() - how2matplotlib.com', fontsize=16)
end_time = time.time()
print(f"Time taken for plot(): {end_time - start_time:.2f} seconds")

# 设置轴标签
for ax in (ax1, ax2):
    ax.set_xlabel('X axis', fontsize=12)
    ax.set_ylabel('Y axis', fontsize=12)

# 调整子图之间的间距
plt.tight_layout()

# 显示图形
plt.show()

# 打印输出结果
print("The comparison of scatter() and plot() has been displayed.")
Output:
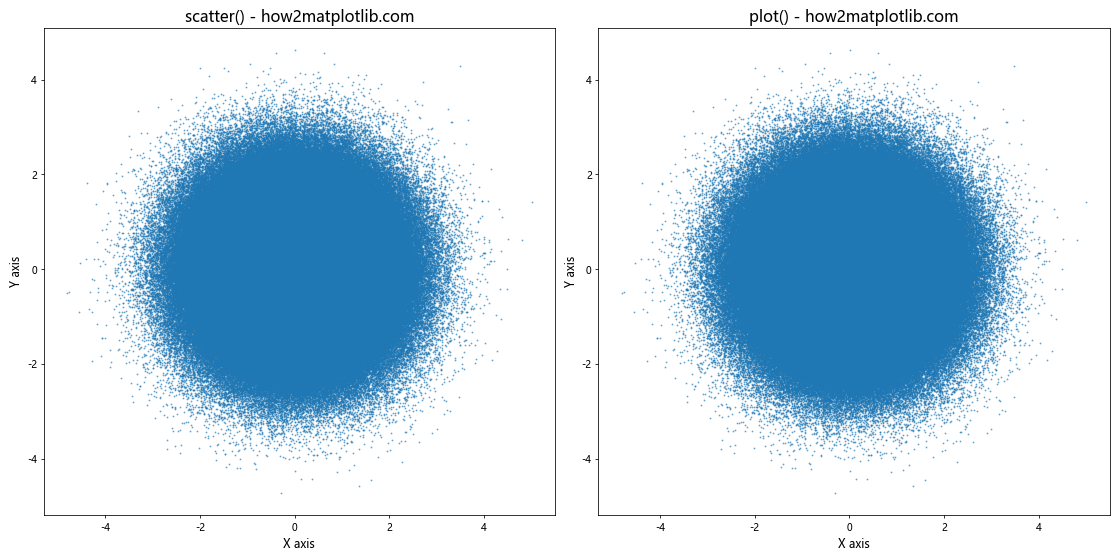
这个例子比较了使用scatter()和plot()函数绘制大量点的性能差异。通常,plot()函数会更快,特别是对于非常大的数据集。
5.3 使用blitting技术进行动画
当创建动画时,使用blitting技术可以显著提高性能。以下是一个使用blitting的动画例子:
import matplotlib.pyplot as plt
import numpy as np
import matplotlib.animation as animation

# 生成初始数据
x = np.linspace(0, 2*np.pi, 100)
y = np.sin(x)

# 创建图形和轴对象
fig, ax = plt.subplots(figsize=(10, 6))
line, = ax.plot(x, y)

# 设置轴范围
ax.set_xlim(0, 2*np.pi)
ax.set_ylim(-1.1, 1.1)

# 设置标题和轴标签
ax.set_title('Animated Sine Wave - how2matplotlib.com', fontsize=16)
ax.set_xlabel('X axis', fontsize=12)
ax.set_ylabel('Y axis', fontsize=12)

# 更新函数
def update(frame):
    line.set_ydata(np.sin(x + frame/10))
    return line,

# 创建动画
ani = animation.FuncAnimation(fig, update, frames=np.linspace(0, 2*np.pi, 128),
                              interval=50, blit=True)

# 显示动画
plt.show()

# 打印输出结果
print("The animated sine wave has been displayed.")
Output:
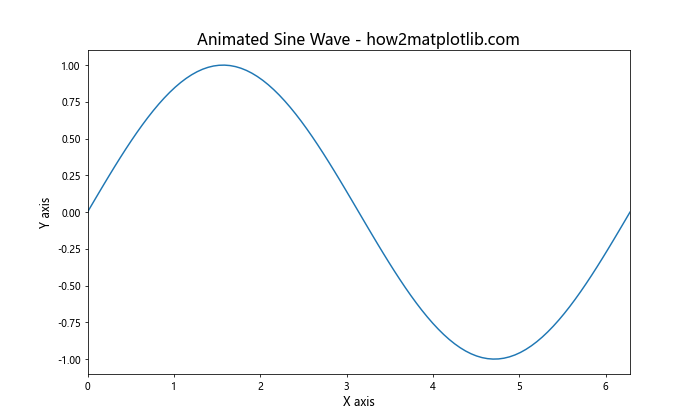
在这个例子中,我们创建了一个正弦波的动画。通过设置blit=True,我们启用了blitting技术,这可以显著提高动画的性能,特别是对于复杂的图表。
5.4 使用适当的文件格式保存图表
当保存图表时,选择适当的文件格式可以在文件大小和图像质量之间取得平衡。以下是一个比较不同文件格式的例子:
import matplotlib.pyplot as plt
import numpy as np
import time

# 生成示例数据
x = np.linspace(0, 10, 1000)
y = np.sin(x) * np.exp(-x/10)

# 创建图形和轴对象
fig, ax = plt.subplots(figsize=(10, 6))

# 绘制数据
ax.plot(x, y)

# 设置标题和轴标签
ax.set_title('File Format Comparison - how2matplotlib.com', fontsize=16)
ax.set_xlabel('X axis', fontsize=12)
ax.set_ylabel('Y axis', fontsize=12)

# 保存为不同格式并比较
formats = ['png', 'jpg', 'svg', 'pdf']

for fmt in formats:
    start_time = time.time()
    plt.savefig(f'plot.{fmt}', format=fmt, dpi=300)
    end_time = time.time()
    print(f"Time taken to save as {fmt}: {end_time - start_time:.2f} seconds")

# 显示图形
plt.show()

# 打印输出结果
print("The figure has been saved in different formats.")
Output:
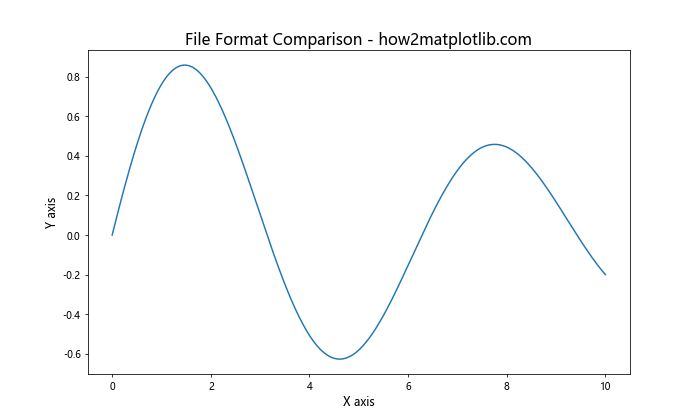
这个例子展示了如何将同一个图表保存为不同的文件格式(PNG、JPG、SVG和PDF),并比较了保存时间。一般来说,PNG适合大多数用途,SVG适合需要缩放的矢量图,而PDF适合打印质量的输出。
6. 高级图表类型
Matplotlib支持多种高级图表类型,可以用于特定的数据可视化需求。以下是一些常用的高级图表类型:
6.1 极坐标图
极坐标图适用于周期性数据或角度数据的可视化:
import matplotlib.pyplot as plt
import numpy as np

# 生成数据
r = np.linspace(0, 2, 100)
theta = 2 * np.pi * r

# 创建极坐标图
fig, ax = plt.subplots(figsize=(8, 8), subplot_kw=dict(projection='polar'))

# 绘制螺旋线
ax.plot(theta, r)

# 设置标题
ax.set_title('Polar Plot: Spiral - how2matplotlib.com', fontsize=16)

# 显示图形
plt.show()

# 打印输出结果
print("The polar plot has been displayed.")
Output:
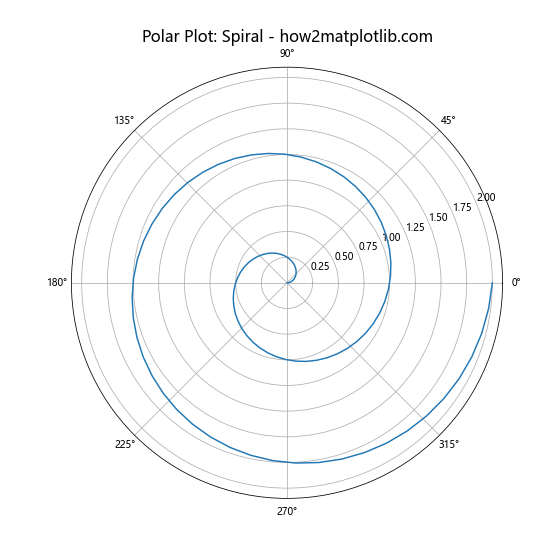
这个例子创建了一个简单的螺旋线极坐标图。极坐标图特别适合可视化周期性数据或方向性数据。
6.2 3D图表
Matplotlib的mplot3d工具包支持创建各种3D图表:
import matplotlib.pyplot as plt
import numpy as np
from mpl_toolkits.mplot3d import Axes3D

# 生成数据
x = np.linspace(-5, 5, 50)
y = np.linspace(-5, 5, 50)
X, Y = np.meshgrid(x, y)
Z = np.sin(np.sqrt(X**2 + Y**2))

# 创建3D图形
fig = plt.figure(figsize=(10, 8))
ax = fig.add_subplot(111, projection='3d')

# 绘制3D表面
surf = ax.plot_surface(X, Y, Z, cmap='viridis')

# 添加颜色条
fig.colorbar(surf)

# 设置标题和轴标签
ax.set_title('3D Surface Plot - how2matplotlib.com', fontsize=16)
ax.set_xlabel('X axis', fontsize=12)
ax.set_ylabel('Y axis', fontsize=12)
ax.set_zlabel('Z axis', fontsize=12)

# 显示图形
plt.show()

# 打印输出结果
print("The 3D surface plot has been displayed.")
Output:
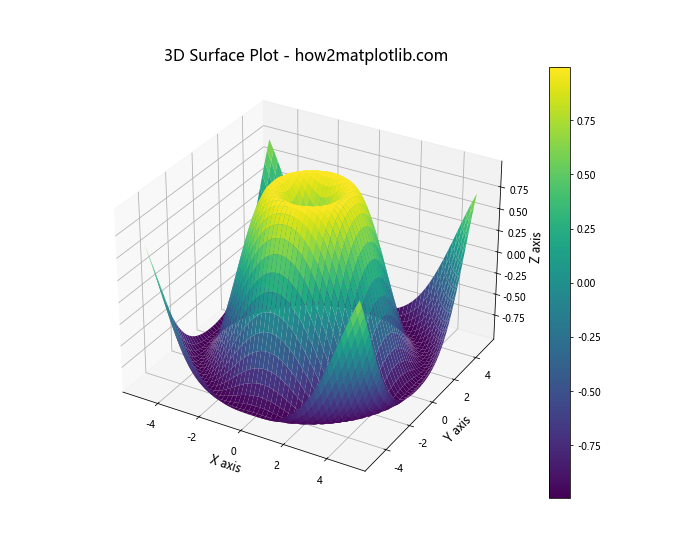
这个例子创建了一个3D表面图,展示了一个二元函数的形状。3D图表可以帮助我们直观地理解三维数据的结构和关系。
6.3 箱线图
箱线图用于显示数据分布的关键统计信息:
import matplotlib.pyplot as plt
import numpy as np

# 生成示例数据
np.random.seed(42)
data = [np.random.normal(0, std, 100) for std in range(1, 4)]

# 创建箱线图
fig, ax = plt.subplots(figsize=(10, 6))
bp = ax.boxplot(data, patch_artist=True)

# 自定义箱线图颜色
colors = ['lightblue', 'lightgreen', 'lightpink']
for patch, color in zip(bp['boxes'], colors):
    patch.set_facecolor(color)

# 设置标题和轴标签
ax.set_title('Box Plot - how2matplotlib.com', fontsize=16)
ax.set_xlabel('Group', fontsize=12)
ax.set_ylabel('Value', fontsize=12)

# 设置X轴刻度标签
ax.set_xticklabels(['Group 1', 'Group 2', 'Group 3'])

# 显示图形
plt.show()

# 打印输出结果
print("The box plot has been displayed.")
Output:
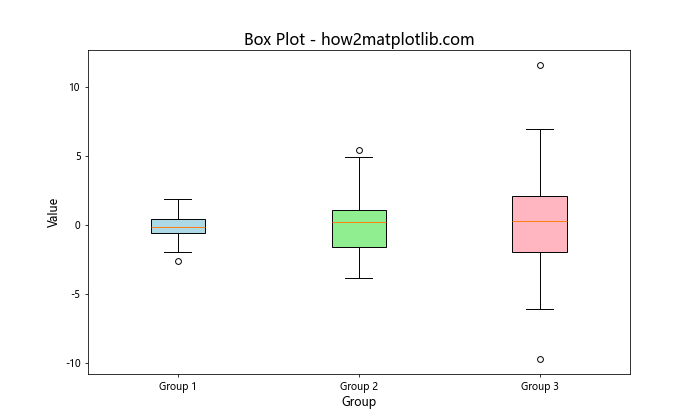
这个例子创建了一个箱线图,展示了三组数据的分布情况。箱线图可以直观地显示数据的中位数、四分位数范围和异常值。
6.4 小提琴图
小提琴图是箱线图的一种变体,它还显示了概率密度:
import matplotlib.pyplot as plt
import numpy as np

# 生成示例数据
np.random.seed(42)
data = [np.random.normal(0, std, 1000) for std in range(1, 4)]

# 创建小提琴图
fig, ax = plt.subplots(figsize=(10, 6))
vp = ax.violinplot(data, showmeans=True, showmedians=True)

# 自定义小提琴图颜色
colors = ['lightblue', 'lightgreen', 'lightpink']
for body, color in zip(vp['bodies'], colors):
    body.set_facecolor(color)
    body.set_edgecolor('black')
    body.set_alpha(0.7)

# 设置标题和轴标签
ax.set_title('Violin Plot - how2matplotlib.com', fontsize=16)
ax.set_xlabel('Group', fontsize=12)
ax.set_ylabel('Value', fontsize=12)

# 设置X轴刻度标签
ax.set_xticks([1, 2, 3])
ax.set_xticklabels(['Group 1', 'Group 2', 'Group 3'])

# 显示图形
plt.show()

# 打印输出结果
print("The violin plot has been displayed.")
Output:
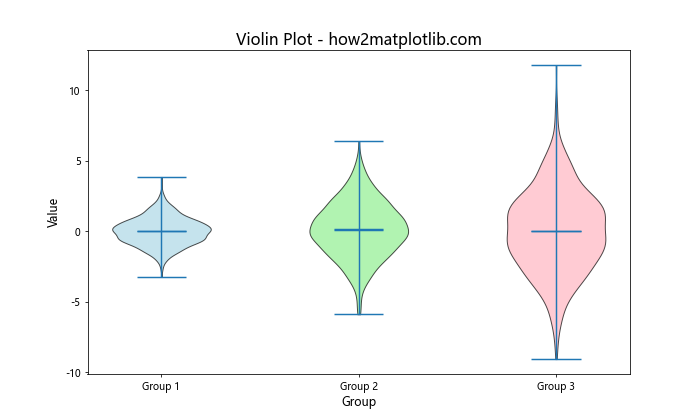
小提琴图不仅显示了数据的分布范围,还通过形状的宽度展示了数据在不同值上的概率密度。这使得小提琴图比箱线图提供了更多的分布信息。
7. 结合其他库使用Matplotlib
Matplotlib可以与其他Python库结合使用,以增强其功能或简化某些任务。以下是一些常见的组合:
7.1 与Pandas结合使用
Pandas是一个强大的数据分析库,它与Matplotlib有很好的集成:
import matplotlib.pyplot as plt
import pandas as pd
import numpy as np

# 创建示例数据
dates = pd.date_range('20230101', periods=100)
df = pd.DataFrame(np.random.randn(100, 4), index=dates, columns=list('ABCD'))

# 使用Pandas的plot方法
ax = df.plot(figsize=(10, 6))

# 设置标题和轴标签
ax.set_title('Pandas DataFrame Plot - how2matplotlib.com', fontsize=16)
ax.set_xlabel('Date', fontsize=12)
ax.set_ylabel('Value', fontsize=12)

# 旋转X轴标签
plt.xticks(rotation=45)

# 显示图形
plt.tight_layout()
plt.show()

# 打印输出结果
print("The Pandas DataFrame plot has been displayed.")
Output:
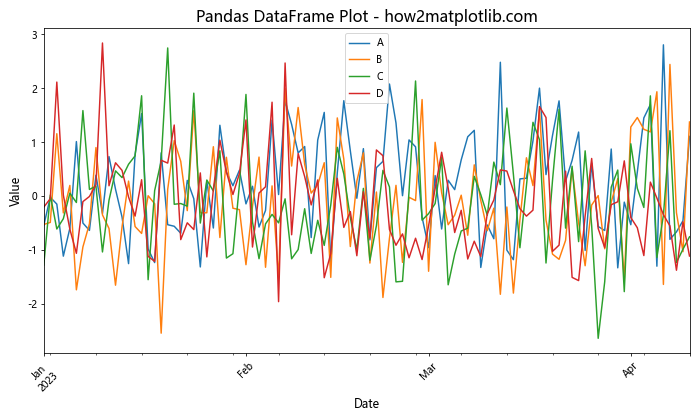
这个例子展示了如何直接使用Pandas DataFrame的plot方法来创建图表。Pandas提供了许多便捷的绘图功能,这些功能在底层使用了Matplotlib。
7.2 与Seaborn结合使用
Seaborn是基于Matplotlib的统计数据可视化库,它提供了更高级的图表类型和更美观的默认样式:
import matplotlib.pyplot as plt
import seaborn as sns
import numpy as np

# 设置Seaborn样式
sns.set_style("whitegrid")

# 生成示例数据
tips = sns.load_dataset("tips")

# 创建图形和轴对象
fig, ax = plt.subplots(figsize=(10, 6))

# 使用Seaborn绘制小提琴图
sns.violinplot(x="day", y="total_bill", hue="sex", data=tips, split=True, ax=ax)

# 设置标题
ax.set_title('Seaborn Violin Plot - how2matplotlib.com', fontsize=16)

# 显示图形
plt.show()

# 打印输出结果
print("The Seaborn violin plot has been displayed.")
Output:
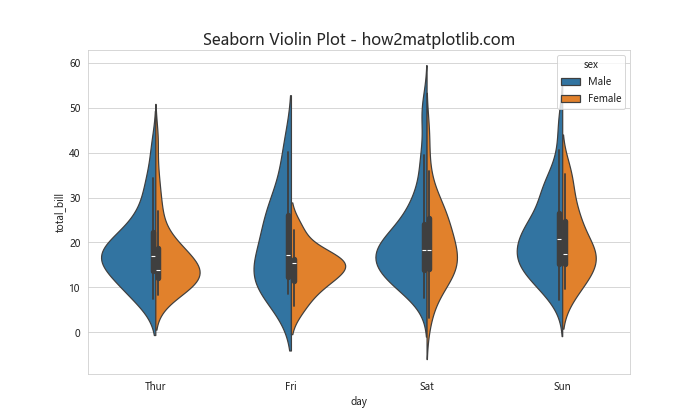
这个例子展示了如何使用Seaborn创建一个分组的小提琴图。Seaborn提供了许多高级的统计图表类型,同时保持了与Matplotlib的兼容性。
8. 总结
Matplotlib是一个功能强大且灵活的Python数据可视化库。通过本文的详细介绍,我们深入探讨了如何使用subplots创建多子图布局,以及如何使用ylim调整Y轴范围。我们还介绍了许多高级技巧,包括自定义样式、处理大数据集、创建交互式图表和高级图表类型。
掌握这些技巧将使你能够创建更加复杂、信息丰富和视觉吸引力的数据可视化。记住,好的数据可视化不仅仅是展示数据,更是讲述数据背后的故事。通过合理使用Matplotlib的各种功能,你可以更有效地传达数据中的洞察和发现。
 极客教程
极客教程