Matplotlib Slider Widget:交互式数据可视化的强大工具
Matplotlib是Python中最流行的数据可视化库之一,而Slider Widget是其中一个强大的交互式工具。本文将深入探讨Matplotlib Slider Widget的使用方法、应用场景以及高级技巧,帮助您充分利用这一功能,创建动态、交互式的数据可视化作品。
1. Matplotlib Slider Widget简介
Matplotlib Slider Widget是一个交互式控件,允许用户通过滑动条来动态调整图表中的参数。这个功能非常适合用于探索数据、演示数学概念或创建交互式数据可视化应用。
以下是一个简单的Slider Widget示例:
import numpy as np
import matplotlib.pyplot as plt
from matplotlib.widgets import Slider

fig, ax = plt.subplots()
plt.subplots_adjust(bottom=0.25)

t = np.arange(0.0, 1.0, 0.001)
a0 = 5
f0 = 3
s = a0 * np.sin(2 * np.pi * f0 * t)

l, = plt.plot(t, s, lw=2)
ax.set_xlabel('Time (s)')
ax.set_ylabel('Amplitude')
ax.set_title('how2matplotlib.com: Simple Sine Wave')

ax_freq = plt.axes([0.25, 0.1, 0.65, 0.03])
slider_freq = Slider(ax_freq, 'Frequency', 0.1, 30.0, valinit=f0)

def update(val):
    freq = slider_freq.val
    l.set_ydata(a0 * np.sin(2 * np.pi * freq * t))
    fig.canvas.draw_idle()

slider_freq.on_changed(update)

plt.show()
Output:

在这个例子中,我们创建了一个正弦波图表,并添加了一个滑动条来调整频率。用户可以通过移动滑动条来实时改变正弦波的频率。
2. Slider Widget的基本结构
Slider Widget主要由以下几个部分组成:
- 图形对象(Figure)和轴对象(Axes)
- Slider对象
- 更新函数
- 事件连接
让我们详细了解每个部分:
2.1 创建图形和轴对象
首先,我们需要创建一个图形对象和轴对象:
import matplotlib.pyplot as plt

fig, ax = plt.subplots()
plt.subplots_adjust(bottom=0.25)  # 为滑动条留出空间

# 在这里绘制初始图形
ax.plot([0, 1, 2, 3, 4], [0, 1, 4, 9, 16], label='how2matplotlib.com')
ax.set_xlabel('X-axis')
ax.set_ylabel('Y-axis')
ax.set_title('how2matplotlib.com: Quadratic Function')
ax.legend()
这段代码创建了一个基本的图形,我们将在此基础上添加Slider Widget。
2.2 创建Slider对象
接下来,我们创建Slider对象:
from matplotlib.widgets import Slider

ax_slider = plt.axes([0.25, 0.1, 0.65, 0.03])
slider = Slider(ax_slider, 'Parameter', 0, 10, valinit=5)
这里,我们定义了滑动条的位置、标签、范围和初始值。
2.3 定义更新函数
更新函数是Slider Widget的核心,它定义了当滑动条值改变时应该执行的操作:
def update(val):
    # 获取滑动条的当前值
    param = slider.val

    # 更新图形
    ax.clear()
    ax.plot([0, 1, 2, 3, 4], [0, param, param*4, param*9, param*16], label='how2matplotlib.com')
    ax.set_xlabel('X-axis')
    ax.set_ylabel('Y-axis')
    ax.set_title(f'how2matplotlib.com: Quadratic Function (a={param:.2f})')
    ax.legend()

    # 重绘图形
    fig.canvas.draw_idle()
2.4 连接事件
最后,我们需要将更新函数与滑动条的值变化事件连接起来:
slider.on_changed(update)

plt.show()
这样,每当滑动条的值发生变化时,update函数就会被调用,从而更新图形。
3. Slider Widget的高级应用
3.1 多个滑动条
在某些情况下,我们可能需要多个滑动条来控制不同的参数。以下是一个使用两个滑动条的示例:
import numpy as np
import matplotlib.pyplot as plt
from matplotlib.widgets import Slider

fig, ax = plt.subplots()
plt.subplots_adjust(bottom=0.3)

t = np.arange(0.0, 1.0, 0.001)
a0, f0 = 5, 3
s = a0 * np.sin(2 * np.pi * f0 * t)

l, = plt.plot(t, s, lw=2)
ax.set_xlabel('Time (s)')
ax.set_ylabel('Amplitude')
ax.set_title('how2matplotlib.com: Sine Wave with Amplitude and Frequency Control')

ax_freq = plt.axes([0.25, 0.1, 0.65, 0.03])
ax_amp = plt.axes([0.25, 0.15, 0.65, 0.03])

slider_freq = Slider(ax_freq, 'Frequency', 0.1, 30.0, valinit=f0)
slider_amp = Slider(ax_amp, 'Amplitude', 0.1, 10.0, valinit=a0)

def update(val):
    freq = slider_freq.val
    amp = slider_amp.val
    l.set_ydata(amp * np.sin(2 * np.pi * freq * t))
    fig.canvas.draw_idle()

slider_freq.on_changed(update)
slider_amp.on_changed(update)

plt.show()
Output:
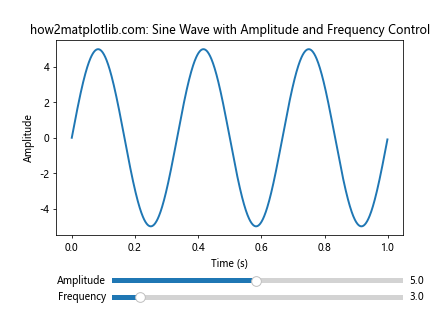
在这个例子中,我们使用两个滑动条分别控制正弦波的频率和振幅。
3.2 使用Slider控制颜色
Slider不仅可以用于控制数值参数,还可以用于调整颜色。以下是一个使用Slider控制颜色的示例:
import numpy as np
import matplotlib.pyplot as plt
from matplotlib.widgets import Slider
from matplotlib.colors import rgb_to_hsv, hsv_to_rgb

fig, ax = plt.subplots()
plt.subplots_adjust(bottom=0.3)

x = np.linspace(0, 10, 100)
y = np.sin(x)

line, = ax.plot(x, y, lw=2)
ax.set_xlabel('X-axis')
ax.set_ylabel('Y-axis')
ax.set_title('how2matplotlib.com: Color Control with Slider')

ax_hue = plt.axes([0.25, 0.1, 0.65, 0.03])
ax_saturation = plt.axes([0.25, 0.15, 0.65, 0.03])
ax_value = plt.axes([0.25, 0.2, 0.65, 0.03])

slider_hue = Slider(ax_hue, 'Hue', 0, 1, valinit=0.5)
slider_saturation = Slider(ax_saturation, 'Saturation', 0, 1, valinit=1)
slider_value = Slider(ax_value, 'Value', 0, 1, valinit=1)

def update(val):
    h = slider_hue.val
    s = slider_saturation.val
    v = slider_value.val
    rgb = hsv_to_rgb((h, s, v))
    line.set_color(rgb)
    fig.canvas.draw_idle()

slider_hue.on_changed(update)
slider_saturation.on_changed(update)
slider_value.on_changed(update)

plt.show()
Output:
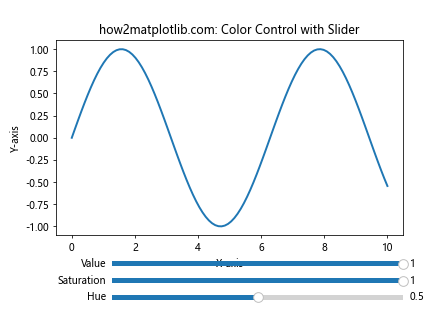
这个例子展示了如何使用三个滑动条来控制线条的颜色,分别对应HSV颜色空间的色相、饱和度和亮度。
3.3 动态更新数据
Slider Widget还可以用于动态更新数据源。以下是一个示例,展示如何使用滑动条来控制显示的数据范围:
import numpy as np
import matplotlib.pyplot as plt
from matplotlib.widgets import Slider

# 生成示例数据
np.random.seed(0)
x = np.linspace(0, 100, 1000)
y = np.cumsum(np.random.randn(1000))

fig, ax = plt.subplots()
plt.subplots_adjust(bottom=0.25)

line, = ax.plot(x, y)
ax.set_xlabel('X-axis')
ax.set_ylabel('Y-axis')
ax.set_title('how2matplotlib.com: Dynamic Data Range')

ax_slider = plt.axes([0.25, 0.1, 0.65, 0.03])
slider = Slider(ax_slider, 'Data Range', 10, 100, valinit=100, valstep=1)

def update(val):
    data_range = int(slider.val)
    ax.clear()
    ax.plot(x[:data_range], y[:data_range])
    ax.set_xlabel('X-axis')
    ax.set_ylabel('Y-axis')
    ax.set_title(f'how2matplotlib.com: Dynamic Data Range (n={data_range})')
    fig.canvas.draw_idle()

slider.on_changed(update)

plt.show()
Output:
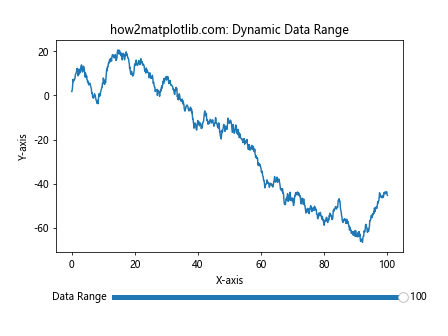
在这个例子中,滑动条控制显示的数据点数量,允许用户动态调整数据范围。
4. Slider Widget的样式定制
Matplotlib提供了多种方法来定制Slider Widget的外观。以下是一些常用的样式定制技巧:
4.1 更改滑动条颜色
我们可以通过设置Slider的color参数来改变滑动条的颜色:
import numpy as np
import matplotlib.pyplot as plt
from matplotlib.widgets import Slider

fig, ax = plt.subplots()
plt.subplots_adjust(bottom=0.25)

t = np.arange(0.0, 1.0, 0.001)
a0 = 5
f0 = 3
s = a0 * np.sin(2 * np.pi * f0 * t)

l, = plt.plot(t, s, lw=2)
ax.set_xlabel('Time (s)')
ax.set_ylabel('Amplitude')
ax.set_title('how2matplotlib.com: Customized Slider Color')

ax_freq = plt.axes([0.25, 0.1, 0.65, 0.03])
slider_freq = Slider(ax_freq, 'Frequency', 0.1, 30.0, valinit=f0, color='lightgreen')

def update(val):
    freq = slider_freq.val
    l.set_ydata(a0 * np.sin(2 * np.pi * freq * t))
    fig.canvas.draw_idle()

slider_freq.on_changed(update)

plt.show()
Output:
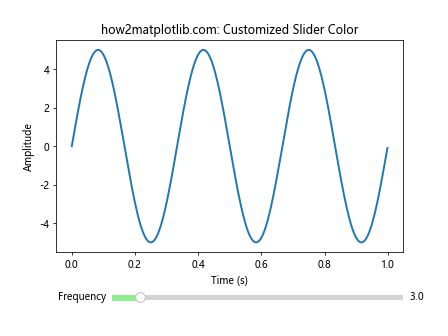
在这个例子中,我们将滑动条的颜色设置为浅绿色。
4.2 自定义滑动条样式
我们还可以更进一步,自定义滑动条的各个部分的样式:
import numpy as np
import matplotlib.pyplot as plt
from matplotlib.widgets import Slider

fig, ax = plt.subplots()
plt.subplots_adjust(bottom=0.25)

t = np.arange(0.0, 1.0, 0.001)
a0 = 5
f0 = 3
s = a0 * np.sin(2 * np.pi * f0 * t)

l, = plt.plot(t, s, lw=2)
ax.set_xlabel('Time (s)')
ax.set_ylabel('Amplitude')
ax.set_title('how2matplotlib.com: Highly Customized Slider')

ax_freq = plt.axes([0.25, 0.1, 0.65, 0.03])
slider_freq = Slider(
    ax_freq, 'Frequency', 0.1, 30.0,
    valinit=f0,
    valstep=0.1,
    color='lightblue',
    initcolor='none'
)

slider_freq.handle.set_facecolor('red')
slider_freq.handle.set_edgecolor('black')
slider_freq.track.set_facecolor('lightgray')

def update(val):
    freq = slider_freq.val
    l.set_ydata(a0 * np.sin(2 * np.pi * freq * t))
    fig.canvas.draw_idle()

slider_freq.on_changed(update)

plt.show()
在这个例子中,我们自定义了滑动条的轨道颜色、滑块颜色和边框颜色。
5. Slider Widget的实际应用场景
Slider Widget在许多实际应用中都非常有用。以下是一些常见的应用场景:
5.1 数学函数可视化
Slider Widget非常适合用于数学函数的可视化和教学。以下是一个二次函数可视化的例子:
import numpy as np
import matplotlib.pyplot as plt
from matplotlib.widgets import Slider

fig, ax = plt.subplots()
plt.subplots_adjust(bottom=0.35)

x = np.linspace(-10, 10, 1000)
a, b, c = 1, 0, 0
y = a * x**2 + b * x + c

line, = ax.plot(x, y)
ax.set_xlabel('X-axis')
ax.set_ylabel('Y-axis')
ax.set_title('how2matplotlib.com: Quadratic Function Visualization')

ax_a = plt.axes([0.25, 0.15, 0.65, 0.03])
ax_b = plt.axes([0.25, 0.1, 0.65, 0.03])
ax_c = plt.axes([0.25, 0.05,0.65, 0.03])

slider_a = Slider(ax_a, 'a', -5, 5, valinit=a)
slider_b = Slider(ax_b, 'b', -10, 10, valinit=b)
slider_c = Slider(ax_c, 'c', -10, 10, valinit=c)

def update(val):
    a = slider_a.val
    b = slider_b.val
    c = slider_c.val
    y = a * x**2 + b * x + c
    line.set_ydata(y)
    ax.set_ylim(min(y), max(y))
    fig.canvas.draw_idle()

slider_a.on_changed(update)
slider_b.on_changed(update)
slider_c.on_changed(update)

plt.show()
Output:
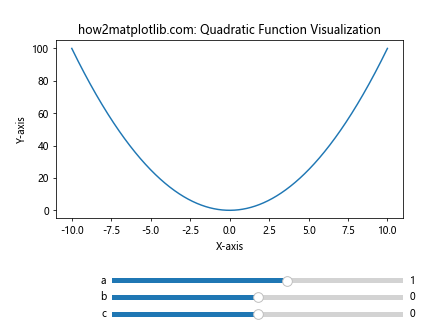
这个例子允许用户通过滑动条调整二次函数 f(x) = ax^2 + bx + c 的参数 a、b 和 c,实时观察函数图像的变化。
5.2 数据过滤和探索
Slider Widget 也可以用于数据过滤和探索。以下是一个使用滑动条过滤数据的例子:
import numpy as np
import matplotlib.pyplot as plt
from matplotlib.widgets import Slider

# 生成示例数据
np.random.seed(0)
x = np.random.randn(1000)
y = np.random.randn(1000)

fig, ax = plt.subplots()
plt.subplots_adjust(bottom=0.25)

scatter = ax.scatter(x, y, alpha=0.5)
ax.set_xlabel('X-axis')
ax.set_ylabel('Y-axis')
ax.set_title('how2matplotlib.com: Data Filtering with Slider')

ax_slider = plt.axes([0.25, 0.1, 0.65, 0.03])
slider = Slider(ax_slider, 'Filter Threshold', 0, 3, valinit=1.5)

def update(val):
    threshold = slider.val
    distances = np.sqrt(x**2 + y**2)
    mask = distances < threshold
    scatter.set_offsets(np.column_stack((x[mask], y[mask])))
    fig.canvas.draw_idle()

slider.on_changed(update)

plt.show()
Output:
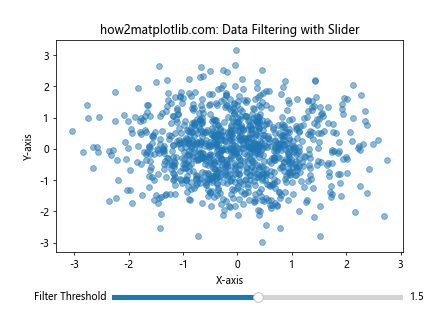
在这个例子中,滑动条控制数据点到原点的距离阈值,只显示距离小于阈值的点。
5.3 图像处理
Slider Widget 在图像处理中也有广泛应用。以下是一个使用滑动条调整图像亮度的例子:
import numpy as np
import matplotlib.pyplot as plt
from matplotlib.widgets import Slider

# 创建一个示例图像
image = np.random.rand(100, 100)

fig, ax = plt.subplots()
plt.subplots_adjust(bottom=0.25)

im = ax.imshow(image, cmap='gray')
ax.set_title('how2matplotlib.com: Image Brightness Adjustment')

ax_slider = plt.axes([0.25, 0.1, 0.65, 0.03])
slider = Slider(ax_slider, 'Brightness', 0.1, 2.0, valinit=1.0)

def update(val):
    brightness = slider.val
    im.set_data(np.clip(image * brightness, 0, 1))
    fig.canvas.draw_idle()

slider.on_changed(update)

plt.show()
Output:
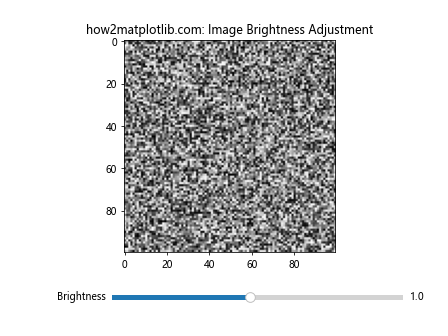
这个例子展示了如何使用滑动条来调整图像的亮度。
6. Slider Widget 的高级技巧
6.1 动态更新滑动条范围
有时,我们可能需要根据某些条件动态更新滑动条的范围。以下是一个示例:
import numpy as np
import matplotlib.pyplot as plt
from matplotlib.widgets import Slider, Button

fig, ax = plt.subplots()
plt.subplots_adjust(bottom=0.35)

t = np.arange(0.0, 1.0, 0.001)
a0 = 5
f0 = 3
s = a0 * np.sin(2 * np.pi * f0 * t)

l, = plt.plot(t, s, lw=2)
ax.set_xlabel('Time (s)')
ax.set_ylabel('Amplitude')
ax.set_title('how2matplotlib.com: Dynamic Slider Range')

ax_freq = plt.axes([0.25, 0.1, 0.65, 0.03])
slider_freq = Slider(ax_freq, 'Frequency', 0.1, 30.0, valinit=f0)

ax_button = plt.axes([0.8, 0.025, 0.1, 0.04])
button = Button(ax_button, 'Extend')

def update(val):
    freq = slider_freq.val
    l.set_ydata(a0 * np.sin(2 * np.pi * freq * t))
    fig.canvas.draw_idle()

def extend(event):
    current_max = slider_freq.valmax
    slider_freq.valmax = current_max * 2
    ax_freq.set_xlim(slider_freq.valmin, slider_freq.valmax)
    fig.canvas.draw_idle()

slider_freq.on_changed(update)
button.on_clicked(extend)

plt.show()
Output:
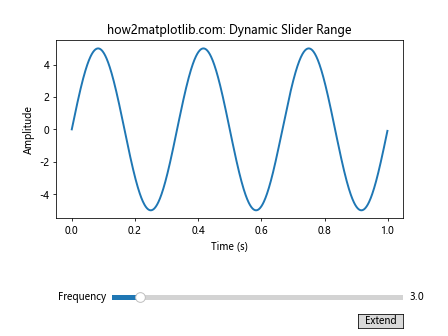
在这个例子中,我们添加了一个按钮,点击后可以将滑动条的最大值翻倍。
6.2 使用多个图形和滑动条
有时,我们可能需要在一个窗口中显示多个图形,并使用滑动条控制它们。以下是一个示例:
import numpy as np
import matplotlib.pyplot as plt
from matplotlib.widgets import Slider

fig, (ax1, ax2) = plt.subplots(2, 1, figsize=(8, 10))
plt.subplots_adjust(bottom=0.25)

t = np.arange(0.0, 1.0, 0.001)
a0 = 5
f0 = 3
s1 = a0 * np.sin(2 * np.pi * f0 * t)
s2 = a0 * np.cos(2 * np.pi * f0 * t)

l1, = ax1.plot(t, s1, lw=2)
l2, = ax2.plot(t, s2, lw=2)

ax1.set_xlabel('Time (s)')
ax1.set_ylabel('Amplitude')
ax1.set_title('how2matplotlib.com: Sine Wave')

ax2.set_xlabel('Time (s)')
ax2.set_ylabel('Amplitude')
ax2.set_title('how2matplotlib.com: Cosine Wave')

ax_freq = plt.axes([0.25, 0.1, 0.65, 0.03])
slider_freq = Slider(ax_freq, 'Frequency', 0.1, 30.0, valinit=f0)

def update(val):
    freq = slider_freq.val
    l1.set_ydata(a0 * np.sin(2 * np.pi * freq * t))
    l2.set_ydata(a0 * np.cos(2 * np.pi * freq * t))
    fig.canvas.draw_idle()

slider_freq.on_changed(update)

plt.show()
Output:
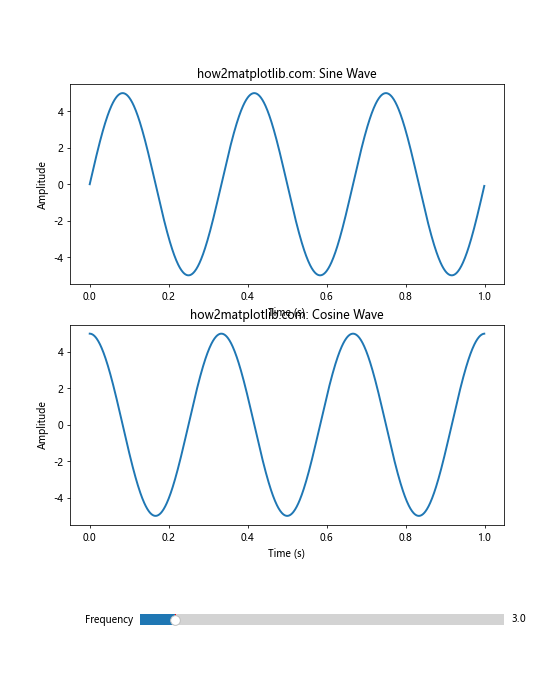
这个例子展示了如何使用一个滑动条同时控制两个不同的图形。
6.3 结合其他交互式工具
Slider Widget 可以与其他 Matplotlib 交互式工具结合使用,如 Button、RadioButtons 等。以下是一个结合 Slider 和 RadioButtons 的例子:
import numpy as np
import matplotlib.pyplot as plt
from matplotlib.widgets import Slider, RadioButtons

fig, ax = plt.subplots()
plt.subplots_adjust(left=0.3, bottom=0.25)

t = np.arange(0.0, 1.0, 0.001)
a0 = 5
f0 = 3
s = a0 * np.sin(2 * np.pi * f0 * t)

l, = plt.plot(t, s, lw=2)
ax.set_xlabel('Time (s)')
ax.set_ylabel('Amplitude')
ax.set_title('how2matplotlib.com: Waveform Generator')

ax_freq = plt.axes([0.25, 0.1, 0.65, 0.03])
slider_freq = Slider(ax_freq, 'Frequency', 0.1, 30.0, valinit=f0)

ax_radio = plt.axes([0.05, 0.7, 0.15, 0.15])
radio = RadioButtons(ax_radio, ('Sine', 'Cosine', 'Square'))

def update_freq(val):
    freq = slider_freq.val
    func = wave_funcs[radio.value_selected]
    l.set_ydata(a0 * func(2 * np.pi * freq * t))
    fig.canvas.draw_idle()

def update_func(label):
    freq = slider_freq.val
    func = wave_funcs[label]
    l.set_ydata(a0 * func(2 * np.pi * freq * t))
    fig.canvas.draw_idle()

wave_funcs = {
    'Sine': np.sin,
    'Cosine': np.cos,
    'Square': lambda x: np.sign(np.sin(x))
}

slider_freq.on_changed(update_freq)
radio.on_clicked(update_func)

plt.show()
Output:
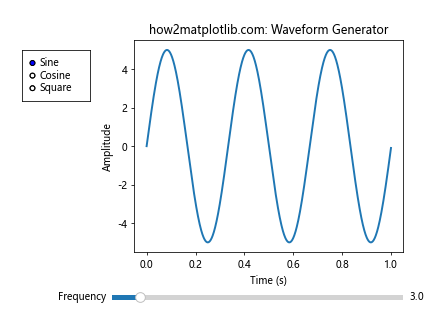
这个例子展示了如何结合使用 Slider 和 RadioButtons 来创建一个简单的波形发生器。
7. Slider Widget 的性能优化
在处理大量数据或复杂计算时,Slider Widget 的性能可能会成为一个问题。以下是一些优化建议:
7.1 使用 blitting
Blitting 是一种优化技术,可以显著提高动画的性能。以下是一个使用 blitting 的例子:
import numpy as np
import matplotlib.pyplot as plt
from matplotlib.widgets import Slider

fig, ax = plt.subplots()
plt.subplots_adjust(bottom=0.25)

t = np.arange(0.0, 1.0, 0.001)
a0 = 5
f0 = 3
s = a0 * np.sin(2 * np.pi * f0 * t)

l, = plt.plot(t, s, lw=2)
ax.set_xlabel('Time (s)')
ax.set_ylabel('Amplitude')
ax.set_title('how2matplotlib.com: Optimized Slider with Blitting')

ax_freq = plt.axes([0.25, 0.1, 0.65, 0.03])
slider_freq = Slider(ax_freq, 'Frequency', 0.1, 30.0, valinit=f0)

# 存储背景
background = fig.canvas.copy_from_bbox(ax.bbox)

def update(val):
    freq = slider_freq.val
    l.set_ydata(a0 * np.sin(2 * np.pi * freq * t))

    # 恢复背景
    fig.canvas.restore_region(background)

    # 重绘线条
    ax.draw_artist(l)

    # 更新画布
    fig.canvas.blit(ax.bbox)

slider_freq.on_changed(update)

plt.show()
Output:
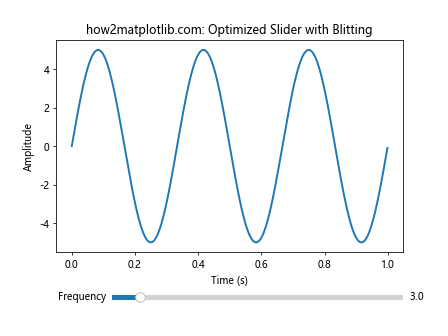
这个例子使用了 blitting 技术来优化性能,特别适用于处理大量数据点的情况。
7.2 减少更新频率
在某些情况下,我们可能不需要对滑动条的每次微小变化都进行更新。我们可以通过设置一个更新阈值来减少更新频率:
import numpy as np
import matplotlib.pyplot as plt
from matplotlib.widgets import Slider

fig, ax = plt.subplots()
plt.subplots_adjust(bottom=0.25)

t = np.arange(0.0, 1.0, 0.001)
a0 = 5
f0 = 3
s = a0 * np.sin(2 * np.pi * f0 * t)

l, = plt.plot(t, s, lw=2)
ax.set_xlabel('Time (s)')
ax.set_ylabel('Amplitude')
ax.set_title('how2matplotlib.com: Reduced Update Frequency')

ax_freq = plt.axes([0.25, 0.1, 0.65, 0.03])
slider_freq = Slider(ax_freq, 'Frequency', 0.1, 30.0, valinit=f0)

last_update = 0
update_threshold = 0.1

def update(val):
    global last_update
    if abs(val - last_update) > update_threshold:
        freq = slider_freq.val
        l.set_ydata(a0 * np.sin(2 * np.pi * freq * t))
        fig.canvas.draw_idle()
        last_update = val

slider_freq.on_changed(update)

plt.show()
Output:
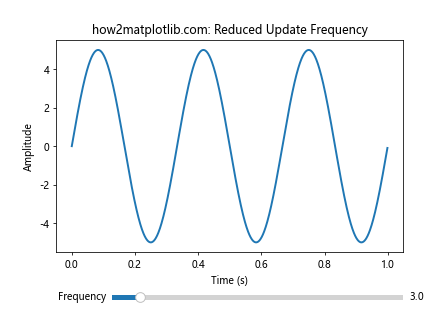
这个例子只在滑动条的值变化超过一定阈值时才更新图形,从而减少不必要的计算和重绘。
8. Slider Widget 的常见问题和解决方案
在使用 Slider Widget 时,可能会遇到一些常见问题。以下是一些问题及其解决方案:
8.1 滑动条响应延迟
问题:在处理大量数据时,滑动条可能会出现响应延迟。
解决方案:
1. 使用 blitting 技术(如前面示例所示)
2. 减少数据点数量或使用数据抽样
3. 使用异步更新
以下是一个使用异步更新的例子:
import numpy as np
import matplotlib.pyplot as plt
from matplotlib.widgets import Slider
from threading import Thread
from queue import Queue

fig, ax = plt.subplots()
plt.subplots_adjust(bottom=0.25)

t = np.arange(0.0, 1.0, 0.001)
a0 = 5
f0 = 3
s = a0 * np.sin(2 * np.pi * f0 * t)

l, = plt.plot(t, s, lw=2)
ax.set_xlabel('Time (s)')
ax.set_ylabel('Amplitude')
ax.set_title('how2matplotlib.com: Asynchronous Update')

ax_freq = plt.axes([0.25, 0.1, 0.65, 0.03])
slider_freq = Slider(ax_freq, 'Frequency', 0.1, 30.0, valinit=f0)

update_queue = Queue()

def update_plot():
    while True:
        freq = update_queue.get()
        if freq is None:
            break
        new_y = a0 * np.sin(2 * np.pi * freq * t)
        l.set_ydata(new_y)
        fig.canvas.draw_idle()

update_thread = Thread(target=update_plot)
update_thread.start()

def update(val):
    update_queue.put(slider_freq.val)

slider_freq.on_changed(update)

plt.show()

update_queue.put(None)  # 停止更新线程
update_thread.join()
Output:
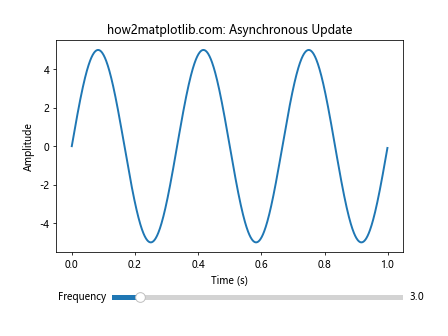
这个例子使用了一个单独的线程来处理图形更新,从而避免了主线程的阻塞。
8.2 滑动条范围不适合
问题:有时滑动条的默认范围可能不适合数据或用户需求。
解决方案:动态调整滑动条范围
import numpy as np
import matplotlib.pyplot as plt
from matplotlib.widgets import Slider, Button

fig, ax = plt.subplots()
plt.subplots_adjust(bottom=0.25)

t = np.arange(0.0, 1.0, 0.001)
a0 = 5
f0 = 3
s = a0 * np.sin(2 * np.pi * f0 * t)

l, = plt.plot(t, s, lw=2)
ax.set_xlabel('Time (s)')
ax.set_ylabel('Amplitude')
ax.set_title('how2matplotlib.com: Dynamic Slider Range')

ax_freq = plt.axes([0.25, 0.1, 0.65, 0.03])
slider_freq = Slider(ax_freq, 'Frequency', 0.1, 30.0, valinit=f0)

ax_button = plt.axes([0.8, 0.025, 0.1, 0.04])
button = Button(ax_button, 'Adjust Range')

def update(val):
    freq = slider_freq.val
    l.set_ydata(a0 * np.sin(2 * np.pi * freq * t))
    fig.canvas.draw_idle()

def adjust_range(event):
    current_val = slider_freq.val
    new_min = max(0.1, current_val - 10)
    new_max = current_val + 10
    slider_freq.valmin = new_min
    slider_freq.valmax = new_max
    slider_freq.ax.set_xlim(new_min, new_max)
    fig.canvas.draw_idle()

slider_freq.on_changed(update)
button.on_clicked(adjust_range)

plt.show()
Output:
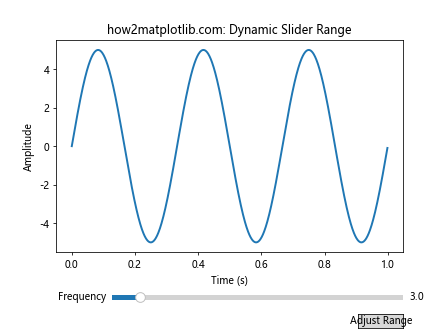
这个例子添加了一个按钮,允许用户根据当前值动态调整滑动条的范围。
8.3 多个滑动条之间的交互
问题:当使用多个相关的滑动条时,可能需要它们之间进行交互。
解决方案:在更新函数中处理滑动条之间的关系
import numpy as np
import matplotlib.pyplot as plt
from matplotlib.widgets import Slider

fig, ax = plt.subplots()
plt.subplots_adjust(bottom=0.35)

t = np.arange(0.0, 1.0, 0.001)
a0, f0, p0 = 5, 3, 0
s = a0 * np.sin(2 * np.pi * f0 * t + p0)

l, = plt.plot(t, s, lw=2)
ax.set_xlabel('Time (s)')
ax.set_ylabel('Amplitude')
ax.set_title('how2matplotlib.com: Interacting Sliders')

ax_amp = plt.axes([0.25, 0.15, 0.65, 0.03])
ax_freq = plt.axes([0.25, 0.1, 0.65, 0.03])
ax_phase = plt.axes([0.25, 0.05, 0.65, 0.03])

slider_amp = Slider(ax_amp, 'Amplitude', 0.1, 10.0, valinit=a0)
slider_freq = Slider(ax_freq, 'Frequency', 0.1, 30.0, valinit=f0)
slider_phase = Slider(ax_phase, 'Phase', 0, 2*np.pi, valinit=p0)

def update(val):
    amp = slider_amp.val
    freq = slider_freq.val
    phase = slider_phase.val
    l.set_ydata(amp * np.sin(2 * np.pi * freq * t + phase))

    # 调整y轴范围
    ax.set_ylim(-amp*1.1, amp*1.1)

    fig.canvas.draw_idle()

slider_amp.on_changed(update)
slider_freq.on_changed(update)
slider_phase.on_changed(update)

plt.show()
Output:
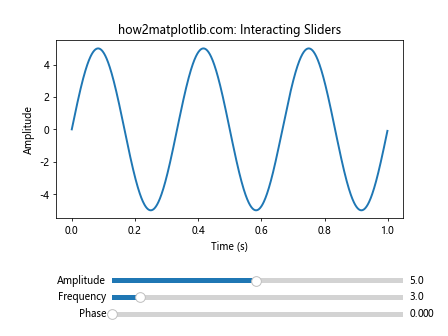
在这个例子中,振幅滑动条的变化会影响y轴的范围,从而保持图形始终可见。
9. Slider Widget 在科学可视化中的应用
Slider Widget 在科学可视化中有广泛的应用。以下是一些具体的例子:
9.1 物理模拟
以下是一个使用 Slider Widget 来模拟简谐运动的例子:
import numpy as np
import matplotlib.pyplot as plt
from matplotlib.widgets import Slider
from matplotlib.animation import FuncAnimation

fig, ax = plt.subplots()
plt.subplots_adjust(bottom=0.3)

t = np.linspace(0, 10, 1000)
A, k, m = 1, 1, 1
x = A * np.cos(np.sqrt(k/m) * t)

line, = ax.plot(t, x)
point, = ax.plot([], [], 'ro')

ax.set_xlim(0, 10)
ax.set_ylim(-1.5, 1.5)
ax.set_xlabel('Time')
ax.set_ylabel('Displacement')
ax.set_title('how2matplotlib.com: Simple Harmonic Motion')

ax_A = plt.axes([0.25, 0.15, 0.65, 0.03])
ax_k = plt.axes([0.25, 0.1, 0.65, 0.03])
ax_m = plt.axes([0.25, 0.05, 0.65, 0.03])

slider_A = Slider(ax_A, 'Amplitude', 0.1, 2.0, valinit=A)
slider_k = Slider(ax_k, 'Spring Constant', 0.1, 5.0, valinit=k)
slider_m = Slider(ax_m, 'Mass', 0.1, 5.0, valinit=m)

def update(val):
    A = slider_A.val
    k = slider_k.val
    m = slider_m.val
    omega = np.sqrt(k/m)
    x = A * np.cos(omega * t)
    line.set_ydata(x)
    fig.canvas.draw_idle()

slider_A.on_changed(update)
slider_k.on_changed(update)
slider_m.on_changed(update)

def animate(i):
    point.set_data(t[i], x[i])
    return point,

ani = FuncAnimation(fig, animate, frames=len(t), interval=20, blit=True)

plt.show()
Output:
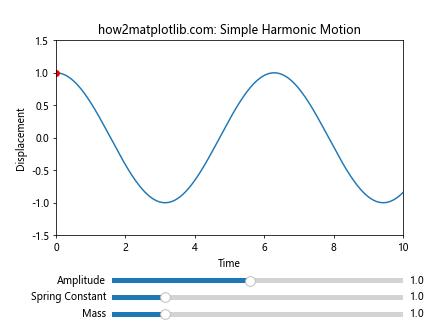
这个例子展示了一个简谐运动的模拟,用户可以通过滑动条调整振幅、弹簧常数和质量。
9.2 数学函数探索
以下是一个使用 Slider Widget 来探索泰勒级数逼近的例子:
import numpy as np
import matplotlib.pyplot as plt
from matplotlib.widgets import Slider

def taylor_sin(x, n):
    result = 0
    for i in range(n):
        result += (-1)**i * x**(2*i+1) / np.math.factorial(2*i+1)
    return result

fig, ax = plt.subplots()
plt.subplots_adjust(bottom=0.25)

x = np.linspace(-np.pi, np.pi, 1000)
y_true = np.sin(x)
n_terms = 1

line_true, = ax.plot(x, y_true, label='True sin(x)')
line_approx, = ax.plot(x, taylor_sin(x, n_terms), label='Taylor approximation')

ax.set_xlim(-np.pi, np.pi)
ax.set_ylim(-1.5, 1.5)
ax.set_xlabel('x')
ax.set_ylabel('y')
ax.set_title('how2matplotlib.com: Taylor Series Approximation of sin(x)')
ax.legend()

ax_slider = plt.axes([0.25, 0.1, 0.65, 0.03])
slider = Slider(ax_slider, 'Number of Terms', 1, 20, valinit=n_terms, valstep=1)

def update(val):
    n = int(slider.val)
    line_approx.set_ydata(taylor_sin(x, n))
    fig.canvas.draw_idle()

slider.on_changed(update)

plt.show()
Output:
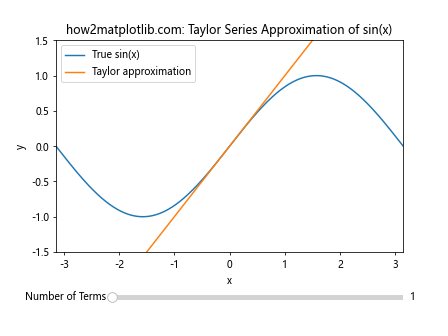
这个例子允许用户通过滑动条来调整泰勒级数的项数,从而观察近似效果的变化。
10. 结论
Matplotlib Slider Widget 是一个强大的工具,可以大大增强数据可视化的交互性和动态性。通过本文的详细介绍和丰富的示例,我们探讨了 Slider Widget 的基本用法、高级应用、性能优化技巧以及在科学可视化中的应用。
Slider Widget 不仅可以用于简单的参数调整,还可以用于复杂的数据探索、物理模拟和数学概念的可视化。通过结合其他 Matplotlib 工具,如 Button、RadioButtons 等,我们可以创建更加复杂和功能丰富的交互式可视化应用。
在实际应用中,我们需要注意性能优化,特别是在处理大量数据时。使用 blitting 技术、异步更新等方法可以显著提高 Slider Widget 的响应速度和流畅度。
总的来说,掌握 Matplotlib Slider Widget 的使用可以让我们的数据可视化作品更加生动、直观和有说服力,为数据分析和科学研究提供强有力的支持。
 极客教程
极客教程