Matplotlib散点图标注技巧:如何优雅地为数据点添加标签
参考:matplotlib scatter label points
Matplotlib是Python中最流行的数据可视化库之一,它提供了强大而灵活的工具来创建各种类型的图表。在数据分析和科学研究中,散点图是一种常用的可视化方式,用于展示两个变量之间的关系。然而,仅仅绘制散点图有时还不够,我们经常需要为特定的数据点添加标签,以便更好地解释数据或突出重要信息。本文将深入探讨如何使用Matplotlib为散点图中的点添加标签,涵盖从基础到高级的各种技巧和方法。
1. 基础散点图绘制
在开始为散点图添加标签之前,我们先回顾一下如何使用Matplotlib绘制基本的散点图。散点图通常用于显示两个数值变量之间的关系,每个点代表一个观察值。
以下是一个简单的散点图示例:
import matplotlib.pyplot as plt
import numpy as np

# 生成示例数据
np.random.seed(42)
x = np.random.rand(20)
y = np.random.rand(20)

# 创建散点图
plt.figure(figsize=(10, 6))
plt.scatter(x, y)
plt.title('Basic Scatter Plot - how2matplotlib.com')
plt.xlabel('X-axis')
plt.ylabel('Y-axis')
plt.show()
Output:
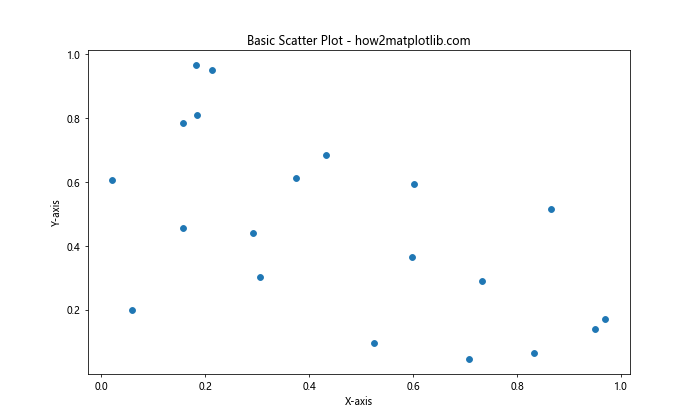
在这个例子中,我们首先导入必要的库,然后生成随机数据。plt.scatter()函数用于创建散点图,plt.title()、plt.xlabel()和plt.ylabel()分别用于添加标题和轴标签。
2. 为所有点添加标签
有时,我们可能需要为散点图中的每个点都添加标签。这在数据点数量较少且每个点都很重要时特别有用。
下面是一个为所有点添加标签的例子:
import matplotlib.pyplot as plt
import numpy as np

# 生成示例数据
np.random.seed(42)
x = np.random.rand(10)
y = np.random.rand(10)
labels = [f'Point {i+1}' for i in range(10)]

# 创建散点图并添加标签
plt.figure(figsize=(10, 6))
plt.scatter(x, y)

for i, label in enumerate(labels):
    plt.annotate(label, (x[i], y[i]), xytext=(5, 5), textcoords='offset points')

plt.title('Scatter Plot with Labels for All Points - how2matplotlib.com')
plt.xlabel('X-axis')
plt.ylabel('Y-axis')
plt.show()
Output:
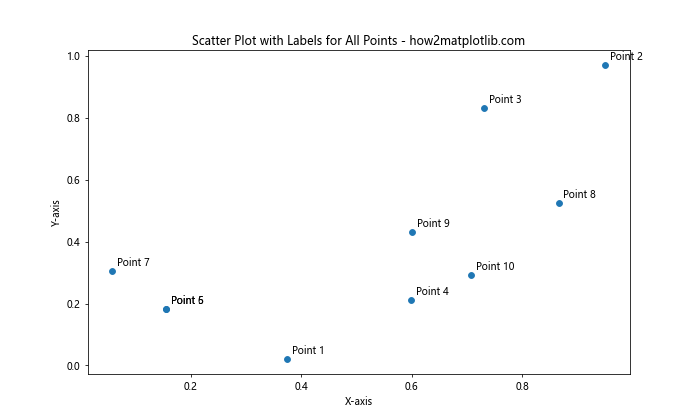
在这个例子中,我们使用plt.annotate()函数为每个点添加标签。xytext参数指定标签相对于点的偏移量,textcoords='offset points'表示偏移量以点为单位。
3. 选择性地为点添加标签
在实际应用中,我们可能只想为特定的点添加标签,比如那些异常值或特别重要的点。
以下是一个选择性添加标签的例子:
import matplotlib.pyplot as plt
import numpy as np

# 生成示例数据
np.random.seed(42)
x = np.random.rand(20)
y = np.random.rand(20)

# 创建散点图
plt.figure(figsize=(10, 6))
plt.scatter(x, y)

# 选择性地添加标签
important_points = [(0.3745401188473625, 0.9507143064099162),
                    (0.7319939418114051, 0.5986584841970366)]

for i, (xi, yi) in enumerate(important_points):
    plt.annotate(f'Important Point {i+1}', (xi, yi),
                 xytext=(10, 10), textcoords='offset points',
                 arrowprops=dict(arrowstyle='->'))

plt.title('Scatter Plot with Selective Labels - how2matplotlib.com')
plt.xlabel('X-axis')
plt.ylabel('Y-axis')
plt.show()
Output:
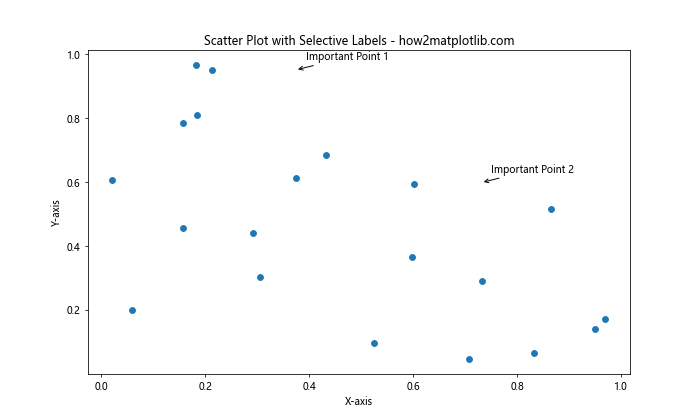
在这个例子中,我们预先定义了一些重要点的坐标,然后只为这些点添加标签。arrowprops参数用于添加从标签指向点的箭头。
4. 使用不同样式的标签
Matplotlib提供了多种方式来自定义标签的外观,包括颜色、字体大小、样式等。
下面是一个使用不同样式标签的例子:
import matplotlib.pyplot as plt
import numpy as np

# 生成示例数据
np.random.seed(42)
x = np.random.rand(15)
y = np.random.rand(15)

# 创建散点图
plt.figure(figsize=(10, 6))
plt.scatter(x, y)

# 添加不同样式的标签
for i in range(5):
    plt.annotate(f'Point {i+1}', (x[i], y[i]),
                 xytext=(5, 5), textcoords='offset points',
                 fontsize=8+i, color=plt.cm.Set1(i/5))

plt.title('Scatter Plot with Styled Labels - how2matplotlib.com')
plt.xlabel('X-axis')
plt.ylabel('Y-axis')
plt.show()
Output:
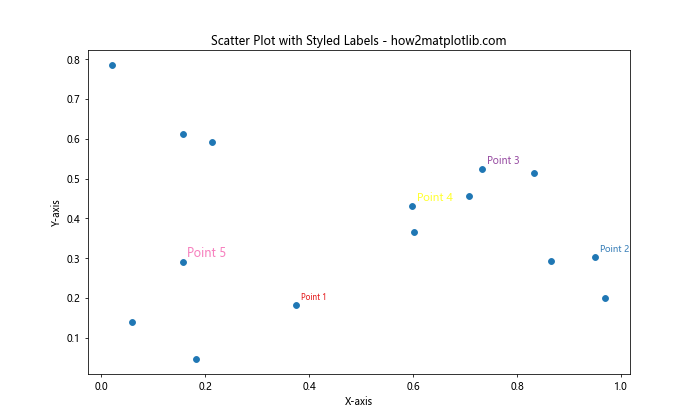
在这个例子中,我们为前5个点添加了标签,每个标签都有不同的字体大小和颜色。plt.cm.Set1(i/5)用于从颜色映射中选择不同的颜色。
5. 避免标签重叠
当数据点密集时,标签可能会相互重叠,影响可读性。Matplotlib没有内置的自动避免重叠的功能,但我们可以使用一些技巧来减少重叠。
以下是一个简单的方法来避免标签重叠:
import matplotlib.pyplot as plt
import numpy as np

# 生成示例数据
np.random.seed(42)
x = np.random.rand(20)
y = np.random.rand(20)

# 创建散点图
plt.figure(figsize=(10, 6))
plt.scatter(x, y)

# 添加标签并尝试避免重叠
used_positions = set()
for i in range(len(x)):
    x_text, y_text = x[i] + 0.02, y[i] + 0.02
    position = (round(x_text, 2), round(y_text, 2))

    while position in used_positions:
        x_text += 0.02
        y_text += 0.02
        position = (round(x_text, 2), round(y_text, 2))

    used_positions.add(position)
    plt.annotate(f'P{i+1}', (x[i], y[i]),
                 xytext=(x_text, y_text), textcoords='data',
                 arrowprops=dict(arrowstyle='->', connectionstyle='arc3,rad=0.3'))

plt.title('Scatter Plot with Non-overlapping Labels - how2matplotlib.com')
plt.xlabel('X-axis')
plt.ylabel('Y-axis')
plt.show()
Output:
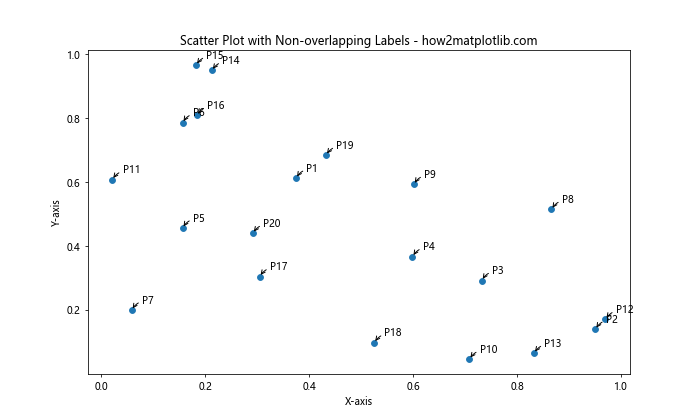
这个例子中,我们使用一个集合来跟踪已使用的标签位置,并在检测到重叠时调整新标签的位置。这种方法并不完美,但可以在一定程度上减少重叠。
6. 使用adjustText库
对于更复杂的标签布局,我们可以使用adjustText库,它专门用于优化文本标签的位置以避免重叠。
首先,需要安装adjustText:
pip install adjustText
然后,我们可以使用以下代码:
import matplotlib.pyplot as plt
import numpy as np
from adjustText import adjust_text

# 生成示例数据
np.random.seed(42)
x = np.random.rand(15)
y = np.random.rand(15)

# 创建散点图
plt.figure(figsize=(10, 6))
plt.scatter(x, y)

# 添加标签
texts = []
for i in range(len(x)):
    texts.append(plt.text(x[i], y[i], f'P{i+1}'))

# 调整标签位置
adjust_text(texts, x, y, arrowprops=dict(arrowstyle='->', color='red'))

plt.title('Scatter Plot with Optimized Labels - how2matplotlib.com')
plt.xlabel('X-axis')
plt.ylabel('Y-axis')
plt.show()
adjustText库会自动调整标签的位置,以最小化重叠并保持标签靠近相应的点。
7. 使用颜色编码的标签
有时,我们可能想要使用颜色来编码额外的信息。例如,我们可以根据某个变量的值来为标签着色。
以下是一个使用颜色编码标签的例子:
import matplotlib.pyplot as plt
import numpy as np

# 生成示例数据
np.random.seed(42)
x = np.random.rand(15)
y = np.random.rand(15)
z = np.random.rand(15)  # 用于颜色编码的额外变量

# 创建散点图
plt.figure(figsize=(10, 6))
scatter = plt.scatter(x, y, c=z, cmap='viridis')

# 添加颜色编码的标签
for i in range(len(x)):
    plt.annotate(f'P{i+1}', (x[i], y[i]),
                 xytext=(5, 5), textcoords='offset points',
                 color=plt.cm.viridis(z[i]))

plt.colorbar(scatter, label='Z value')
plt.title('Scatter Plot with Color-coded Labels - how2matplotlib.com')
plt.xlabel('X-axis')
plt.ylabel('Y-axis')
plt.show()
Output:
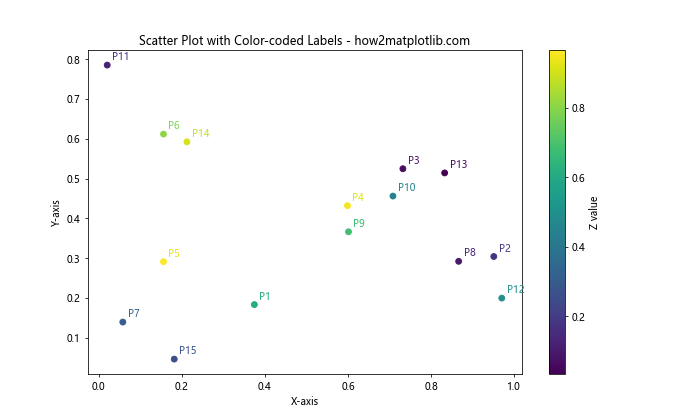
在这个例子中,我们使用z变量来决定点和标签的颜色。plt.cm.viridis(z[i])用于从viridis颜色映射中选择与z[i]值对应的颜色。
8. 使用不同形状的标记
除了颜色,我们还可以使用不同的形状来区分不同类别的点。这在需要表示多个类别时特别有用。
以下是一个使用不同形状标记的例子:
import matplotlib.pyplot as plt
import numpy as np

# 生成示例数据
np.random.seed(42)
x = np.random.rand(20)
y = np.random.rand(20)
categories = np.random.choice(['A', 'B', 'C'], 20)

# 定义形状映射
shape_map = {'A': 'o', 'B': 's', 'C': '^'}

# 创建散点图
plt.figure(figsize=(10, 6))
for category in ['A', 'B', 'C']:
    mask = categories == category
    plt.scatter(x[mask], y[mask], marker=shape_map[category], label=category)

# 添加标签
for i in range(len(x)):
    plt.annotate(f'{categories[i]}{i+1}', (x[i], y[i]),
                 xytext=(5, 5), textcoords='offset points')

plt.legend()
plt.title('Scatter Plot with Different Markers - how2matplotlib.com')
plt.xlabel('X-axis')
plt.ylabel('Y-axis')
plt.show()
Output:
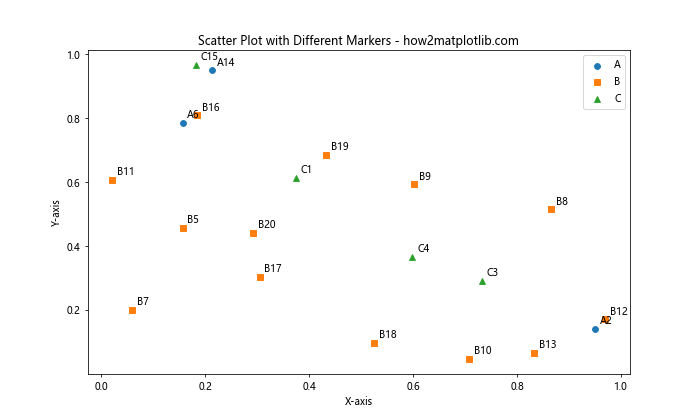
在这个例子中,我们为每个类别定义了不同的标记形状,并在散点图和标签中使用这些形状来区分不同的类别。
9. 使用箭头和文本框
有时,我们可能想要为标签添加更多的视觉效果,比如箭头和文本框。Matplotlib提供了丰富的选项来自定义这些元素。
以下是一个使用箭头和文本框的例子:
import matplotlib.pyplot as plt
import numpy as np

# 生成示例数据
np.random.seed(42)
x = np.random.rand(10)
y = np.random.rand(10)

# 创建散点图
plt.figure(figsize=(10, 6))
plt.scatter(x, y)

# 添加带箭头和文本框的标签
for i in range(5):
    plt.annotate(f'Point {i+1}', (x[i], y[i]),
                 xytext=(20, 20), textcoords='offset points',
                 bbox=dict(boxstyle='round,pad=0.5', fc='yellow', alpha=0.5),
                 arrowprops=dict(arrowstyle='->', connectionstyle='arc3,rad=0'))

plt.title('Scatter Plot with Arrows and Text Boxes - how2matplotlib.com')
plt.xlabel('X-axis')
plt.ylabel('Y-axis')
plt.show()
Output:
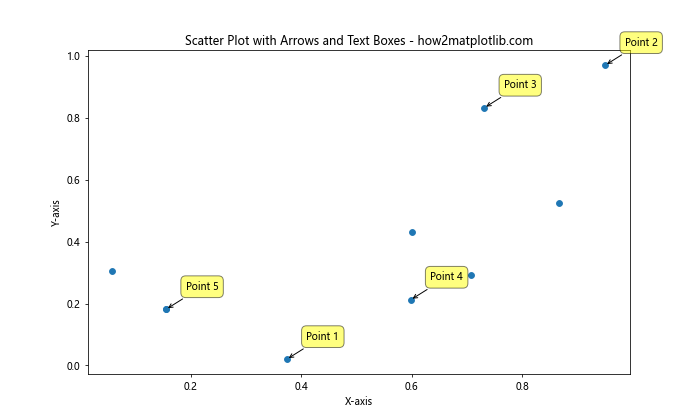
在这个例子中,我们使用bbox参数为标签添加了一个圆角矩形的背景,arrowprops参数用于自定义指向点的箭头。
10. 交互式标签
对于大量数据点,静态标签可能会使图表变得杂乱。在这种情况下,交互式标签可能是一个更好的选择。我们可以使用Matplotlib的事件处理功能来实现这一点。
以下是一个简单的交互式标签示例:
import matplotlib.pyplot as plt
import numpy as np

# 生成示例数据
np.random.seed(42)
x = np.random.rand(100)
y = np.random.rand(100)

# 创建散点图
fig, ax = plt.subplots(figsize=(10, 6))
scatter = ax.scatter(x, y)

# 创建一个注释对象,但一开始不显示
annot = ax.annotate("", xy=(0,0), xytext=(20,20),textcoords="offset points",
                    bbox=dict(boxstyle="round", fc="w"),
                    arrowprops=dict(arrowstyle="->"))
annot.set_visible(False)

def update_annot(ind):
    pos = scatter.get_offsets()[ind["ind"][0]]
    annot.xy = pos
    text = f"Point {ind['ind'][0]}"
    annot.set_text(text)
    annot.get_bbox_patch().set_alpha(0.4)

def hover(event):
    vis = annot.get_visible()
    if event.inaxes == ax:
        cont, ind = scatter.contains(event)
        if cont:
            update_annot(ind)
            annot.set_visible(True)
            fig.canvas.draw_idle()
        else:
            if vis:
                annot.set_visible(False)
                fig.canvas.draw_idle()

fig.canvas.mpl_connect("motion_notify_event", hover)

plt.title('Interactive Scatter Plot Labels - how2matplotlib.com')
plt.xlabel('X-axis')
plt.ylabel('Y-axis')
plt.show()
Output:
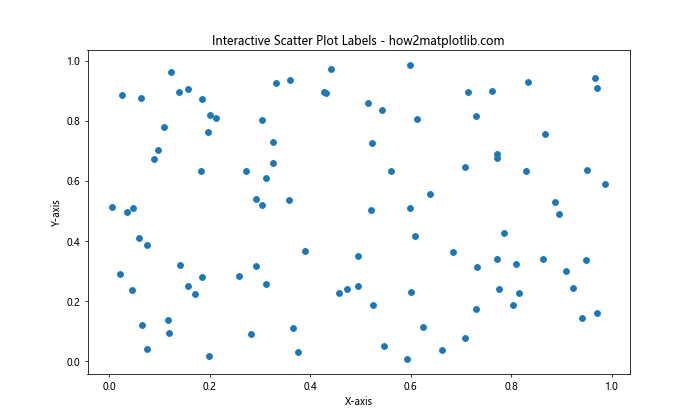
在这个例子中,我们创建了一个交互式散点图,当鼠标悬停在点上时会显示该点的标签。这种方法可以处理大量数据点而不会使图表变得杂乱。
11. 使用自定义函数进行标签定位
有时,我们可能需要更精细地控制标签的位置。我们可以创建一个自定义函数来计算每个标签的最佳位置。
以下是一个使用自定义函数进行标签定位的例子:
import matplotlib.pyplot as plt
import numpy as np

def label_position(x, y, ax, offset=0.1):
    """计算标签的位置"""
    xmin, xmax = ax.get_xlim()
    ymin, ymax = ax.get_ylim()

    if x < (xmin + xmax) / 2:
        xtext = x + offset * (xmax - xmin)
    else:
        xtext = x - offset * (xmax - xmin)

    if y < (ymin + ymax) / 2:
        ytext = y + offset * (ymax - ymin)
    else:
        ytext = y - offset * (ymax - ymin)

    return xtext, ytext

# 生成示例数据
np.random.seed(42)
x = np.random.rand(15)
y = np.random.rand(15)

# 创建散点图
fig, ax = plt.subplots(figsize=(10, 6))
ax.scatter(x, y)

# 添加标签
for i in range(len(x)):
    xtext, ytext = label_position(x[i], y[i], ax)
    ax.annotate(f'P{i+1}', (x[i], y[i]),
                xytext=(xtext, ytext), textcoords='data',
                arrowprops=dict(arrowstyle='->', connectionstyle='arc3,rad=0.3'))

plt.title('Scatter Plot with Custom Label Positioning - how2matplotlib.com')
plt.xlabel('X-axis')
plt.ylabel('Y-axis')
plt.show()
Output:
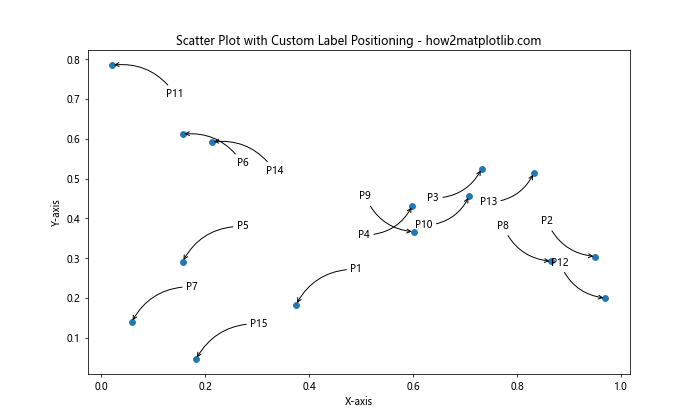
在这个例子中,label_position函数根据点的位置计算标签的最佳位置。这个函数尝试将标签放在点的对角线方向,以减少重叠的可能性。
12. 使用极坐标系
虽然大多数散点图使用笛卡尔坐标系,但有时使用极坐标系可能更合适,特别是当数据具有周期性或角度特性时。
以下是一个在极坐标系中添加标签的例子:
import matplotlib.pyplot as plt
import numpy as np

# 生成示例数据
np.random.seed(42)
theta = np.random.uniform(0, 2*np.pi, 10)
r = np.random.uniform(0, 1, 10)

# 创建极坐标散点图
fig, ax = plt.subplots(figsize=(10, 10), subplot_kw=dict(projection='polar'))
ax.scatter(theta, r)

# 添加标签
for i in range(len(theta)):
    ax.annotate(f'P{i+1}', (theta[i], r[i]),
                xytext=(0.1, 0.1), textcoords='axes fraction',
                arrowprops=dict(arrowstyle='->', connectionstyle='arc3,rad=0'))

plt.title('Polar Scatter Plot with Labels - how2matplotlib.com')
plt.show()
Output:
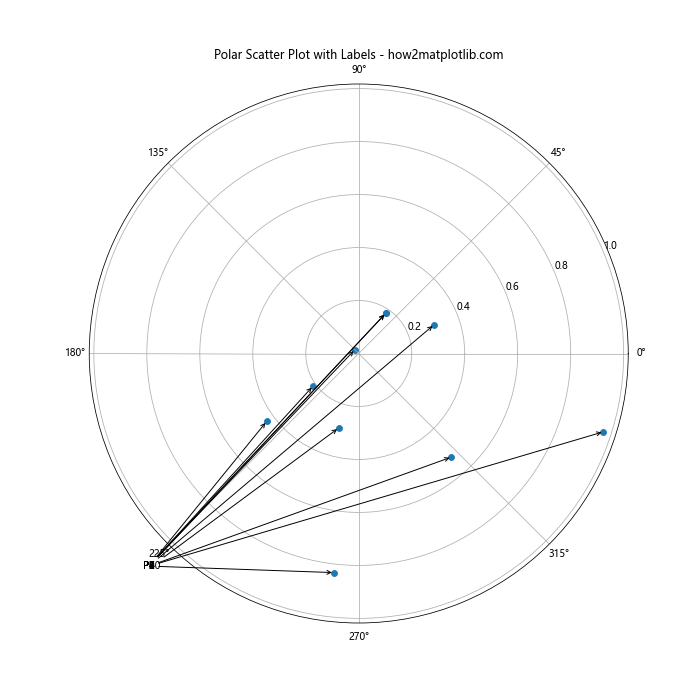
在这个例子中,我们使用极坐标系创建散点图,并为每个点添加标签。注意,在极坐标系中,xytext参数使用的是轴的分数坐标。
13. 使用3D散点图
Matplotlib也支持3D散点图,我们可以在三维空间中为点添加标签。
以下是一个3D散点图的例子:
import matplotlib.pyplot as plt
import numpy as np

# 生成示例数据
np.random.seed(42)
x = np.random.rand(10)
y = np.random.rand(10)
z = np.random.rand(10)

# 创建3D散点图
fig = plt.figure(figsize=(10, 8))
ax = fig.add_subplot(111, projection='3d')
ax.scatter(x, y, z)

# 添加标签
for i in range(len(x)):
    ax.text(x[i], y[i], z[i], f'P{i+1}', size=10, zorder=1, color='k')

ax.set_xlabel('X-axis')
ax.set_ylabel('Y-axis')
ax.set_zlabel('Z-axis')
plt.title('3D Scatter Plot with Labels - how2matplotlib.com')
plt.show()
Output:
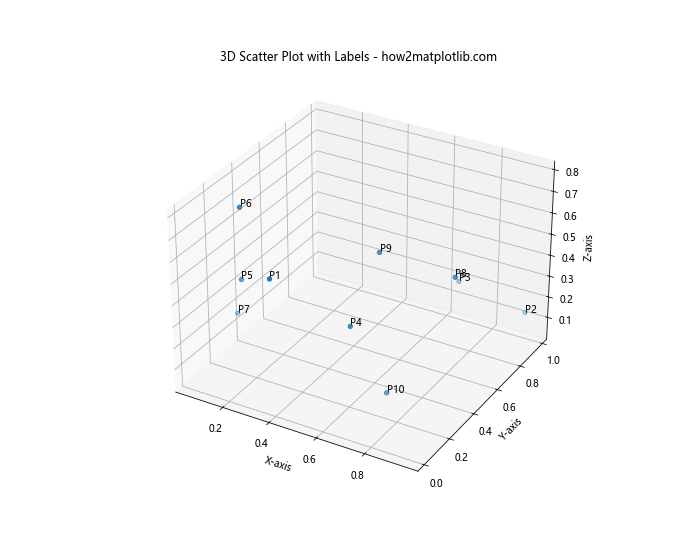
在3D散点图中,我们使用ax.text()函数来添加标签,因为annotate()在3D图中不太容易使用。
14. 使用不同大小的点
我们可以通过改变点的大小来表示额外的信息维度。这种技术通常用于表示数据点的重要性或某个额外变量的大小。
以下是一个使用不同大小点的例子:
import matplotlib.pyplot as plt
import numpy as np

# 生成示例数据
np.random.seed(42)
x = np.random.rand(20)
y = np.random.rand(20)
sizes = np.random.randint(20, 200, 20)

# 创建散点图
plt.figure(figsize=(10, 6))
scatter = plt.scatter(x, y, s=sizes, alpha=0.5)

# 添加标签
for i in range(len(x)):
    plt.annotate(f'P{i+1}', (x[i], y[i]),
                 xytext=(5, 5), textcoords='offset points')

plt.title('Scatter Plot with Different Sized Points - how2matplotlib.com')
plt.xlabel('X-axis')
plt.ylabel('Y-axis')
plt.show()
Output:
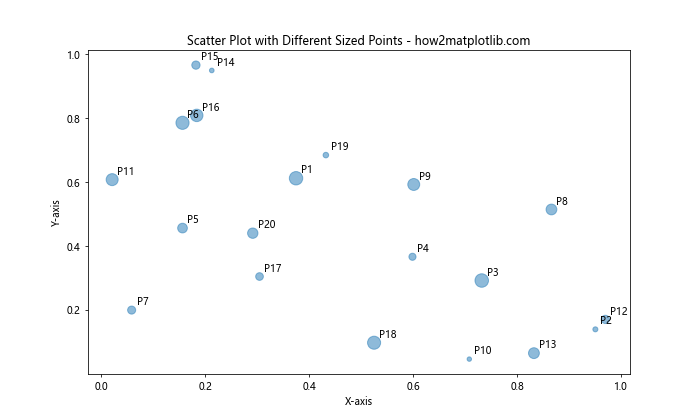
在这个例子中,我们使用s参数来设置点的大小。alpha参数用于设置点的透明度,这在点重叠时特别有用。
15. 使用标签组
当有多个相近的点需要标注时,我们可以考虑使用标签组,即将多个点的标签组合在一起。
以下是一个使用标签组的例子:
import matplotlib.pyplot as plt
import numpy as np

# 生成示例数据
np.random.seed(42)
x = np.random.rand(20)
y = np.random.rand(20)

# 创建散点图
plt.figure(figsize=(10, 6))
plt.scatter(x, y)

# 定义一些组
groups = [
    ([(x[0], y[0]), (x[1], y[1]), (x[2], y[2])], "Group A"),
    ([(x[5], y[5]), (x[6], y[6])], "Group B"),
]

# 添加组标签
for points, label in groups:
    center_x = np.mean([p[0] for p in points])
    center_y = np.mean([p[1] for p in points])
    plt.annotate(label, (center_x, center_y),
                 xytext=(0, 20), textcoords='offset points',
                 bbox=dict(boxstyle='round,pad=0.5', fc='yellow', alpha=0.5),
                 arrowprops=dict(arrowstyle='->', connectionstyle='arc3,rad=0'))

plt.title('Scatter Plot with Label Groups - how2matplotlib.com')
plt.xlabel('X-axis')
plt.ylabel('Y-axis')
plt.show()
Output:
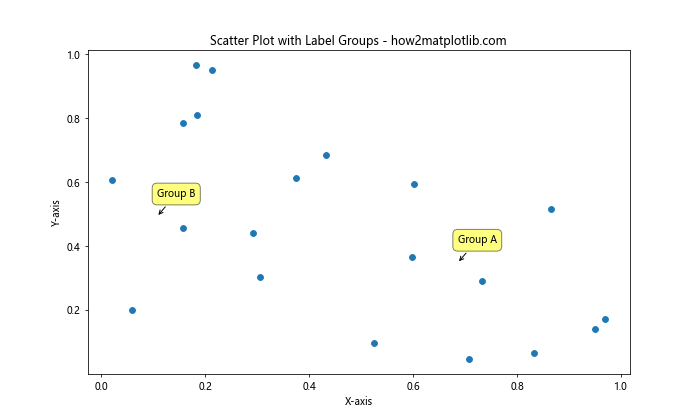
在这个例子中,我们定义了一些点组,并为每个组添加了一个标签。标签被放置在组中所有点的平均位置。
结论
在本文中,我们探讨了在Matplotlib中为散点图添加标签的多种方法和技巧。从基本的标签添加到高级的交互式标签,从避免重叠到使用颜色编码,我们涵盖了广泛的技术。这些技巧可以帮助你创建更加信息丰富、视觉上更具吸引力的散点图。
记住,好的数据可视化不仅仅是展示数据,更是讲述数据背后的故事。通过恰当地使用标签,你可以引导观众关注重要的数据点,揭示数据中的模式和异常,从而更有效地传达你的信息。
在实际应用中,你可能需要结合使用多种技巧来创建最适合你的数据和目标的散点图。不要害怕实验和创新 – Matplotlib提供了丰富的工具和选项,让你能够创建出独特而富有洞察力的数据可视化。
最后,记住可视化是一个迭代的过程。不断尝试不同的方法,根据反馈进行调整,直到你的图表能够清晰、准确地传达你想要表达的信息。通过掌握这些技巧,你将能够创建出既美观又富有信息量的散点图,为你的数据分析和展示增添价值。
 极客教程
极客教程