Matplotlib散点图:如何为每个数据点添加标签
参考:matplotlib scatter label each point
Matplotlib是Python中最流行的数据可视化库之一,它提供了丰富的绘图功能,其中散点图(scatter plot)是一种常用的图表类型。在某些情况下,我们可能需要为散点图中的每个数据点添加标签,以提供更详细的信息或更好地识别特定的数据点。本文将详细介绍如何使用Matplotlib为散点图中的每个点添加标签,并提供多个示例代码来说明不同的实现方法和技巧。
1. 基本的散点图绘制
在开始为散点图添加标签之前,我们先来回顾一下如何使用Matplotlib绘制基本的散点图。以下是一个简单的示例:
import matplotlib.pyplot as plt
import numpy as np

# 生成示例数据
x = np.array([1, 2, 3, 4, 5])
y = np.array([2, 4, 1, 3, 5])

# 创建图形和坐标轴
fig, ax = plt.subplots()

# 绘制散点图
ax.scatter(x, y)

# 设置标题和轴标签
ax.set_title('Basic Scatter Plot - how2matplotlib.com')
ax.set_xlabel('X-axis')
ax.set_ylabel('Y-axis')

# 显示图形
plt.show()
Output:
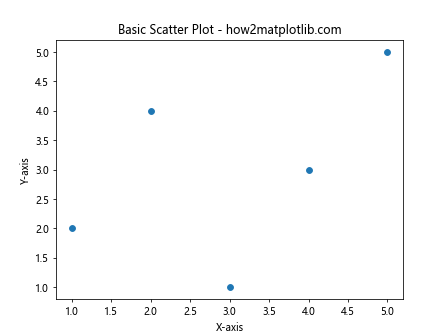
在这个示例中,我们首先导入了必要的库(matplotlib.pyplot和numpy)。然后,我们创建了一些示例数据点,使用plt.subplots()创建了一个图形和坐标轴对象。接下来,我们使用ax.scatter()函数绘制散点图,并设置了标题和轴标签。最后,我们调用plt.show()来显示图形。
2. 使用text()函数为每个点添加标签
现在,让我们开始为散点图中的每个点添加标签。最直接的方法是使用Matplotlib的text()函数。这个函数允许我们在图表的任意位置添加文本。以下是一个示例:
import matplotlib.pyplot as plt
import numpy as np

# 生成示例数据
x = np.array([1, 2, 3, 4, 5])
y = np.array([2, 4, 1, 3, 5])
labels = ['A', 'B', 'C', 'D', 'E']

# 创建图形和坐标轴
fig, ax = plt.subplots()

# 绘制散点图
scatter = ax.scatter(x, y)

# 为每个点添加标签
for i, label in enumerate(labels):
    ax.text(x[i], y[i], label, fontsize=9, ha='right', va='bottom')

# 设置标题和轴标签
ax.set_title('Scatter Plot with Labels - how2matplotlib.com')
ax.set_xlabel('X-axis')
ax.set_ylabel('Y-axis')

# 显示图形
plt.show()
Output:
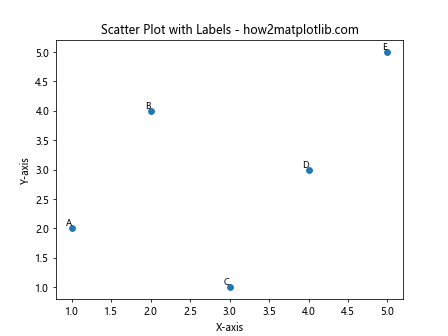
在这个示例中,我们首先定义了一个标签列表labels。然后,我们使用enumerate()函数遍历标签列表,并为每个数据点调用ax.text()函数。text()函数的前两个参数是文本的x和y坐标,第三个参数是要显示的文本内容。我们还设置了字体大小(fontsize)和文本对齐方式(ha和va)。
3. 使用annotate()函数添加带箭头的标签
如果你想为标签添加指向数据点的箭头,可以使用annotate()函数。这个函数提供了更多的自定义选项,可以创建更复杂的标签效果。以下是一个示例:
import matplotlib.pyplot as plt
import numpy as np

# 生成示例数据
x = np.array([1, 2, 3, 4, 5])
y = np.array([2, 4, 1, 3, 5])
labels = ['Point A', 'Point B', 'Point C', 'Point D', 'Point E']

# 创建图形和坐标轴
fig, ax = plt.subplots()

# 绘制散点图
scatter = ax.scatter(x, y)

# 为每个点添加带箭头的标签
for i, label in enumerate(labels):
    ax.annotate(label, (x[i], y[i]), xytext=(5, 5), textcoords='offset points',
                fontsize=8, ha='left', va='bottom',
                bbox=dict(boxstyle='round,pad=0.5', fc='yellow', alpha=0.5),
                arrowprops=dict(arrowstyle='->', connectionstyle='arc3,rad=0'))

# 设置标题和轴标签
ax.set_title('Scatter Plot with Annotated Labels - how2matplotlib.com')
ax.set_xlabel('X-axis')
ax.set_ylabel('Y-axis')

# 显示图形
plt.show()
Output:
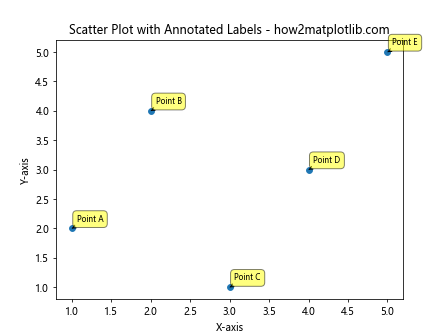
在这个示例中,我们使用ax.annotate()函数为每个数据点添加标签。annotate()函数的第一个参数是标签文本,第二个参数是数据点的坐标。我们还使用了以下参数:
xytext: 标签文本相对于数据点的偏移量textcoords: 指定xytext的坐标系统fontsize: 字体大小ha和va: 水平和垂直对齐方式bbox: 为标签文本添加背景框arrowprops: 定义指向数据点的箭头样式
这种方法可以创建更醒目和信息丰富的标签。
4. 使用for循环和列表推导式添加标签
如果你有大量的数据点需要标记,使用for循环可能会导致代码变得冗长。在这种情况下,我们可以使用列表推导式来简化代码。以下是一个示例:
import matplotlib.pyplot as plt
import numpy as np

# 生成示例数据
np.random.seed(42)
x = np.random.rand(20)
y = np.random.rand(20)
labels = [f'Point {i+1}' for i in range(20)]

# 创建图形和坐标轴
fig, ax = plt.subplots(figsize=(10, 8))

# 绘制散点图
scatter = ax.scatter(x, y)

# 使用列表推导式添加标签
[ax.text(x[i], y[i], label, fontsize=8, ha='right', va='bottom') for i, label in enumerate(labels)]

# 设置标题和轴标签
ax.set_title('Scatter Plot with Many Labels - how2matplotlib.com')
ax.set_xlabel('X-axis')
ax.set_ylabel('Y-axis')

# 显示图形
plt.show()
Output:
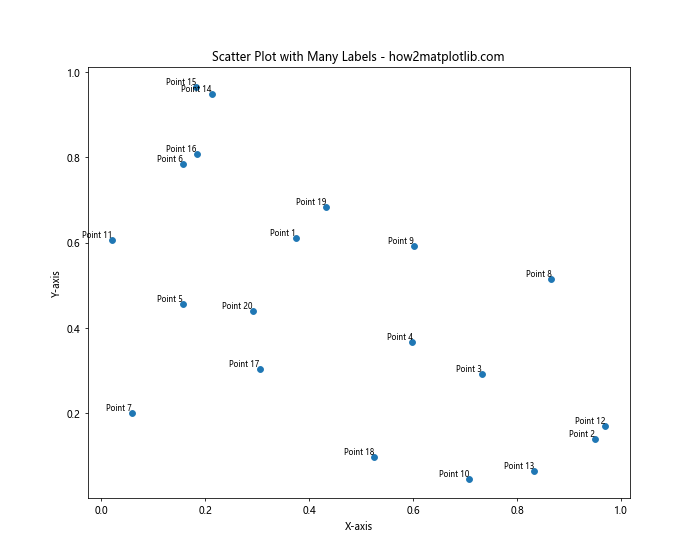
在这个示例中,我们首先生成了20个随机数据点和对应的标签。然后,我们使用列表推导式在一行代码中为所有数据点添加标签。这种方法可以使代码更简洁,特别是在处理大量数据点时。
5. 使用adjust_text库避免标签重叠
当数据点密集或标签较长时,标签可能会相互重叠,影响可读性。为了解决这个问题,我们可以使用adjustText库。这个库可以自动调整标签位置,以最小化重叠。以下是一个示例:
import matplotlib.pyplot as plt
import numpy as np
from adjustText import adjust_text

# 生成示例数据
np.random.seed(42)
x = np.random.rand(15)
y = np.random.rand(15)
labels = [f'Label {i+1}' for i in range(15)]

# 创建图形和坐标轴
fig, ax = plt.subplots(figsize=(10, 8))

# 绘制散点图
scatter = ax.scatter(x, y)

# 创建文本对象列表
texts = [ax.text(x[i], y[i], label, fontsize=9) for i, label in enumerate(labels)]

# 使用adjust_text调整标签位置
adjust_text(texts, x=x, y=y, arrowprops=dict(arrowstyle='->', color='red'))

# 设置标题和轴标签
ax.set_title('Scatter Plot with Adjusted Labels - how2matplotlib.com')
ax.set_xlabel('X-axis')
ax.set_ylabel('Y-axis')

# 显示图形
plt.show()
在这个示例中,我们首先创建了文本对象的列表。然后,我们使用adjust_text()函数来调整这些文本对象的位置。adjust_text()函数会尝试移动标签,以减少重叠,同时保持标签靠近其对应的数据点。
6. 根据数据值设置标签颜色
有时,我们可能想根据数据点的值来设置标签的颜色,以便更直观地表示数据的特征。以下是一个示例,展示如何根据y值的大小来设置标签颜色:
import matplotlib.pyplot as plt
import numpy as np

# 生成示例数据
x = np.array([1, 2, 3, 4, 5])
y = np.array([2, 4, 1, 3, 5])
labels = ['A', 'B', 'C', 'D', 'E']

# 创建图形和坐标轴
fig, ax = plt.subplots()

# 绘制散点图
scatter = ax.scatter(x, y, c=y, cmap='viridis')

# 为每个点添加带颜色的标签
for i, label in enumerate(labels):
    color = plt.cm.viridis(y[i] / max(y))  # 根据y值计算颜色
    ax.text(x[i], y[i], label, fontsize=12, ha='right', va='bottom', color=color)

# 添加颜色条
plt.colorbar(scatter)

# 设置标题和轴标签
ax.set_title('Scatter Plot with Colored Labels - how2matplotlib.com')
ax.set_xlabel('X-axis')
ax.set_ylabel('Y-axis')

# 显示图形
plt.show()
Output:
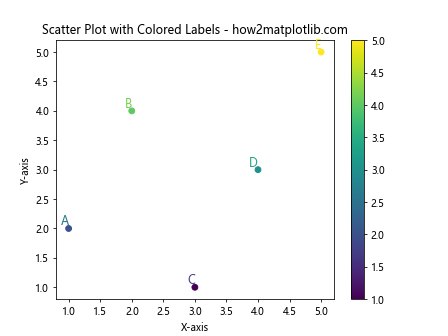
在这个示例中,我们首先使用scatter()函数绘制散点图,并设置c=y和cmap='viridis'来根据y值着色数据点。然后,在添加标签时,我们使用plt.cm.viridis()函数根据y值计算每个标签的颜色。这样,标签的颜色就会与数据点的颜色相匹配,提供了额外的视觉信息。
7. 使用自定义格式化字符串作为标签
在某些情况下,我们可能想要使用更复杂的标签格式,例如包含多个数据值或自定义文本。以下是一个示例,展示如何使用格式化字符串创建自定义标签:
import matplotlib.pyplot as plt
import numpy as np

# 生成示例数据
np.random.seed(42)
x = np.random.rand(10)
y = np.random.rand(10)
z = np.random.randint(100, 1000, 10)

# 创建图形和坐标轴
fig, ax = plt.subplots(figsize=(10, 8))

# 绘制散点图
scatter = ax.scatter(x, y, s=z, alpha=0.6)

# 为每个点添加自定义格式的标签
for i, (xi, yi, zi) in enumerate(zip(x, y, z)):
    label = f'P{i+1}: ({xi:.2f}, {yi:.2f})\nValue: {zi}'
    ax.annotate(label, (xi, yi), xytext=(5, 5), textcoords='offset points',
                fontsize=8, ha='left', va='bottom',
                bbox=dict(boxstyle='round,pad=0.5', fc='white', ec='gray', alpha=0.8))

# 设置标题和轴标签
ax.set_title('Scatter Plot with Custom Formatted Labels - how2matplotlib.com')
ax.set_xlabel('X-axis')
ax.set_ylabel('Y-axis')

# 显示图形
plt.show()
Output:
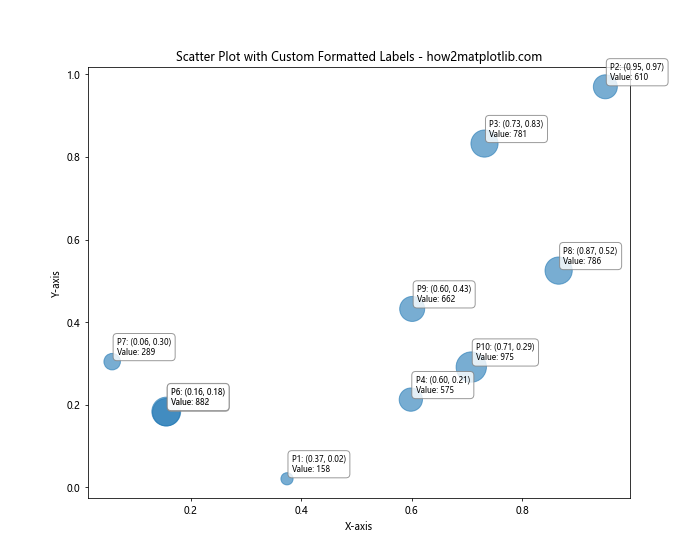
在这个示例中,我们使用了三个数据数组:x、y和z。我们使用z值来设置散点的大小。在添加标签时,我们创建了一个自定义的格式化字符串,包含点的编号、x和y坐标(保留两位小数),以及z值。这种方法允许我们在标签中包含更多信息,使图表更加信息丰富。
8. 使用鼠标悬停显示标签
有时,直接在图表上显示所有标签可能会导致视觉混乱,特别是当数据点很多时。一个解决方案是使用交互式标签,只在鼠标悬停在数据点上时显示标签。以下是一个使用mpld3库实现这一功能的示例:
import matplotlib.pyplot as plt
import numpy as np
import mpld3

# 生成示例数据
np.random.seed(42)
x = np.random.rand(50)
y = np.random.rand(50)
labels = [f'Point {i+1}' for i in range(50)]

# 创建图形和坐标轴
fig, ax = plt.subplots(figsize=(10, 8))

# 绘制散点图
scatter = ax.scatter(x, y)

# 创建工具提示
tooltip = mpld3.plugins.PointLabelTooltip(scatter, labels=labels)
mpld3.plugins.connect(fig, tooltip)

# 设置标题和轴标签
ax.set_title('Interactive Scatter Plot - how2matplotlib.com')
ax.set_xlabel('X-axis')
ax.set_ylabel('Y-axis')

# 显示交互式图形
mpld3.show()
在这个示例中,我们使用了mpld3库来创建一个交互式的散点图。我们首先像往常一样创建散点图,然后使用mpld3.plugins.PointLabelTooltip()创建一个工具提示插件。这个插件会在鼠标悬停在数据点上时显示对应的标签。最后,我们使用mpld3.show()来显示交互式图形。
这种方法可以大大减少图表上的视觉混乱,同时仍然允许用户查看每个数据点的详细信息。
9. 使用不同的标记样式区分数据点
除了使用标签,我们还可以通过使用不同的标记样式来区分数据点。这种方法在数据点较多但可以分类的情况下特别有用。以下是一个示例:
import matplotlib.pyplot as plt
import numpy as np

# 生成示例数据
np.random.seed(42)
x = np.random.rand(30)
y = np.random.rand(30)
categories = np.random.choice(['A', 'B', 'C'], 30)

# 创建图形和坐标轴
fig, ax = plt.subplots(figsize=(10, 8))

# 为每个类别定义不同的标记样式
markers = {'A': 'o', 'B': 's', 'C': '^'}
colors = {'A': 'red', 'B': 'blue', 'C': 'green'}

# 绘制散点图,为每个类别使用不同的标记和颜色
for category in ['A', 'B', 'C']:
    mask = categories == category
    ax.scatter(x[mask], y[mask], marker=markers[category], c=colors[category], label=f'Category {category}')

# 为每个点添加标签
for i, (xi, yi, cat) in enumerate(zip(x, y, categories)):
    ax.annotate(f'P{i+1}', (xi, yi), xytext=(5, 5), textcoords='offset points', fontsize=8)

# 添加图例
ax.legend()

# 设置标题和轴标签
ax.set_title('Scatter Plot with Different Markers - how2matplotlib.com')
ax.set_xlabel('X-axis')
ax.set_ylabel('Y-axis')

# 显示图形
plt.show()
Output:
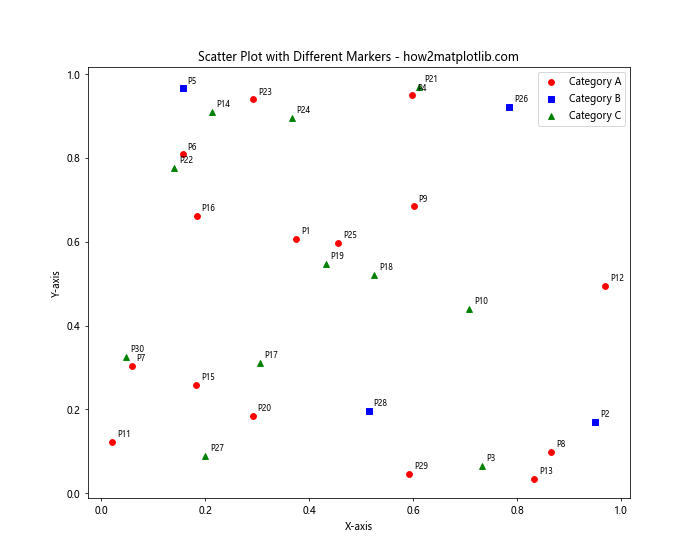
在这个示例中,我们为每个类别定义了不同的标记样式和颜色。然后,我们遍历每个类别,使用相应的标记和颜色绘制该类别的数据点。我们还为每个点添加了一个简单的标签(P1, P2, …)。最后,我们添加了一个图例来解释不同的标记样式。
这种方法可以在不增加太多视觉复杂性的情况下,提供额外的分类信息。
10. 使用标签箭头指向特定区域
有时,我们可能想要使用标签来强调图表中的特定区域或趋势。以下是一个示例,展示如何使用带箭头的标签来指出散点图中的特定特征:
import matplotlib.pyplot as plt
import numpy as np

# 生成示例数据
np.random.seed(42)
x = np.random.rand(50)
y = np.random.rand(50)

# 创建图形和坐标轴
fig, ax = plt.subplots(figsize=(10, 8))

# 绘制散点图
scatter = ax.scatter(x, y)

# 添加指向特定区域的标签
ax.annotate('High Density Area', xy=(0.2, 0.8), xytext=(0.5, 0.9),
            arrowprops=dict(facecolor='black', shrink=0.05),
            fontsize=12, ha='center')

ax.annotate('Outlier', xy=(0.9, 0.1), xytext=(0.7, 0.2),
            arrowprops=dict(facecolor='red', shrink=0.05),
            fontsize=12, ha='center', color='red')

ax.annotate('Trend Line', xy=(0.1, 0.1), xytext=(0.3, 0.3),
            arrowprops=dict(facecolor='green', shrink=0.05),
            fontsize=12, ha='center', color='green')

# 设置标题和轴标签
ax.set_title('Scatter Plot with Annotated Regions - how2matplotlib.com')
ax.set_xlabel('X-axis')
ax.set_ylabel('Y-axis')

# 显示图形
plt.show()
Output:
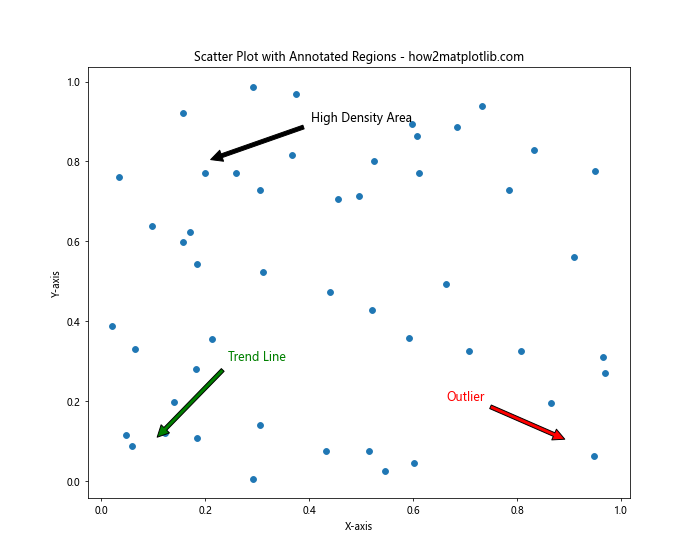
在这个示例中,我们使用ax.annotate()函数添加了三个带箭头的标签,分别指向高密度区域、异常值和趋势线。每个标签都有不同的颜色和位置,以突出显示不同的特征。
这种方法可以帮助读者快速识别图表中的重要特征或趋势,而不需要为每个单独的数据点添加标签。
11. 使用颜色编码和大小编码结合标签
我们可以结合使用颜色编码、大小编码和标签来传达更多信息。以下是一个复杂的示例,展示如何在一个散点图中同时使用这些技术:
import matplotlib.pyplot as plt
import numpy as np

# 生成示例数据
np.random.seed(42)
x = np.random.rand(20)
y = np.random.rand(20)
sizes = np.random.randint(100, 1000, 20)
colors = np.random.rand(20)
labels = [f'P{i+1}' for i in range(20)]

# 创建图形和坐标轴
fig, ax = plt.subplots(figsize=(12, 10))

# 绘制散点图
scatter = ax.scatter(x, y, s=sizes, c=colors, cmap='viridis', alpha=0.6)

# 为每个点添加标签
for i, (xi, yi, label) in enumerate(zip(x, y, labels)):
    ax.annotate(label, (xi, yi), xytext=(5, 5), textcoords='offset points',
                fontsize=8, ha='left', va='bottom',
                bbox=dict(boxstyle='round,pad=0.5', fc='white', ec='gray', alpha=0.8))

# 添加颜色条
cbar = plt.colorbar(scatter)
cbar.set_label('Color Value')

# 添加图例解释大小
size_legend = ax.scatter([], [], s=100, c='gray', label='Size = 100')
ax.scatter([], [], s=500, c='gray', label='Size = 500')
ax.scatter([], [], s=1000, c='gray', label='Size = 1000')
ax.legend(title='Size Legend', loc='upper left')

# 设置标题和轴标签
ax.set_title('Complex Scatter Plot with Multiple Encodings - how2matplotlib.com')
ax.set_xlabel('X-axis')
ax.set_ylabel('Y-axis')

# 显示图形
plt.tight_layout()
plt.show()
Output:
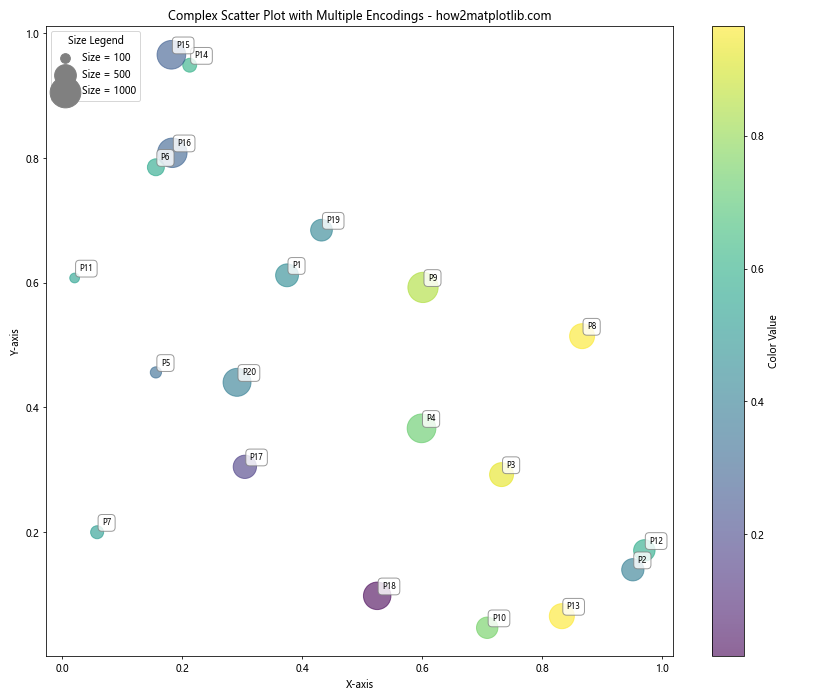
在这个示例中,我们使用了以下技术:
- 散点的位置表示x和y值
- 散点的大小表示一个额外的数值维度(sizes)
- 散点的颜色表示另一个数值维度(colors)
- 每个散点都有一个文本标签
我们还添加了一个颜色条来解释颜色编码,以及一个自定义图例来解释大小编码。这种复杂的可视化可以在一个图表中传达多个维度的信息。
12. 使用标签突出显示重要数据点
有时,我们可能只想为特定的重要数据点添加标签,而不是为所有点添加标签。以下是一个示例,展示如何根据某些条件选择性地添加标签:
import matplotlib.pyplot as plt
import numpy as np

# 生成示例数据
np.random.seed(42)
x = np.random.rand(50)
y = np.random.rand(50)
values = np.random.randint(0, 100, 50)

# 创建图形和坐标轴
fig, ax = plt.subplots(figsize=(10, 8))

# 绘制散点图
scatter = ax.scatter(x, y, c=values, cmap='viridis')

# 为重要的点(值大于80)添加标签
for i, (xi, yi, val) in enumerate(zip(x, y, values)):
    if val > 80:
        ax.annotate(f'P{i}: {val}', (xi, yi), xytext=(5, 5), textcoords='offset points',
                    fontsize=9, ha='left', va='bottom',
                    bbox=dict(boxstyle='round,pad=0.5', fc='yellow', ec='orange', alpha=0.8))

# 添加颜色条
cbar = plt.colorbar(scatter)
cbar.set_label('Value')

# 设置标题和轴标签
ax.set_title('Scatter Plot with Highlighted Important Points - how2matplotlib.com')
ax.set_xlabel('X-axis')
ax.set_ylabel('Y-axis')

# 显示图形
plt.show()
Output:
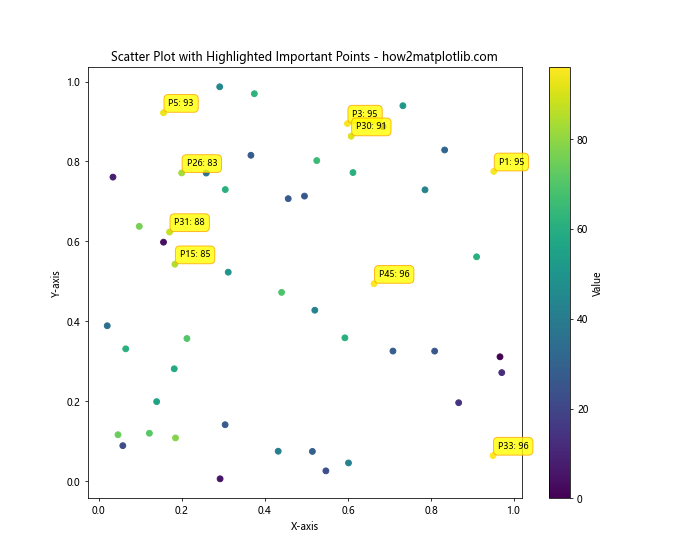
在这个示例中,我们只为值大于80的数据点添加了标签。这些标签包括点的索引和值,并使用黄色背景突出显示。这种方法可以帮助读者快速识别最重要或最有趣的数据点,而不会使图表变得过于拥挤。
13. 使用文本框组合多个标签
当有多个相近的数据点需要标记时,将它们的标签组合在一个文本框中可能会更有效。以下是一个示例:
import matplotlib.pyplot as plt
import numpy as np

# 生成示例数据
np.random.seed(42)
x = np.random.rand(20)
y = np.random.rand(20)
labels = [f'P{i+1}' for i in range(20)]

# 创建图形和坐标轴
fig, ax = plt.subplots(figsize=(10, 8))

# 绘制散点图
scatter = ax.scatter(x, y)

# 定义一个函数来检查两个点是否接近
def is_close(x1, y1, x2, y2, threshold=0.1):
    return np.sqrt((x1-x2)**2 + (y1-y2)**2) < threshold

# 为接近的点创建组合标签
grouped_labels = {}
for i, (xi, yi, label) in enumerate(zip(x, y, labels)):
    found_group = False
    for (gx, gy), group in grouped_labels.items():
        if is_close(xi, yi, gx, gy):
            group.append(label)
            found_group = True
            break
    if not found_group:
        grouped_labels[(xi, yi)] = [label]

# 添加组合标签
for (gx, gy), group in grouped_labels.items():
    label_text = '\n'.join(group)
    ax.annotate(label_text, (gx, gy), xytext=(5, 5), textcoords='offset points',
                fontsize=8, ha='left', va='bottom',
                bbox=dict(boxstyle='round,pad=0.5', fc='white', ec='gray', alpha=0.8))

# 设置标题和轴标签
ax.set_title('Scatter Plot with Grouped Labels - how2matplotlib.com')
ax.set_xlabel('X-axis')
ax.set_ylabel('Y-axis')

# 显示图形
plt.show()
Output:
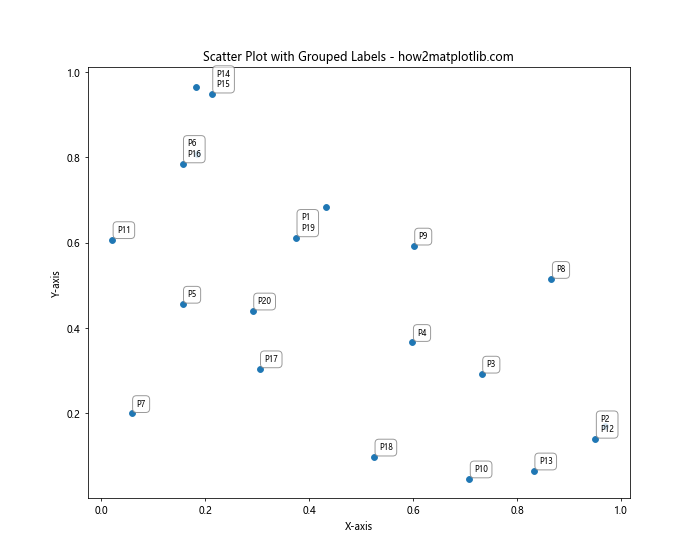
在这个示例中,我们定义了一个is_close()函数来检查两个点是否接近。然后,我们遍历所有点,将接近的点分组。最后,我们为每个组创建一个包含多个标签的文本框。
这种方法可以有效减少图表上的视觉混乱,同时仍然提供所有必要的标签信息。
14. 使用极坐标系中的散点图标签
虽然我们通常在笛卡尔坐标系中绘制散点图,但有时在极坐标系中绘制散点图也很有用。以下是一个在极坐标系中添加标签的示例:
import matplotlib.pyplot as plt
import numpy as np

# 生成示例数据
np.random.seed(42)
theta = np.random.uniform(0, 2*np.pi, 15)
r = np.random.uniform(0, 1, 15)
labels = [f'P{i+1}' for i in range(15)]

# 创建图形和极坐标轴
fig, ax = plt.subplots(figsize=(10, 10), subplot_kw=dict(projection='polar'))

# 绘制散点图
scatter = ax.scatter(theta, r)

# 为每个点添加标签
for i, (t, rad, label) in enumerate(zip(theta, r, labels)):
    ax.annotate(label, (t, rad), xytext=(5, 5), textcoords='offset points',
                fontsize=9, ha='left', va='bottom',
                bbox=dict(boxstyle='round,pad=0.5', fc='white', ec='gray', alpha=0.8))

# 设置标题
ax.set_title('Polar Scatter Plot with Labels - how2matplotlib.com')

# 显示图形
plt.show()
Output:
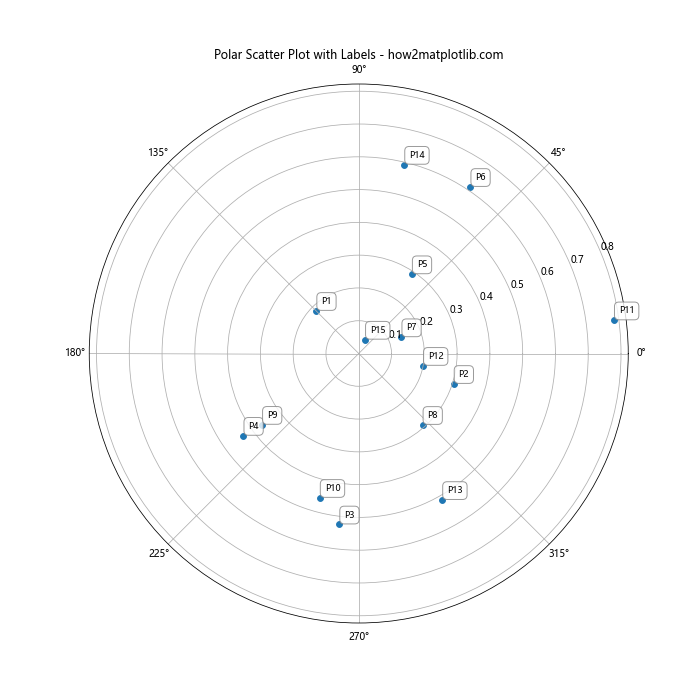
在这个示例中,我们使用subplot_kw=dict(projection='polar')创建了一个极坐标系的子图。然后,我们像在笛卡尔坐标系中一样绘制散点图和添加标签。唯一的区别是,这里的x坐标表示角度(theta),y坐标表示半径(r)。
这种方法可以用于可视化具有周期性或角度相关性的数据。
15. 使用动画展示标签
如果我们有随时间变化的数据,我们可以创建一个动画来展示数据点和标签的变化。以下是一个使用Matplotlib的动画功能来创建动态散点图的示例:
import matplotlib.pyplot as plt
import matplotlib.animation as animation
import numpy as np

# 生成示例数据
np.random.seed(42)
num_points = 10
num_frames = 50

x = np.random.rand(num_points, num_frames)
y = np.random.rand(num_points, num_frames)
labels = [f'P{i+1}' for i in range(num_points)]

# 创建图形和坐标轴
fig, ax = plt.subplots(figsize=(10, 8))

# 初始化散点图和标签
scatter = ax.scatter([], [])
annotations = [ax.annotate('', xy=(0, 0), xytext=(5, 5), textcoords='offset points',
                           fontsize=9, ha='left', va='bottom',
                           bbox=dict(boxstyle='round,pad=0.5', fc='white', ec='gray', alpha=0.8))
               for _ in range(num_points)]

# 更新函数
def update(frame):
    scatter.set_offsets(np.c_[x[:, frame], y[:, frame]])
    for i, (xi, yi, label, ann) in enumerate(zip(x[:, frame], y[:, frame], labels, annotations)):
        ann.set_position((xi, yi))
        ann.set_text(f'{label}: ({xi:.2f}, {yi:.2f})')
    return scatter, *annotations

# 创建动画
anim = animation.FuncAnimation(fig, update, frames=num_frames, interval=200, blit=True)

# 设置标题和轴标签
ax.set_title('Animated Scatter Plot with Labels - how2matplotlib.com')
ax.set_xlabel('X-axis')
ax.set_ylabel('Y-axis')
ax.set_xlim(0, 1)
ax.set_ylim(0, 1)

# 显示动画
plt.show()
Output:
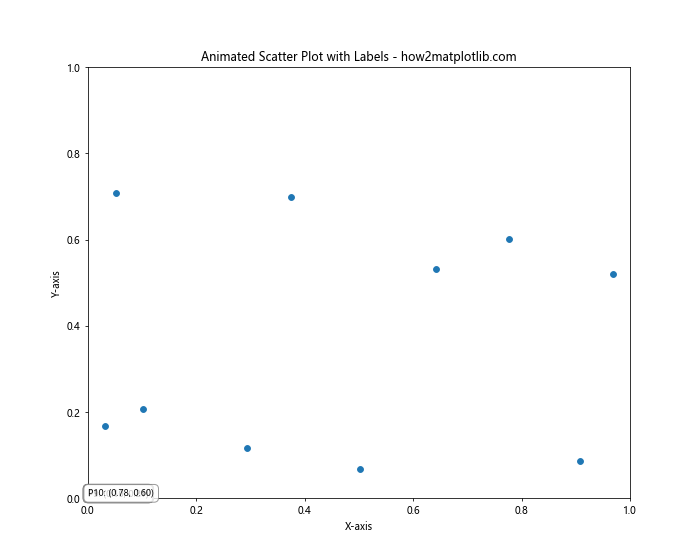
在这个示例中,我们创建了一个随时间变化的散点图。我们使用matplotlib.animation.FuncAnimation来创建动画,update函数在每一帧更新散点的位置和标签的内容。这种方法可以用来展示数据随时间的变化趋势。
16. 使用不同字体和样式的标签
为了使标签更具视觉吸引力或强调某些特定点,我们可以使用不同的字体和样式。以下是一个示例:
import matplotlib.pyplot as plt
import numpy as np
from matplotlib import font_manager

# 生成示例数据
np.random.seed(42)
x = np.random.rand(10)
y = np.random.rand(10)
labels = [f'Point {i+1}' for i in range(10)]

# 创建图形和坐标轴
fig, ax = plt.subplots(figsize=(10, 8))

# 绘制散点图
scatter = ax.scatter(x, y)

# 定义不同的字体和样式
fonts = [
    font_manager.FontProperties(family='serif', weight='bold'),
    font_manager.FontProperties(family='sans-serif', style='italic'),
    font_manager.FontProperties(family='monospace', weight='light'),
    font_manager.FontProperties(family='cursive'),
    font_manager.FontProperties(family='fantasy')
]

# 为每个点添加不同样式的标签
for i, (xi, yi, label) in enumerate(zip(x, y, labels)):
    font = fonts[i % len(fonts)]
    color = plt.cm.viridis(i / len(x))
    ax.annotate(label, (xi, yi), xytext=(5, 5), textcoords='offset points',
                fontproperties=font, color=color, fontsize=10,
                bbox=dict(boxstyle='round,pad=0.5', fc='white', ec=color, alpha=0.8))

# 设置标题和轴标签
ax.set_title('Scatter Plot with Styled Labels - how2matplotlib.com', fontsize=16)
ax.set_xlabel('X-axis', fontsize=12)
ax.set_ylabel('Y-axis', fontsize=12)

# 显示图形
plt.show()
Output:
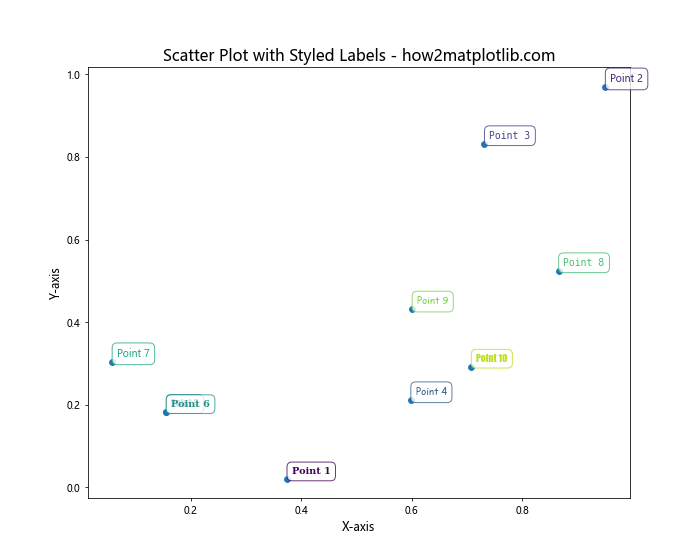
在这个示例中,我们定义了一个字体列表,包含不同的字体系列和样式。然后,我们为每个数据点使用不同的字体和颜色来添加标签。这种方法可以用来强调某些特定的数据点,或者simply为图表添加一些视觉趣味。
17. 使用标签显示额外的统计信息
有时,我们可能想在标签中显示一些额外的统计信息,比如均值、标准差等。以下是一个示例:
import matplotlib.pyplot as plt
import numpy as np

# 生成示例数据
np.random.seed(42)
groups = ['A', 'B', 'C', 'D']
data = {group: np.random.normal(loc=i, scale=0.5, size=20) for i, group in enumerate(groups)}

# 创建图形和坐标轴
fig, ax = plt.subplots(figsize=(12, 8))

# 绘制箱线图
bp = ax.boxplot([data[group] for group in groups], labels=groups)

# 为每个箱线图添加统计信息标签
for i, group in enumerate(groups):
    mean = np.mean(data[group])
    std = np.std(data[group])
    median = np.median(data[group])

    stats_text = f'Mean: {mean:.2f}\nStd: {std:.2f}\nMedian: {median:.2f}'
    ax.annotate(stats_text, xy=(i+1, median), xytext=(10, 0),
                textcoords='offset points', fontsize=8, ha='left', va='center',
                bbox=dict(boxstyle='round,pad=0.5', fc='white', ec='gray', alpha=0.8))

# 设置标题和轴标签
ax.set_title('Box Plot with Statistical Labels - how2matplotlib.com')
ax.set_xlabel('Groups')
ax.set_ylabel('Values')

# 显示图形
plt.show()
Output:
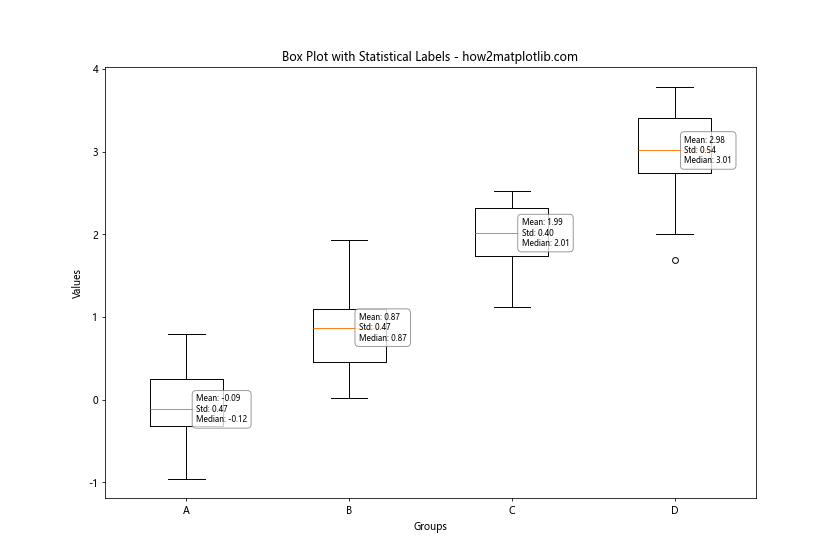
在这个示例中,我们创建了一个箱线图,并为每个组添加了一个包含均值、标准差和中位数的标签。这种方法可以直接在图表上提供重要的统计信息,使读者更容易理解数据的分布特征。
18. 使用标签创建自定义图例
有时,标准的图例可能不足以解释复杂的图表。在这种情况下,我们可以使用标签来创建自定义的图例。以下是一个示例:
import matplotlib.pyplot as plt
import numpy as np

# 生成示例数据
np.random.seed(42)
x = np.random.rand(50)
y = np.random.rand(50)
sizes = np.random.randint(20, 200, 50)
colors = np.random.rand(50)

# 创建图形和坐标轴
fig, ax = plt.subplots(figsize=(12, 9))

# 绘制散点图
scatter = ax.scatter(x, y, s=sizes, c=colors, cmap='viridis', alpha=0.6)

# 创建自定义图例
legend_elements = [
    plt.scatter([], [], s=50, c='gray', label='Small'),
    plt.scatter([], [], s=100, c='gray', label='Medium'),
    plt.scatter([], [], s=200, c='gray', label='Large')
]

# 添加自定义图例
ax.legend(handles=legend_elements, title='Point Sizes', loc='upper left')

# 添加颜色条
cbar = plt.colorbar(scatter)
cbar.set_label('Color Value')

# 添加自定义标签作为额外的图例
ax.text(1.05, 0.5, 'Custom Legend:\n\n'
                   'Color: Represents a value\n'
                   'between 0 and 1\n\n'
                   'Size: Represents importance\n'
                   'or another metric\n\n'
                   'Position: (x, y) coordinates',
        transform=ax.transAxes, fontsize=10, verticalalignment='center',
        bbox=dict(boxstyle='round', facecolor='wheat', alpha=0.5))

# 设置标题和轴标签
ax.set_title('Scatter Plot with Custom Legend - how2matplotlib.com')
ax.set_xlabel('X-axis')
ax.set_ylabel('Y-axis')

# 调整布局
plt.tight_layout()

# 显示图形
plt.show()
Output:
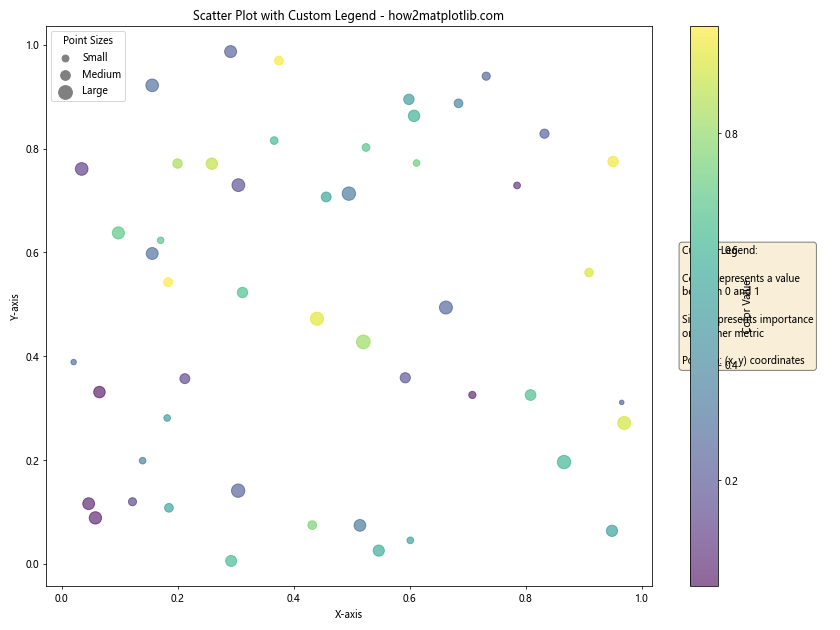
在这个示例中,我们创建了一个复杂的散点图,其中点的大小和颜色都代表不同的信息。我们使用标准的legend()函数创建了一个表示点大小的图例,并使用颜色条来解释颜色编码。此外,我们还添加了一个自定义的文本标签,作为额外的图例来解释图表中的各个元素。
这种方法允许我们为复杂的可视化提供更详细和自定义的解释,超越了标准图例的限制。
结论
在本文中,我们探讨了多种在Matplotlib散点图中为数据点添加标签的方法。从基本的文本标签到复杂的交互式标签,从单一的标记到多维度的编码,我们介绍了各种技术来增强散点图的信息量和可读性。
这些技术包括:
1. 使用基本的text()函数添加标签
2. 使用annotate()函数添加带箭头的标签
3. 处理大量数据点的标签
4. 避免标签重叠
5. 根据数据值设置标签颜色
6. 使用自定义格式化字符串
7. 创建交互式悬停标签
8. 结合使用不同的标记样式
9. 突出显示重要区域
10. 结合使用颜色编码和大小编码
11. 选择性地标记重要点
12. 组合近邻点的标签
13. 在极坐标系中添加标签
14. 创建动画散点图
15. 使用不同的字体和样式
16. 显示额外的统计信息
17. 创建自定义图例
这些技术可以单独使用,也可以组合使用,以创建信息丰富、视觉吸引力强的散点图。选择哪种方法取决于你的数据特性、目标受众以及你想要传达的信息。
记住,好的数据可视化不仅仅是展示数据,更是讲述数据背后的故事。通过恰当地使用标签,你可以引导读者注意到重要的趋势、异常值或模式,从而更有效地传达你的信息。
最后,虽然这些技术可以大大增强你的散点图,但也要注意不要过度使用。保持图表的清晰和简洁同样重要。始终考虑你的目标受众和你想要传达的核心信息,选择最适合的标记方式。
 极客教程
极客教程