Matplotlib饼图:全面掌握数据可视化利器
Matplotlib是Python中最流行的数据可视化库之一,而饼图则是其中一种常用且直观的图表类型。本文将深入探讨如何使用Matplotlib创建各种类型的饼图,从基础到高级,全面覆盖饼图的各个方面。无论你是数据分析师、科研工作者还是学生,掌握这些技巧都将帮助你更好地展示和理解数据。
1. 基础饼图的创建
饼图是展示部分与整体关系的理想选择。让我们从最基本的饼图开始,逐步深入学习。
1.1 创建简单饼图
首先,我们来创建一个最简单的饼图:
import matplotlib.pyplot as plt

# 数据
sizes = [30, 20, 25, 15, 10]
labels = ['A', 'B', 'C', 'D', 'E']

# 创建饼图
plt.pie(sizes, labels=labels)
plt.title('How2matplotlib.com Simple Pie Chart')
plt.axis('equal')  # 确保饼图是圆的
plt.show()
Output:
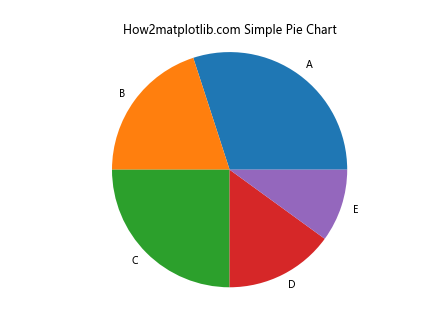
这个例子展示了如何创建一个基本的饼图。sizes列表包含了各部分的大小,labels列表则是对应的标签。plt.pie()函数是创建饼图的核心,而plt.axis('equal')确保饼图是圆形的,而不是椭圆形。
1.2 添加百分比标签
为了使饼图更加信息丰富,我们可以添加百分比标签:
import matplotlib.pyplot as plt

sizes = [30, 20, 25, 15, 10]
labels = ['A', 'B', 'C', 'D', 'E']

plt.pie(sizes, labels=labels, autopct='%1.1f%%')
plt.title('How2matplotlib.com Pie Chart with Percentages')
plt.axis('equal')
plt.show()
Output:
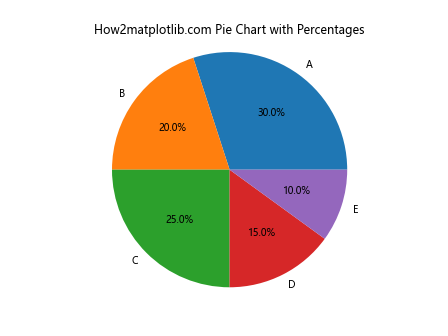
在这个例子中,我们添加了autopct='%1.1f%%'参数。这会在每个扇区显示百分比,精确到小数点后一位。
1.3 自定义颜色
Matplotlib允许我们自定义饼图的颜色,使其更加美观或符合特定主题:
import matplotlib.pyplot as plt

sizes = [30, 20, 25, 15, 10]
labels = ['A', 'B', 'C', 'D', 'E']
colors = ['#ff9999', '#66b3ff', '#99ff99', '#ffcc99', '#ff99cc']

plt.pie(sizes, labels=labels, colors=colors, autopct='%1.1f%%')
plt.title('How2matplotlib.com Pie Chart with Custom Colors')
plt.axis('equal')
plt.show()
Output:
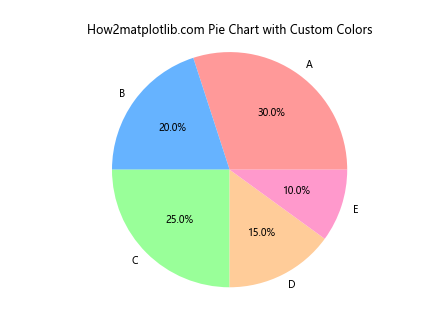
在这个例子中,我们定义了一个colors列表,包含了自定义的颜色代码。这些颜色将按顺序应用到饼图的各个扇区。
2. 高级饼图技巧
掌握了基础之后,让我们探索一些更高级的饼图技巧,这些技巧可以让你的数据可视化更加专业和吸引人。
2.1 突出显示特定扇区
有时我们需要强调饼图中的某个特定部分。这可以通过”分离”该扇区来实现:
import matplotlib.pyplot as plt

sizes = [30, 20, 25, 15, 10]
labels = ['A', 'B', 'C', 'D', 'E']
explode = (0, 0.1, 0, 0, 0)  # 只突出显示'B'

plt.pie(sizes, explode=explode, labels=labels, autopct='%1.1f%%', shadow=True)
plt.title('How2matplotlib.com Pie Chart with Exploded Slice')
plt.axis('equal')
plt.show()
Output:
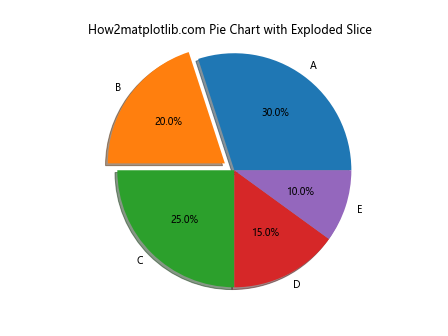
在这个例子中,我们使用explode参数来指定每个扇区的偏移量。值为0表示不偏移,而正值则会将扇区向外移动。我们还添加了shadow=True参数来给饼图添加阴影效果,使其看起来更立体。
2.2 添加图例
当标签太长或太多时,直接在饼图上显示可能会显得杂乱。这时,我们可以使用图例:
import matplotlib.pyplot as plt

sizes = [30, 20, 25, 15, 10]
labels = ['Category A', 'Category B', 'Category C', 'Category D', 'Category E']
colors = ['#ff9999', '#66b3ff', '#99ff99', '#ffcc99', '#ff99cc']

plt.pie(sizes, colors=colors, autopct='%1.1f%%', startangle=90)
plt.title('How2matplotlib.com Pie Chart with Legend')
plt.axis('equal')
plt.legend(labels, title="Categories", loc="center left", bbox_to_anchor=(1, 0, 0.5, 1))
plt.show()
Output:
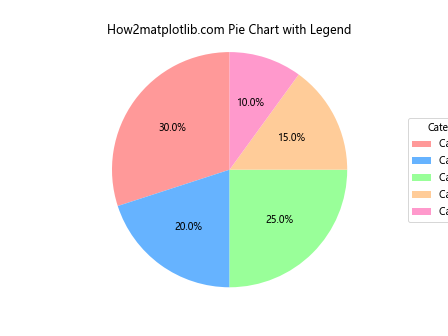
在这个例子中,我们使用plt.legend()函数添加了图例。loc="center left"和bbox_to_anchor=(1, 0, 0.5, 1)参数用于将图例放置在饼图的右侧。
2.3 嵌套饼图
嵌套饼图(也称为环形图)可以用来展示多层次的数据结构:
import matplotlib.pyplot as plt

# 外圈数据
sizes_outer = [30, 20, 50]
labels_outer = ['A', 'B', 'C']

# 内圈数据
sizes_inner = [15, 15, 10, 10, 20, 30]
labels_inner = ['A1', 'A2', 'B1', 'B2', 'C1', 'C2']

fig, ax = plt.subplots()

ax.pie(sizes_outer, labels=labels_outer, radius=1, wedgeprops=dict(width=0.3, edgecolor='white'))
ax.pie(sizes_inner, labels=labels_inner, radius=0.7, wedgeprops=dict(width=0.3, edgecolor='white'))

plt.title('How2matplotlib.com Nested Pie Chart')
plt.show()
Output:
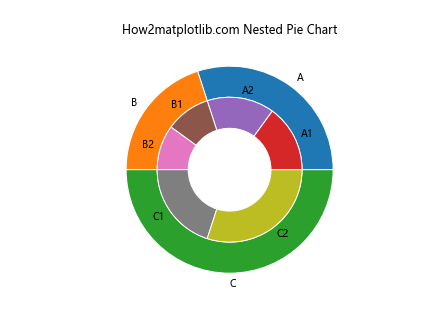
这个例子创建了一个嵌套饼图,外圈显示主要类别,内圈显示子类别。我们使用radius参数来控制每个饼图的大小,wedgeprops参数来设置扇区的宽度和边缘颜色。
3. 数据处理和饼图
在实际应用中,我们经常需要处理和转换数据以便在饼图中使用。让我们看看如何结合数据处理和饼图创建。
3.1 处理百分比数据
有时我们的数据已经是百分比形式,这时我们需要稍微调整我们的方法:
import matplotlib.pyplot as plt

percentages = [25, 30, 15, 10, 20]
labels = ['A', 'B', 'C', 'D', 'E']

plt.pie(percentages, labels=labels, autopct='%1.1f%%')
plt.title('How2matplotlib.com Pie Chart with Percentage Data')
plt.axis('equal')
plt.show()
Output:
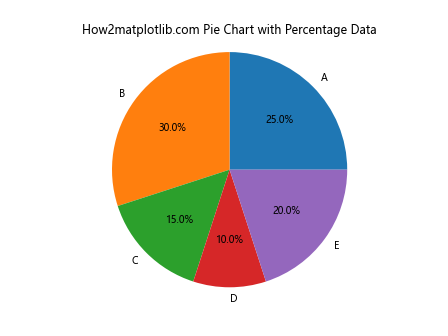
在这个例子中,我们直接使用百分比数据。Matplotlib会自动将这些值标准化,使它们的总和为100%。
3.2 处理大量数据
当数据项过多时,饼图可能变得难以阅读。一个常用的解决方案是只显示前几项,将其余项合并为”其他”:
import matplotlib.pyplot as plt

data = [15, 12, 10, 8, 7, 6, 5, 4, 3, 2, 1, 1, 1]
labels = ['A', 'B', 'C', 'D', 'E', 'F', 'G', 'H', 'I', 'J', 'K', 'L', 'M']

# 只显示前5项,其余合并为"其他"
top_5 = data[:5]
other = sum(data[5:])
sizes = top_5 + [other]
labels = labels[:5] + ['Other']

plt.pie(sizes, labels=labels, autopct='%1.1f%%')
plt.title('How2matplotlib.com Pie Chart with Grouped Data')
plt.axis('equal')
plt.show()
Output:
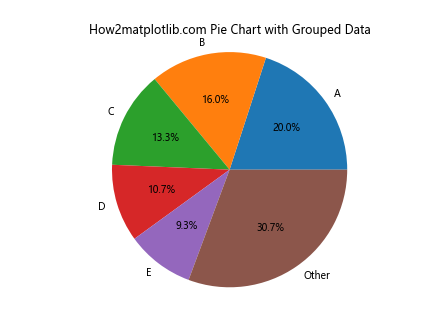
这个例子展示了如何处理大量数据项。我们选择了前5项单独显示,将剩余的项合并为”其他”类别。
3.3 从字典创建饼图
在实际应用中,数据经常以字典形式存在。以下是如何从字典创建饼图:
import matplotlib.pyplot as plt

data_dict = {'A': 30, 'B': 20, 'C': 25, 'D': 15, 'E': 10}

labels = list(data_dict.keys())
sizes = list(data_dict.values())

plt.pie(sizes, labels=labels, autopct='%1.1f%%')
plt.title('How2matplotlib.com Pie Chart from Dictionary')
plt.axis('equal')
plt.show()
Output:
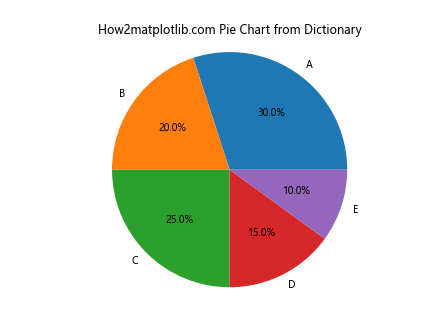
这个例子展示了如何从字典数据创建饼图。我们使用dict.keys()和dict.values()方法分别获取标签和数值。
4. 饼图的样式和美化
创建有吸引力的饼图不仅仅是about数据的准确表示,还涉及到视觉设计。让我们探索一些美化饼图的技巧。
4.1 使用自定义字体
改变字体可以大大提升饼图的视觉效果:
import matplotlib.pyplot as plt
import matplotlib.font_manager as fm

# 加载自定义字体
prop = fm.FontProperties(fname='path/to/your/font.ttf')

sizes = [30, 20, 25, 15, 10]
labels = ['A', 'B', 'C', 'D', 'E']

plt.pie(sizes, labels=labels, autopct='%1.1f%%', textprops={'fontproperties': prop})
plt.title('How2matplotlib.com Pie Chart with Custom Font', fontproperties=prop)
plt.axis('equal')
plt.show()
在这个例子中,我们使用FontProperties来加载自定义字体。注意要将’path/to/your/font.ttf’替换为你实际的字体文件路径。
4.2 添加3D效果
虽然2D饼图通常就足够了,但有时3D效果可以增加视觉吸引力:
import matplotlib.pyplot as plt

sizes = [30, 20, 25, 15, 10]
labels = ['A', 'B', 'C', 'D', 'E']

fig = plt.figure()
ax = fig.add_subplot(111, projection='3d')

ax.pie(sizes, labels=labels, autopct='%1.1f%%', startangle=90, shadow=True)
ax.set_title('How2matplotlib.com 3D Pie Chart')
plt.axis('equal')
plt.show()
这个例子使用了projection='3d'参数来创建3D轴。注意,3D饼图可能会稍微扭曲比例,所以在需要精确表示数据比例时应谨慎使用。
4.3 使用渐变色
渐变色可以为饼图添加更多视觉深度:
import matplotlib.pyplot as plt
import matplotlib.colors as mcolors

sizes = [30, 20, 25, 15, 10]
labels = ['A', 'B', 'C', 'D', 'E']

# 创建渐变色
cmap = plt.get_cmap("Blues")
outer_colors = cmap(np.arange(len(sizes))/len(sizes))

plt.pie(sizes, labels=labels, colors=outer_colors, autopct='%1.1f%%')
plt.title('How2matplotlib.com Pie Chart with Gradient Colors')
plt.axis('equal')
plt.show()
在这个例子中,我们使用plt.get_cmap()函数获取一个颜色映射,然后用它来创建一系列渐变色。
5. 交互式饼图
虽然静态饼图很有用,但交互式饼图可以提供更丰富的用户体验。虽然Matplotlib主要用于静态图表,但我们可以结合其他库来创建交互式饼图。
5.1 使用mpld3创建交互式饼图
mpld3是一个将Matplotlib图表转换为交互式D3.js可视化的库:
import matplotlib.pyplot as plt
import mpld3

sizes = [30, 20, 25, 15, 10]
labels = ['A', 'B', 'C', 'D', 'E']

fig, ax = plt.subplots()
ax.pie(sizes, labels=labels, autopct='%1.1f%%')
ax.set_title('How2matplotlib.com Interactive Pie Chart')
ax.axis('equal')

mpld3.show()
这个例子创建了一个基本的交互式饼图。用户可以悬停在扇区上查看详细信息。
5.2 使用Plotly创建交互式饼图
Plotly是另一个强大的交互式图表库,它可以与Matplotlib很好地集成:
import plotly.graph_objects as go
from plotly.subplots import make_subplots

labels = ['A', 'B', 'C', 'D', 'E']
sizes = [30, 20, 25, 15, 10]

fig = make_subplots(rows=1, cols=1, specs=[[{'type':'domain'}]])
fig.add_trace(go.Pie(labels=labels, values=sizes, name="How2matplotlib.com"),
              1, 1)

fig.update_traces(hole=.4, hoverinfo="label+percent+name")

fig.update_layout(
    title_text="How2matplotlib.com Interactive Pie Chart with Plotly",
    annotations=[dict(text='Pie Chart', x=0.5, y=0.5, font_size=20, showarrow=False)]
)

fig.show()
这个例子使用Plotly创建了一个交互式的环形图。用户可以点击图例来切换显示/隐藏某个类别,也可以悬停在扇区上查看详细信息。
6. 饼图的最佳实践
虽然饼图是一种常用的图表类型,但它也有一些局限性。以下是一些使用饼图的最佳实践:
6.1 限制类别数量
当类别过多时,饼图可能变得难以阅读和理解。一般建议将类别限制在5-7个以内:
import matplotlib.pyplot as plt

# 原始数据
data = {'A': 20, 'B': 15, 'C': 10, 'D': 8, 'E': 7, 'F': 6, 'G': 5, 'H': 4, 'I': 3, 'J': 2}

# 选择前5个类别,其余归为"其他"
top_5 = dict(sorted(data.items(), key=lambda x: x[1], reverse=True)[:5])
other = sum(dict(sorted(data.items(), key=lambda x: x[1], reverse=True)[5:]).values())
top_5['Other'] = other

plt.pie(top_5.values(), labels=top_5.keys(), autopct='%1.1f%%')
plt.title('How2matplotlib.com Pie Chart with Limited Categories')
plt.axis('equal')
plt.show()
Output:
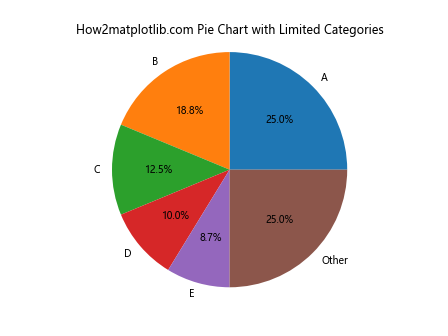
这个例子展示了如何处理有多个类别的数据。我们选择了前5个最大的类别,将其余的合并为”其他”类别。
6.2 使用恰当的颜色
选择合适的颜色可以增强饼图的可读性和美观性:
import matplotlib.pyplot as plt
import seaborn as sns

sizes = [30, 20, 25, 15, 10]
labels = ['A', 'B', 'C', 'D', 'E']

# 使用Seaborn的调色板
colors = sns.color_palette("pastel")

plt.pie(sizes, labels=labels, colors=colors, autopct='%1.1f%%')
plt.title('How2matplotlib.com Pie Chart with Seaborn Color Palette')
plt.axis('equal')
plt.show()
Output:
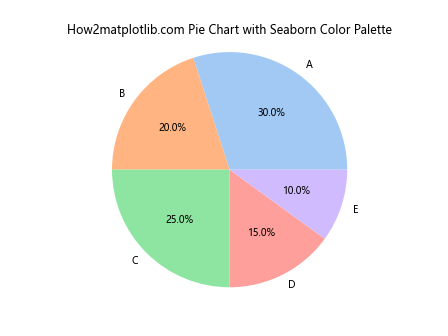
在这个例子中,我们使用了Seaborn库的调色板来选择颜色。这可以确保颜色之间的和谐性。
6.3 添加数据标签
为了提高饼图的信息量,我们可以同时显示百分比和实际数值:
import matplotlib.pyplot as plt

sizes = [30, 20, 25, 15, 10]
labels = ['A', 'B', 'C', 'D', 'E']

def make_autopct(values):
    def my_autopct(pct):
        total = sum(values)
        val = int(round(pct*total/100.0))
        return f'{pct:.1f}%\n({val:d})'
    return my_autopct

plt.pie(sizes, labels=labels, autopct=make_autopct(sizes))
plt.title('How2matplotlib.com Pie Chart with Percentage and Value Labels')
plt.axis('equal')
plt.show()
Output:
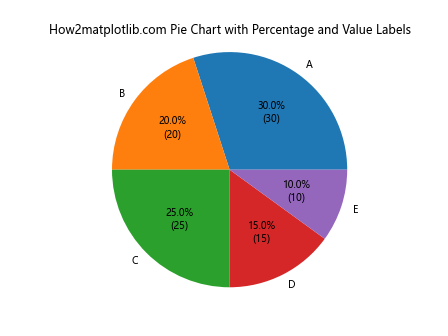
这个例子定义了一个自定义函数来同时显示百分比和实际数值。
7. 饼图的替代方案
虽然饼图在某些情况下很有用,但它并不总是最佳选择。让我们探讨一些饼图的替代方案。
7.1 条形图
当需要精确比较不同类别时,条形图通常是更好的选择:
import matplotlib.pyplot as plt

categories = ['A', 'B', 'C', 'D', 'E']
values = [30, 20, 25, 15, 10]

plt.bar(categories, values)
plt.title('How2matplotlib.com Bar Chart as Pie Chart Alternative')
plt.xlabel('Categories')
plt.ylabel('Values')
plt.show()
Output:
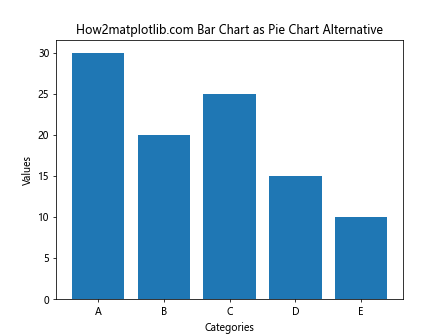
这个例子展示了如何使用条形图来表示相同的数据。条形图更容易进行精确的数值比较。
7.2 树状图
当数据有层次结构时,树状图可能是更好的选择:
import matplotlib.pyplot as plt
import squarify

sizes = [30, 20, 25, 15, 10]
labels = ['A', 'B', 'C', 'D', 'E']

squarify.plot(sizes=sizes, label=labels, alpha=.8)
plt.title('How2matplotlib.com Treemap as Pie Chart Alternative')
plt.axis('off')
plt.show()
Output:
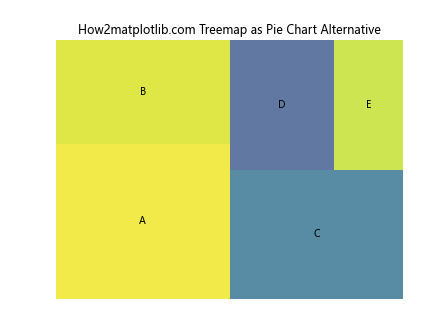
这个例子使用squarify库创建了一个树状图。树状图可以更好地展示数据的层次结构和相对大小。
7.3 极坐标条形图
极坐标条形图结合了饼图的圆形布局和条形图的精确性:
import matplotlib.pyplot as plt
import numpy as np

categories = ['A', 'B', 'C', 'D', 'E']
values = [30, 20, 25, 15, 10]

ax = plt.subplot(111, projection='polar')
theta = np.linspace(0.0, 2 * np.pi, len(categories), endpoint=False)
radii = values
width = 2*np.pi / len(categories)

ax.bar(theta, radii, width=width, bottom=0.0)
ax.set_xticks(theta)
ax.set_xticklabels(categories)
plt.title('How2matplotlib.com Polar Bar Chart as Pie Chart Alternative')
plt.show()
Output:
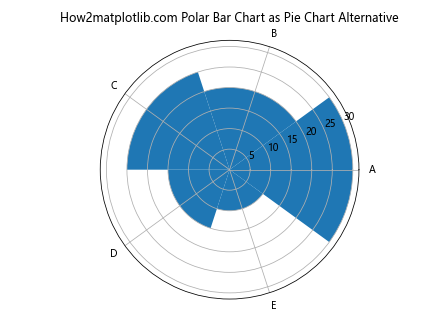
这个例子创建了一个极坐标条形图,它保留了饼图的圆形布局,同时允许更精确的数值比较。
8. 结合其他图表类型
有时,将饼图与其他类型的图表结合使用可以提供更全面的数据视图。
8.1 饼图和折线图的组合
import matplotlib.pyplot as plt

# 饼图数据
sizes = [30, 20, 25, 15, 10]
labels = ['A', 'B', 'C', 'D', 'E']

# 折线图数据
x = [1, 2, 3, 4, 5]
y = [2, 4, 1, 5, 3]

fig, (ax1, ax2) = plt.subplots(1, 2, figsize=(12, 5))

# 绘制饼图
ax1.pie(sizes, labels=labels, autopct='%1.1f%%')
ax1.set_title('How2matplotlib.com Pie Chart')

# 绘制折线图
ax2.plot(x, y, marker='o')
ax2.set_title('How2matplotlib.com Line Chart')
ax2.set_xlabel('X axis')
ax2.set_ylabel('Y axis')

plt.tight_layout()
plt.show()
Output:
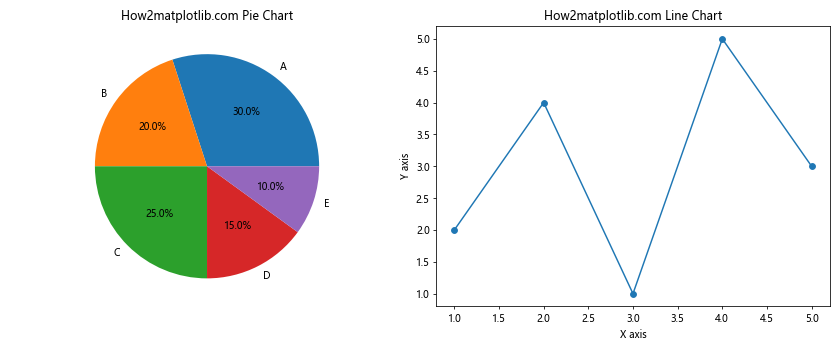
这个例子展示了如何在同一个图形中组合饼图和折线图,以提供更全面的数据视图。
8.2 饼图中嵌入条形图
import matplotlib.pyplot as plt
import numpy as np

# 饼图数据
sizes = [30, 20, 25, 15, 10]
labels = ['A', 'B', 'C', 'D', 'E']

# 条形图数据
bar_heights = [3, 4, 2, 1, 5]

fig, ax = plt.subplots()

# 绘制饼图
wedges, texts, autotexts = ax.pie(sizes, labels=labels, autopct='%1.1f%%',
                                  wedgeprops=dict(width=0.5), startangle=-40)

# 在饼图中心绘制条形图
bbox_props = dict(boxstyle="round,pad=0.3", fc="w", ec="k", lw=0.72)
kw = dict(arrowprops=dict(arrowstyle="-"),
          bbox=bbox_props, zorder=0, va="center")

for i, p in enumerate(wedges):
    ang = (p.theta2 - p.theta1)/2. + p.theta1
    y = np.sin(np.deg2rad(ang))
    x = np.cos(np.deg2rad(ang))
    horizontalalignment = {-1: "right", 1: "left"}[int(np.sign(x))]
    connectionstyle = f"angle,angleA=0,angleB={ang}"
    kw["arrowprops"].update({"connectionstyle": connectionstyle})
    ax.annotate(str(bar_heights[i]), xy=(x, y), xytext=(1.35*np.sign(x), 1.4*y),
                horizontalalignment=horizontalalignment, **kw)

ax.set_title('How2matplotlib.com Pie Chart with Embedded Bar Chart')
plt.show()
Output:
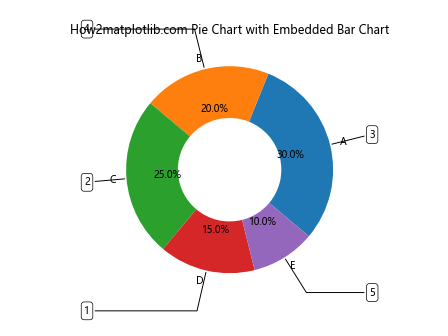
这个复杂的例子展示了如何在饼图的中心嵌入一个简化的条形图。这种组合可以在一个图表中显示两组相关的数据。
9. 动态饼图
虽然Matplotlib主要用于静态图表,但我们也可以创建简单的动画效果。
9.1 创建旋转的饼图
import matplotlib.pyplot as plt
import matplotlib.animation as animation

def animate(i):
    ax.clear()
    ax.pie(sizes, labels=labels, autopct='%1.1f%%', startangle=i*6)
    ax.set_title(f'How2matplotlib.com Rotating Pie Chart (Angle: {i*6}°)')

sizes = [30, 20, 25, 15, 10]
labels = ['A', 'B', 'C', 'D', 'E']

fig, ax = plt.subplots()
ani = animation.FuncAnimation(fig, animate, frames=60, interval=50, repeat=True)
plt.show()
Output:
这个例子创建了一个旋转的饼图动画。每一帧,饼图都会旋转一定角度。
9.2 创建增长的饼图
import matplotlib.pyplot as plt
import matplotlib.animation as animation
import numpy as np

def animate(i):
    ax.clear()
    current_sizes = [size * (i+1)/100 for size in sizes]
    ax.pie(current_sizes, labels=labels, autopct=lambda pct: f'{pct:.1f}%' if pct > 0 else '')
    ax.set_title(f'How2matplotlib.com Growing Pie Chart (Progress: {i+1}%)')

sizes = [30, 20, 25, 15, 10]
labels = ['A', 'B', 'C', 'D', 'E']

fig, ax = plt.subplots()
ani = animation.FuncAnimation(fig, animate, frames=100, interval=50, repeat=False)
plt.show()
Output:
这个例子创建了一个逐渐增长的饼图动画。饼图从0开始,逐渐增长到最终大小。
10. 结论
饼图是一种强大的数据可视化工具,特别适合展示部分与整体的关系。通过Matplotlib,我们可以创建各种类型的饼图,从简单的静态图表到复杂的交互式可视化。
本文涵盖了从基础饼图创建到高级技巧,包括数据处理、样式美化、最佳实践以及替代方案。我们还探讨了如何将饼图与其他图表类型结合,以及如何创建动态饼图。
记住,虽然饼图很有用,但它并不适合所有情况。在选择使用饼图时,要考虑数据的性质、目标受众以及你想传达的信息。在某些情况下,条形图、树状图或其他图表类型可能更合适。
最后,熟练掌握Matplotlib的饼图功能将极大地增强你的数据可视化能力,让你能够更有效地传达数据洞察。继续实践和探索,你会发现更多创新的方式来使用饼图展示你的数据。
 极客教程
极客教程