Matplotlib饼图绘制指南:如何展示百分比数据
参考:matplotlib pie chart with percentage
Matplotlib是Python中最流行的数据可视化库之一,它提供了强大而灵活的工具来创建各种类型的图表。其中,饼图是一种常用的图表类型,特别适合展示数据的比例分布。本文将深入探讨如何使用Matplotlib创建带有百分比标签的饼图,帮助您更好地展示和理解数据。
1. Matplotlib饼图基础
在开始创建带百分比的饼图之前,我们先来了解一下Matplotlib中饼图的基本概念和创建方法。
1.1 饼图的基本结构
饼图由一个圆形分割成多个扇形组成,每个扇形代表数据集中的一个类别。扇形的大小(角度)与该类别在整体中所占的比例成正比。
1.2 创建简单饼图
让我们从一个最基本的饼图开始:
import matplotlib.pyplot as plt

# 数据
sizes = [30, 20, 25, 15, 10]
labels = ['A', 'B', 'C', 'D', 'E']

# 创建饼图
plt.pie(sizes, labels=labels)
plt.title('How2matplotlib.com Basic Pie Chart')
plt.axis('equal')  # 确保饼图是圆的
plt.show()
Output:
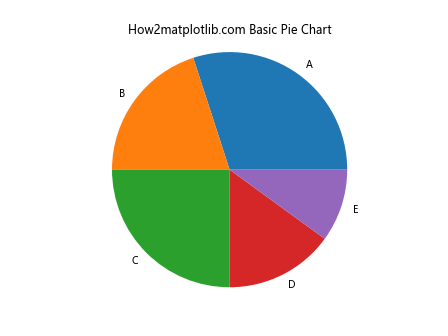
这个例子展示了如何创建一个基本的饼图。我们使用plt.pie()函数,传入数据和标签。plt.axis('equal')确保饼图是圆形的,而不是椭圆形。
2. 添加百分比标签
现在,让我们来看看如何给饼图添加百分比标签,这是本文的核心内容。
2.1 自动计算百分比
Matplotlib可以自动计算每个扇形的百分比:
import matplotlib.pyplot as plt

sizes = [30, 20, 25, 15, 10]
labels = ['A', 'B', 'C', 'D', 'E']

plt.pie(sizes, labels=labels, autopct='%1.1f%%')
plt.title('How2matplotlib.com Pie Chart with Percentages')
plt.axis('equal')
plt.show()
Output:
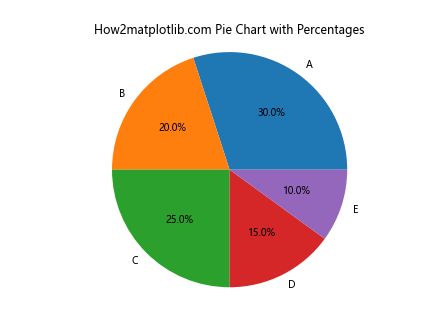
在这个例子中,我们使用autopct='%1.1f%%'参数来自动计算并显示百分比。%1.1f%%是一个格式化字符串,表示显示一位小数的浮点数,后跟百分号。
2.2 自定义百分比格式
您可以根据需要自定义百分比的显示格式:
import matplotlib.pyplot as plt

sizes = [30, 20, 25, 15, 10]
labels = ['A', 'B', 'C', 'D', 'E']

plt.pie(sizes, labels=labels, autopct='%1.2f%%')
plt.title('How2matplotlib.com Pie Chart with Custom Percentage Format')
plt.axis('equal')
plt.show()
Output:
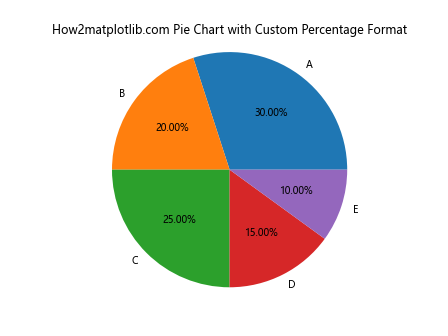
这里我们使用%1.2f%%来显示两位小数的百分比。
3. 调整饼图外观
创建了基本的带百分比的饼图后,我们可以进一步调整其外观以提高可读性和美观度。
3.1 添加阴影
为饼图添加阴影可以增加立体感:
import matplotlib.pyplot as plt

sizes = [30, 20, 25, 15, 10]
labels = ['A', 'B', 'C', 'D', 'E']

plt.pie(sizes, labels=labels, autopct='%1.1f%%', shadow=True)
plt.title('How2matplotlib.com Pie Chart with Shadow')
plt.axis('equal')
plt.show()
Output:
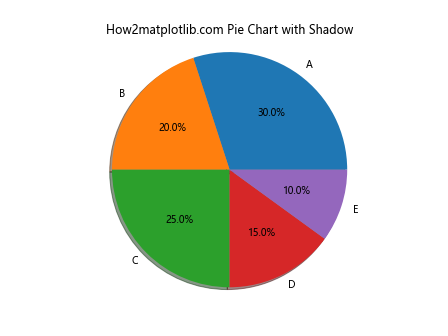
shadow=True参数为饼图添加了阴影效果。
3.2 突出显示某个扇形
有时我们需要强调某个特定的扇形:
import matplotlib.pyplot as plt

sizes = [30, 20, 25, 15, 10]
labels = ['A', 'B', 'C', 'D', 'E']
explode = (0, 0.1, 0, 0, 0)  # 只突出显示第二个扇形

plt.pie(sizes, explode=explode, labels=labels, autopct='%1.1f%%')
plt.title('How2matplotlib.com Pie Chart with Exploded Slice')
plt.axis('equal')
plt.show()
Output:
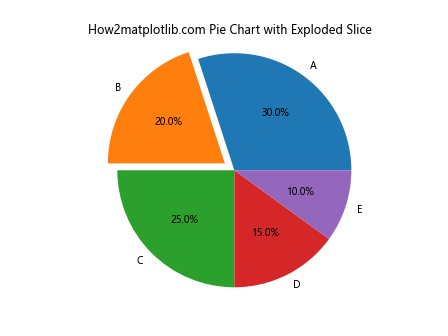
explode参数是一个元组,用于指定每个扇形的偏移量。在这个例子中,我们将第二个扇形(’B’)向外移动。
3.3 自定义颜色
您可以自定义饼图的颜色方案:
import matplotlib.pyplot as plt

sizes = [30, 20, 25, 15, 10]
labels = ['A', 'B', 'C', 'D', 'E']
colors = ['#ff9999', '#66b3ff', '#99ff99', '#ffcc99', '#ff99cc']

plt.pie(sizes, labels=labels, colors=colors, autopct='%1.1f%%')
plt.title('How2matplotlib.com Pie Chart with Custom Colors')
plt.axis('equal')
plt.show()
Output:
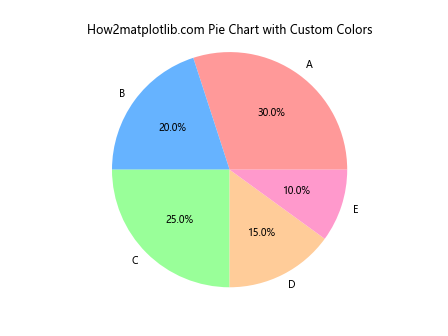
通过colors参数,我们可以为每个扇形指定自定义颜色。
4. 处理标签和图例
在处理复杂的数据集时,合理安排标签和图例可以大大提高饼图的可读性。
4.1 移动标签位置
有时默认的标签位置可能会重叠或不清晰,我们可以调整它们:
import matplotlib.pyplot as plt

sizes = [30, 20, 25, 15, 10]
labels = ['A', 'B', 'C', 'D', 'E']

plt.pie(sizes, labels=labels, autopct='%1.1f%%',
        pctdistance=0.85, labeldistance=1.05)
plt.title('How2matplotlib.com Pie Chart with Adjusted Label Positions')
plt.axis('equal')
plt.show()
Output:
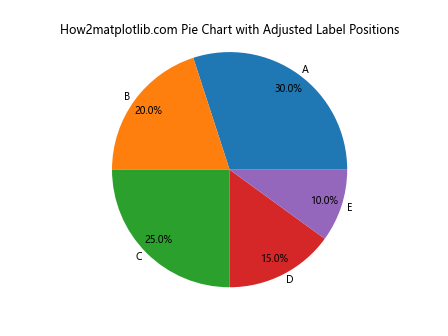
pctdistance参数控制百分比标签的位置,labeldistance控制标签的位置。值大于1表示向外移动,小于1表示向内移动。
4.2 使用图例代替直接标签
对于有很多小扇形的饼图,使用图例可能比直接在扇形上标注更清晰:
import matplotlib.pyplot as plt

sizes = [30, 20, 25, 15, 10]
labels = ['A', 'B', 'C', 'D', 'E']

plt.pie(sizes, autopct='%1.1f%%', pctdistance=0.85)
plt.title('How2matplotlib.com Pie Chart with Legend')
plt.legend(labels, title="Categories", loc="center left", bbox_to_anchor=(1, 0, 0.5, 1))
plt.axis('equal')
plt.tight_layout()
plt.show()
Output:
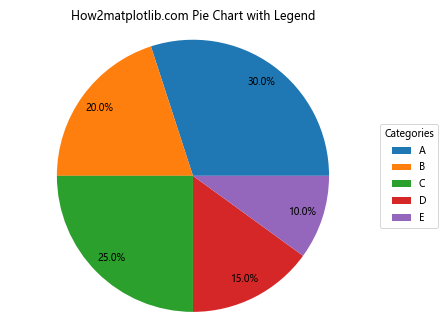
这个例子中,我们移除了labels参数,转而使用plt.legend()创建一个单独的图例。bbox_to_anchor参数用于调整图例的位置。
5. 处理小数值
在实际应用中,我们经常会遇到一些数值很小的类别,这些小数值可能会在饼图中难以辨识。
5.1 合并小数值
一种处理方法是将小于某个阈值的类别合并为”其他”:
import matplotlib.pyplot as plt
import numpy as np

sizes = [30, 20, 15, 10, 5, 4, 3, 2, 1]
labels = ['A', 'B', 'C', 'D', 'E', 'F', 'G', 'H', 'I']

# 合并小于5%的类别
threshold = 5
small_indices = np.where(np.array(sizes) < threshold)[0]
other_sum = sum(sizes[i] for i in small_indices)
new_sizes = [size for i, size in enumerate(sizes) if i not in small_indices] + [other_sum]
new_labels = [label for i, label in enumerate(labels) if i not in small_indices] + ['Other']

plt.pie(new_sizes, labels=new_labels, autopct='%1.1f%%')
plt.title('How2matplotlib.com Pie Chart with Merged Small Values')
plt.axis('equal')
plt.show()
Output:
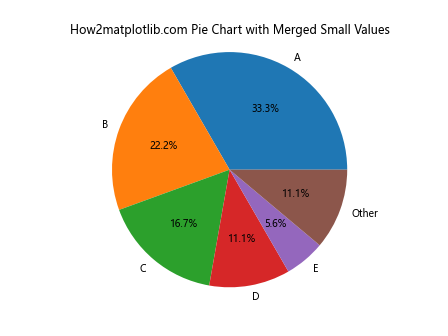
这个例子展示了如何将小于5%的类别合并为”其他”类别。
5.2 使用环形图
另一种方法是使用环形图,它可以更好地展示小数值:
import matplotlib.pyplot as plt

sizes = [30, 20, 15, 10, 5, 4, 3, 2, 1]
labels = ['A', 'B', 'C', 'D', 'E', 'F', 'G', 'H', 'I']

plt.pie(sizes, labels=labels, autopct='%1.1f%%', pctdistance=0.85,
        wedgeprops=dict(width=0.5))
plt.title('How2matplotlib.com Donut Chart for Small Values')
plt.axis('equal')
plt.show()
Output:
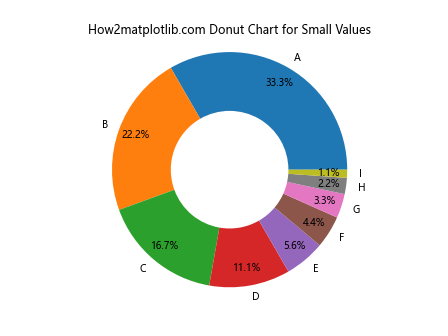
通过设置wedgeprops=dict(width=0.5),我们创建了一个环形图(或称作甜甜圈图),它可以更清晰地展示小数值。
6. 多层饼图
对于更复杂的数据结构,我们可能需要使用多层饼图来展示层级关系。
6.1 创建嵌套饼图
以下是一个创建嵌套饼图的例子:
import matplotlib.pyplot as plt

# 外层数据
sizes_outer = [40, 30, 30]
labels_outer = ['Group A', 'Group B', 'Group C']

# 内层数据
sizes_inner = [15, 25, 10, 20, 10, 20]
labels_inner = ['A1', 'A2', 'B1', 'B2', 'C1', 'C2']

fig, ax = plt.subplots()

# 绘制外层饼图
ax.pie(sizes_outer, labels=labels_outer, autopct='%1.1f%%', radius=1,
       wedgeprops=dict(width=0.3, edgecolor='white'))

# 绘制内层饼图
ax.pie(sizes_inner, labels=labels_inner, autopct='%1.1f%%', radius=0.7,
       wedgeprops=dict(width=0.4, edgecolor='white'))

plt.title('How2matplotlib.com Nested Pie Chart')
ax.axis('equal')
plt.show()
Output:
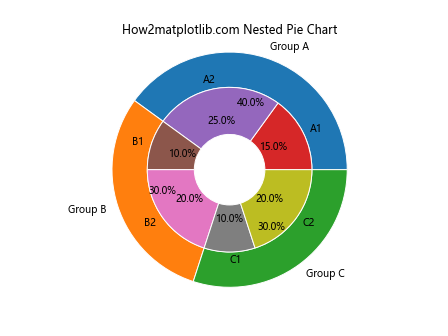
这个例子创建了一个嵌套饼图,外层显示主要分组,内层显示每个组内的细分。
7. 动态饼图
在某些情况下,我们可能需要创建动态更新的饼图,例如实时数据可视化。
7.1 使用动画创建动态饼图
以下是一个使用Matplotlib的动画功能创建动态饼图的例子:
import matplotlib.pyplot as plt
import matplotlib.animation as animation
import numpy as np

fig, ax = plt.subplots()

def update(frame):
    ax.clear()
    sizes = np.random.randint(1, 100, 5)
    labels = ['A', 'B', 'C', 'D', 'E']
    ax.pie(sizes, labels=labels, autopct='%1.1f%%')
    ax.set_title(f'How2matplotlib.com Dynamic Pie Chart (Frame {frame})')
    ax.axis('equal')

ani = animation.FuncAnimation(fig, update, frames=range(50), repeat=False)
plt.show()
Output:
这个例子创建了一个动态更新的饼图,每一帧都会生成新的随机数据。
8. 结合其他图表类型
有时,将饼图与其他类型的图表结合使用可以提供更全面的数据视图。
8.1 饼图和条形图的组合
以下是一个将饼图和条形图结合的例子:
import matplotlib.pyplot as plt

categories = ['A', 'B', 'C', 'D', 'E']
sizes = [30, 20, 25, 15, 10]
values = [100, 80, 95, 70, 60]

fig, (ax1, ax2) = plt.subplots(1, 2, figsize=(12, 5))

# 饼图
ax1.pie(sizes, labels=categories, autopct='%1.1f%%')
ax1.set_title('How2matplotlib.com Pie Chart')
ax1.axis('equal')

# 条形图
ax2.bar(categories, values)
ax2.set_title('How2matplotlib.com Bar Chart')
ax2.set_ylabel('Values')

plt.tight_layout()
plt.show()
Output:
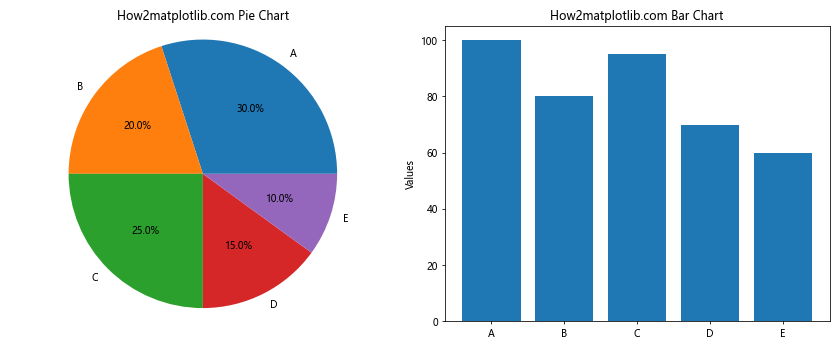
这个例子在同一个图形中展示了饼图(显示比例)和条形图(显示绝对值),提供了数据的两种不同视角。
9. 处理时间序列数据
饼图也可以用来展示时间序列数据的组成变化。
9.1 创建多个饼图展示时间变化
以下是一个展示不同时间点数据组成的例子:
import matplotlib.pyplot as plt

years = [2020, 2021, 2022]
data = {
    2020: [30, 20, 25, 15, 10],
    2021: [25, 22, 28, 15, 10],
    2022: [20, 25, 30, 15, 10]
}
categories = ['A', 'B', 'C', 'D', 'E']

fig, axes = plt.subplots(1, 3, figsize=(15, 5))

for i, year in enumerate(years):
    axes[i].pie(data[year], labels=categories, autopct='%1.1f%%')为每个子图设置标题
    axes[i].set_title(f'How2matplotlib.com {year}')
    axes[i].axis('equal')

plt.tight_layout()
plt.show()
这个例子创建了三个饼图,分别展示了2020年、2021年和2022年的数据组成变化。
10. 高级定制技巧
为了创建更专业和吸引人的饼图,我们可以使用一些高级定制技巧。
10.1 使用自定义字体和样式
以下是一个使用自定义字体和样式的例子:
import matplotlib.pyplot as plt
import matplotlib.font_manager as fm

# 加载自定义字体(请确保您的系统中有这个字体)
prop = fm.FontProperties(fname='path/to/your/font.ttf')

sizes = [30, 20, 25, 15, 10]
labels = ['A', 'B', 'C', 'D', 'E']
colors = ['#ff9999', '#66b3ff', '#99ff99', '#ffcc99', '#ff99cc']

fig, ax = plt.subplots(figsize=(10, 8))

wedges, texts, autotexts = ax.pie(sizes, labels=labels, colors=colors,
                                  autopct='%1.1f%%', startangle=90,
                                  wedgeprops=dict(width=0.6, edgecolor='white'))

# 设置字体样式
plt.setp(texts, font_properties=prop, size=12, weight="bold")
plt.setp(autotexts, font_properties=prop, size=10, weight="bold")

ax.set_title('How2matplotlib.com Custom Styled Pie Chart', fontproperties=prop, size=16)

plt.show()
这个例子展示了如何使用自定义字体、颜色和样式来创建更具个性化的饼图。
10.2 添加注释和箭头
有时我们需要为饼图的特定部分添加额外的注释:
import matplotlib.pyplot as plt

sizes = [30, 20, 25, 15, 10]
labels = ['A', 'B', 'C', 'D', 'E']

fig, ax = plt.subplots(figsize=(10, 8))

wedges, texts, autotexts = ax.pie(sizes, labels=labels, autopct='%1.1f%%',
                                  startangle=90)

# 添加注释和箭头
ax.annotate('Important!', xy=(0.7, 0.9), xytext=(1.2, 1),
            arrowprops=dict(facecolor='black', shrink=0.05))

plt.title('How2matplotlib.com Pie Chart with Annotation')
plt.axis('equal')
plt.show()
Output:
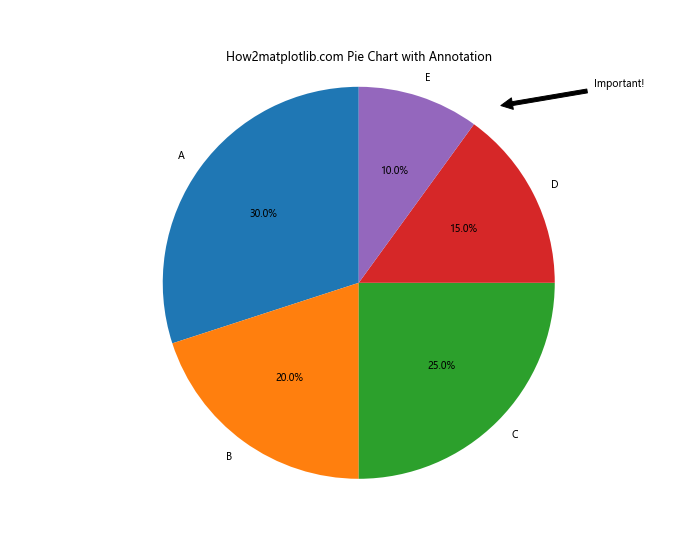
这个例子展示了如何为饼图添加注释和箭头,以强调特定的信息点。
11. 处理大量数据
当处理大量数据类别时,传统的饼图可能会变得杂乱。以下是一些处理这种情况的技巧。
11.1 使用词云代替饼图
对于大量小类别,使用词云可能比饼图更有效:
import matplotlib.pyplot as plt
from wordcloud import WordCloud

# 假设我们有大量数据
data = {'A': 30, 'B': 20, 'C': 25, 'D': 15, 'E': 10, 'F': 8, 'G': 7, 'H': 6,
        'I': 5, 'J': 4, 'K': 3, 'L': 2, 'M': 1}

wordcloud = WordCloud(width=800, height=400, background_color='white').generate_from_frequencies(data)

plt.figure(figsize=(10, 5))
plt.imshow(wordcloud, interpolation='bilinear')
plt.axis('off')
plt.title('How2matplotlib.com Word Cloud Instead of Pie Chart')
plt.show()
这个例子展示了如何使用词云来代替传统饼图,特别适合处理大量小类别的数据。
11.2 使用树状图
树状图(Treemap)是另一种处理大量分类数据的有效方式:
import matplotlib.pyplot as plt
import squarify

sizes = [30, 20, 25, 15, 10, 8, 7, 6, 5, 4, 3, 2, 1]
labels = ['A', 'B', 'C', 'D', 'E', 'F', 'G', 'H', 'I', 'J', 'K', 'L', 'M']

fig, ax = plt.subplots(figsize=(12, 8))
squarify.plot(sizes=sizes, label=labels, alpha=0.8, text_kwargs={'fontsize':12})
plt.title('How2matplotlib.com Treemap as Alternative to Pie Chart')
plt.axis('off')
plt.show()
Output:
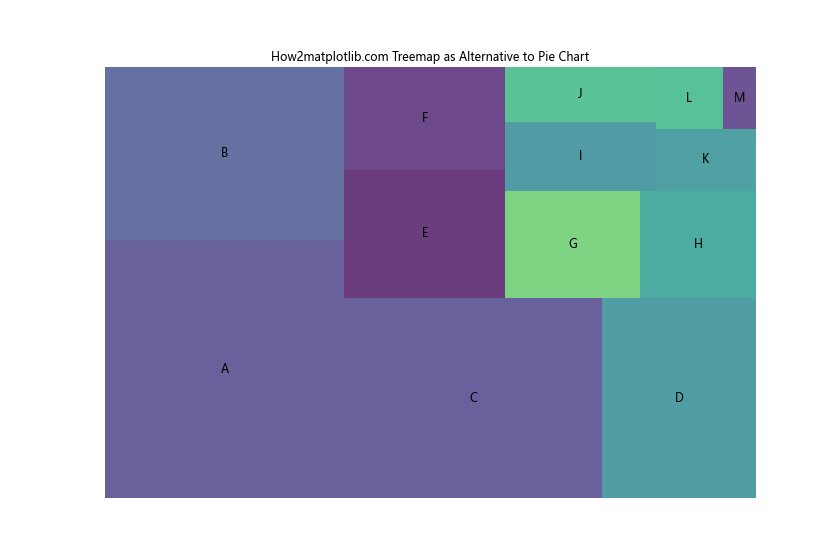
这个例子使用squarify库创建了一个树状图,它可以更有效地展示大量类别的相对大小。
12. 饼图的最佳实践
在使用饼图时,遵循一些最佳实践可以帮助您创建更有效的数据可视化。
12.1 限制类别数量
一般来说,饼图最适合展示不超过5-7个类别的数据:
import matplotlib.pyplot as plt

sizes = [30, 25, 20, 15, 10]
labels = ['A', 'B', 'C', 'D', 'E']

plt.pie(sizes, labels=labels, autopct='%1.1f%%')
plt.title('How2matplotlib.com Optimal Number of Categories')
plt.axis('equal')
plt.show()
Output:
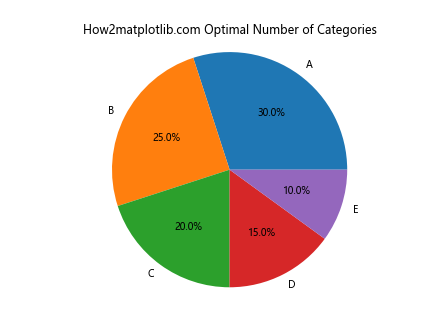
这个例子展示了一个包含5个类别的饼图,这是一个理想的数量,可以清晰地展示各个部分。
12.2 按大小排序
将扇形按大小排序可以提高饼图的可读性:
import matplotlib.pyplot as plt

sizes = [15, 30, 25, 10, 20]
labels = ['A', 'B', 'C', 'D', 'E']

# 排序
sorted_data = sorted(zip(sizes, labels), reverse=True)
sizes_sorted, labels_sorted = zip(*sorted_data)

plt.pie(sizes_sorted, labels=labels_sorted, autopct='%1.1f%%')
plt.title('How2matplotlib.com Pie Chart with Sorted Slices')
plt.axis('equal')
plt.show()
Output:
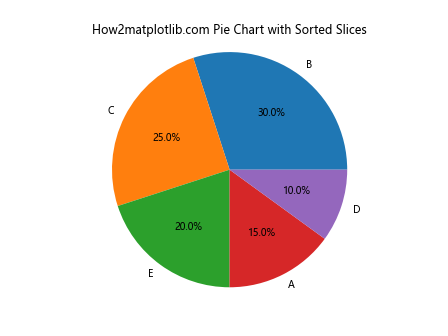
这个例子展示了如何将饼图的扇形按大小降序排列,使得最大的扇形从12点钟位置开始顺时针排列。
结论
通过本文,我们详细探讨了如何使用Matplotlib创建带有百分比的饼图,并介绍了多种高级技巧和最佳实践。从基本的饼图创建到复杂的数据处理和可视化技巧,这些知识将帮助您更有效地使用饼图来展示数据。记住,虽然饼图是一种强大的可视化工具,但它并不适合所有类型的数据。在选择使用饼图时,要考虑数据的性质和您想要传达的信息。通过合理使用颜色、标签、图例和其他视觉元素,您可以创建既美观又信息丰富的饼图,有效地传达数据中的关键信息。
 极客教程
极客教程