Matplotlib移动图例
在使用Matplotlib绘制图表时,图例是非常重要的元素之一。图例可以帮助读者更好地理解图表中每个数据系列的含义,但有时候默认的图例位置并不适合我们的需求。在这篇文章中,我们将介绍如何使用Matplotlib移动图例,以满足不同的布局需求。
移动图例到指定位置
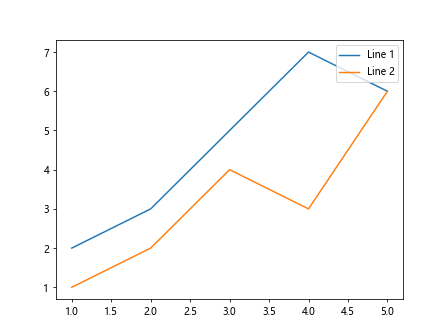
有时候我们希望将图例移动到图表的特定位置,比如在右上角、左下角等位置。我们可以通过设置loc参数来实现这一目标。
import matplotlib.pyplot as plt

x = [1, 2, 3, 4, 5]
y1 = [2, 3, 5, 7, 6]
y2 = [1, 2, 4, 3, 6]

plt.plot(x, y1, label='Line 1')
plt.plot(x, y2, label='Line 2')

plt.legend(loc='upper right')
plt.show()
Output:
移动图例到自定义位置
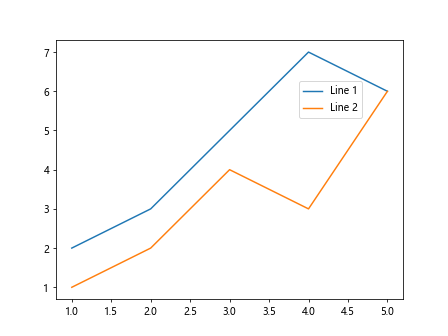
除了使用预定义的位置外,我们还可以通过设置坐标来移动图例到自定义位置。
import matplotlib.pyplot as plt

x = [1, 2, 3, 4, 5]
y1 = [2, 3, 5, 7, 6]
y2 = [1, 2, 4, 3, 6]

plt.plot(x, y1, label='Line 1')
plt.plot(x, y2, label='Line 2')

plt.legend(loc=(0.7, 0.7))  # 将图例移动到指定坐标(0.7, 0.7)
plt.show()
Output:
调整图例的边距
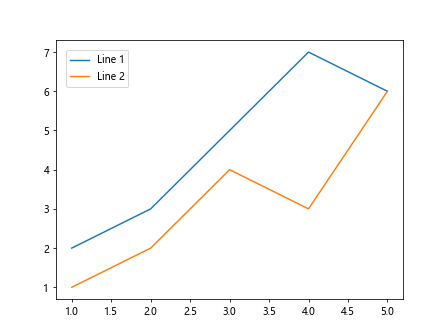
有时候图例与图表之间的间距过大或过小,我们可以通过调整borderaxespad参数来更改图例与图表的边距。
import matplotlib.pyplot as plt

x = [1, 2, 3, 4, 5]
y1 = [2, 3, 5, 7, 6]
y2 = [1, 2, 4, 3, 6]

plt.plot(x, y1, label='Line 1')
plt.plot(x, y2, label='Line 2')

plt.legend(borderaxespad=1.0)  # 调整边距为1.0
plt.show()
Output:
调整图例的大小
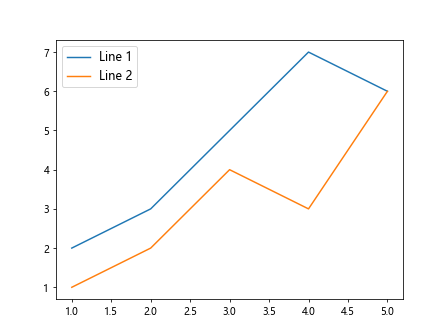
如果图例中的文字过小或过大,我们可以通过设置fontsize参数来调整图例的文字大小。
import matplotlib.pyplot as plt

x = [1, 2, 3, 4, 5]
y1 = [2, 3, 5, 7, 6]
y2 = [1, 2, 4, 3, 6]

plt.plot(x, y1, label='Line 1')
plt.plot(x, y2, label='Line 2')

plt.legend(fontsize=12)  # 设置文字大小为12
plt.show()
Output:
使用bbox_to_anchor移动图例
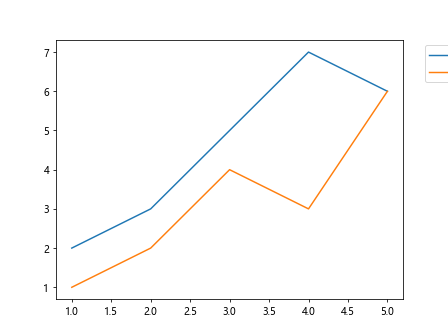
当图例位置无法通过loc参数来满足需求时,我们可以使用bbox_to_anchor参数来手动设置图例的相对位置。
import matplotlib.pyplot as plt

x = [1, 2, 3, 4, 5]
y1 = [2, 3, 5, 7, 6]
y2 = [1, 2, 4, 3, 6]

plt.plot(x, y1, label='Line 1')
plt.plot(x, y2, label='Line 2')

plt.legend(bbox_to_anchor=(1.05, 1))  # 将图例移动到图表外部
plt.show()
Output:
移除图例边框
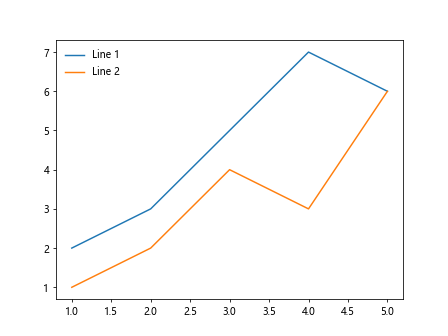
有时候我们希期移除图例的边框,使其更加简洁。可以通过设置frameon参数为False来实现。
import matplotlib.pyplot as plt

x = [1, 2, 3, 4, 5]
y1 = [2, 3, 5, 7, 6]
y2 = [1, 2, 4, 3, 6]

plt.plot(x, y1, label='Line 1')
plt.plot(x, y2, label='Line 2')

plt.legend(frameon=False)  # 移除图例边框
plt.show()
Output:
设置图例标题
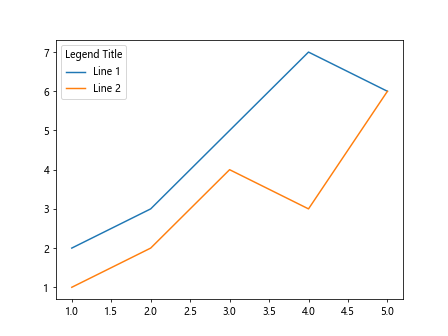
有时候我们希望为图例添加一个标题,来更好地说明每个数据系列的含义。可以通过设置title参数为标题字符串来实现。
import matplotlib.pyplot as plt

x = [1, 2, 3, 4, 5]
y1 = [2, 3, 5, 7, 6]
y2 = [1, 2, 4, 3, 6]

plt.plot(x, y1, label='Line 1')
plt.plot(x, y2, label='Line 2')

plt.legend(title='Legend Title')  # 设置图例标题
plt.show()
Output:
设置图例的背景色
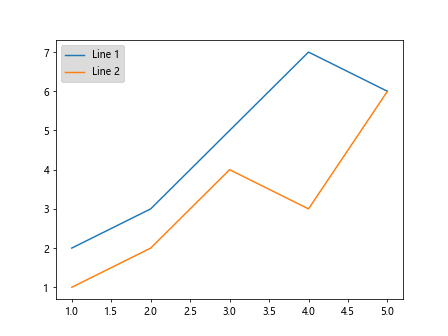
我们可以通过设置facecolor参数来更改图例的背景颜色。
import matplotlib.pyplot as plt

x = [1, 2, 3, 4, 5]
y1 = [2, 3, 5, 7, 6]
y2 = [1, 2, 4, 3, 6]

plt.plot(x, y1, label='Line 1')
plt.plot(x, y2, label='Line 2')

plt.legend(facecolor='lightgrey')  # 设置图例背景色为浅灰色
plt.show()
Output:
设置图例边框样式
除了背景色,我们还可以通过设置edgecolor和linewidth参数来更改图例的边框样式。
import matplotlib.pyplot as plt

x = [1, 2, 3, 4, 5]
y1 = [2, 3, 5, 7, 6]
y2 = [1, 2, 4, 3, 6]

plt.plot(x, y1, label='Line 1')
plt.plot(x, y2, label='Line 2')

plt.legend(edgecolor='black', linewidth=1.5)  # 设置边框颜色为黑色,线宽为1.5
plt.show()
通过上述示例代码,我们介绍了如何在Matplotlib中移动图例、调整图例的位置、边距、大小,以及如何设置图例的背景色、边框样式等。
 极客教程
极客教程