matplotlib线条粗细设置
在matplotlib中,我们可以通过设置线条的粗细来调整图表中线条的粗细程度,从而实现美化图表的效果。在本文中,我们将详细介绍如何在matplotlib中设置线条的粗细。
1. 设置线条的默认粗细
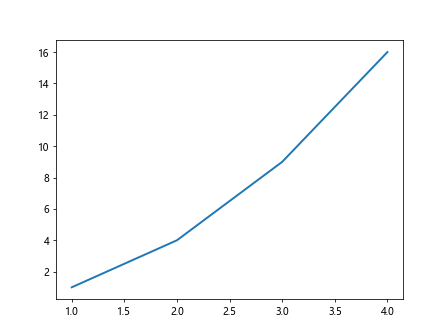
在matplotlib中,我们可以通过rcParams来设置线条的默认粗细。下面是一个简单的示例代码:
import matplotlib.pyplot as plt

plt.rcParams['lines.linewidth'] = 2

plt.plot([1, 2, 3, 4], [1, 4, 9, 16])
plt.show()
Output:

在上面的示例代码中,我们使用plt.rcParams['lines.linewidth'] = 2来设置线条的默认粗细为2。
2. 设置特定线条的粗细
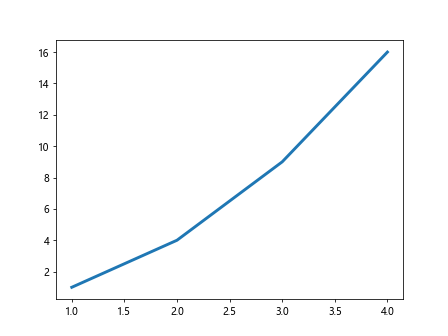
除了设置默认线条粗细外,我们还可以在绘制图形时针对特定的线条设置粗细。下面是一个示例代码:
import matplotlib.pyplot as plt

plt.plot([1, 2, 3, 4], [1, 4, 9, 16], linewidth=3)
plt.show()
Output:

在上面的示例代码中,我们使用linewidth=3来设置这条线的粗细为3。
3. 设置子图中线条的粗细
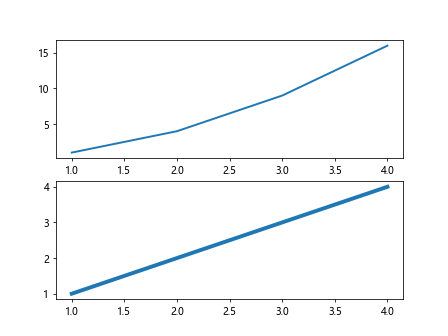
在绘制包含多个子图的图表时,我们可以单独设置每个子图中线条的粗细。下面是一个示例代码:
import matplotlib.pyplot as plt

fig, axs = plt.subplots(2)

axs[0].plot([1, 2, 3, 4], [1, 4, 9, 16], linewidth=2)
axs[1].plot([1, 2, 3, 4], [1, 2, 3, 4], linewidth=4)

plt.show()
Output:

在上面的示例代码中,我们在两个子图中分别设置了不同线条的粗细。
4. 离散型线条粗细设置
有时候我们需要绘制不同粗细的离散型线条,可以使用set_linewidths方法。下面是一个示例代码:
import matplotlib.pyplot as plt

plt.eventplot([1, 2, 3, 4], linelengths=0.2, colors='k')
plt.set_linewidths([1, 2, 3, 4])

plt.show()
在上面的示例代码中,我们通过plt.set_linewidths([1, 2, 3, 4])方法设置了不同线条的粗细。
5. 不规则线条粗细设置
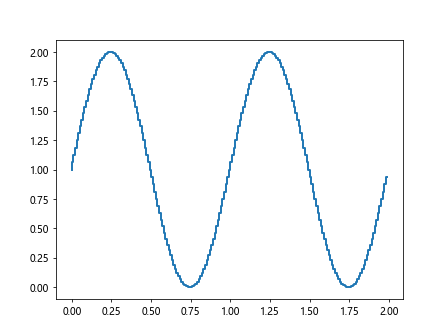
有时候我们需要绘制不规则形状的线条,并且需要设置线条的粗细。下面是一个示例代码:
import matplotlib.pyplot as plt
import numpy as np

t = np.arange(0.0, 2.0, 0.01)
s = 1 + np.sin(2*np.pi*t)

plt.step(t, s, linewidth=2)
plt.show()
Output:

在上面的示例代码中,我们使用plt.step来绘制不规则形状的线条,并且设置了线条的粗细为2。
通过以上示例代码,我们可以清楚地看到如何在matplotlib中设置线条的粗细。我们可以根据需要调整线条的粗细,从而实现更加美观的图表效果。
 极客教程
极客教程