matplotlib线条样式
在matplotlib中,线条样式是指控制图表中线条外观的一种属性。通过使用不同的线条样式,我们可以使得图表更加清晰和美观。本文将介绍matplotlib中常用的线条样式,并给出详细的示例代码。
1. 实线样式
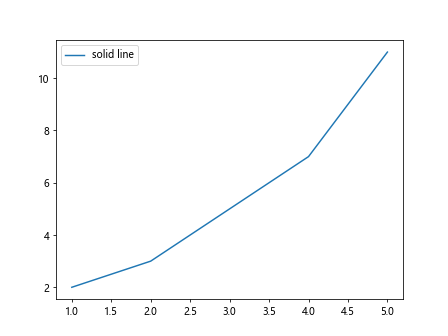
实线是最常用的线条样式之一,用于绘制折线图、曲线图等。
import matplotlib.pyplot as plt

x = [1, 2, 3, 4, 5]
y = [2, 3, 5, 7, 11]

plt.plot(x, y, linestyle='-', label='solid line')
plt.legend()
plt.show()
Output:
2. 虚线样式
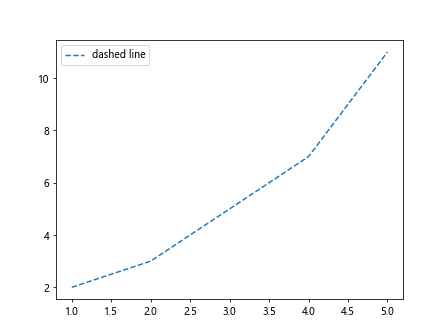
虚线样式在图表中用于突出特定的数据部分。
import matplotlib.pyplot as plt

x = [1, 2, 3, 4, 5]
y = [2, 3, 5, 7, 11]

plt.plot(x, y, linestyle='--', label='dashed line')
plt.legend()
plt.show()
Output:
3. 点线样式
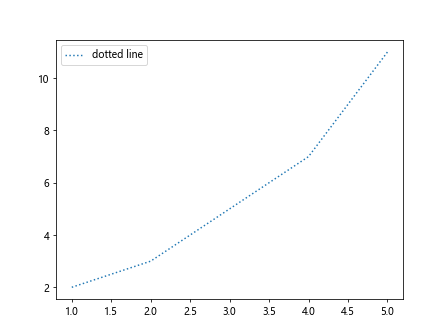
点线样式通常用于标记数据点的位置。
import matplotlib.pyplot as plt

x = [1, 2, 3, 4, 5]
y = [2, 3, 5, 7, 11]

plt.plot(x, y, linestyle=':', label='dotted line')
plt.legend()
plt.show()
Output:
4. 点划线样式
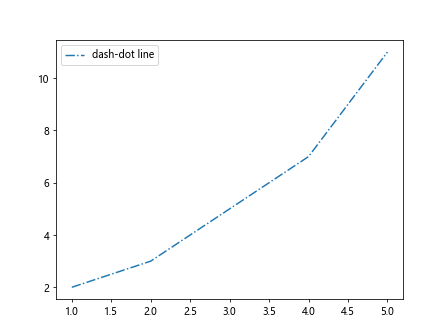
点划线样式是点线和虚线的结合。
import matplotlib.pyplot as plt

x = [1, 2, 3, 4, 5]
y = [2, 3, 5, 7, 11]

plt.plot(x, y, linestyle='-.', label='dash-dot line')
plt.legend()
plt.show()
Output:
5. 自定义线条样式
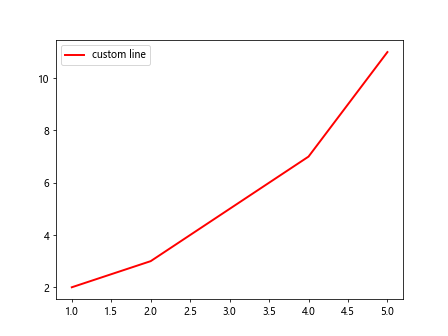
除了常见的线条样式外,我们还可以自定义线条样式,例如设置线条颜色、宽度等属性。
import matplotlib.pyplot as plt

x = [1, 2, 3, 4, 5]
y = [2, 3, 5, 7, 11]

plt.plot(x, y, linestyle='-', color='red', linewidth=2, label='custom line')
plt.legend()
plt.show()
Output:
6. 多线条样式
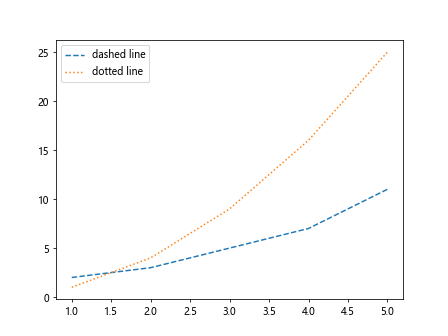
在同一个图表中可以绘制多条线,每条线可以有不同的线条样式。
import matplotlib.pyplot as plt

x = [1, 2, 3, 4, 5]
y1 = [2, 3, 5, 7, 11]
y2 = [1, 4, 9, 16, 25]

plt.plot(x, y1, linestyle='--', label='dashed line')
plt.plot(x, y2, linestyle=':', label='dotted line')
plt.legend()
plt.show()
Output:
7. 结合线条样式
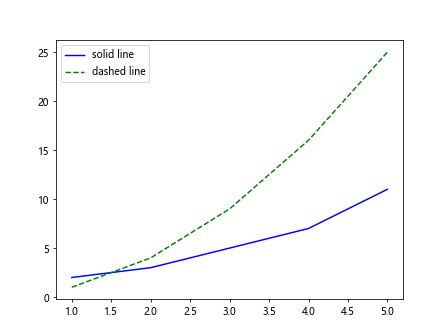
在图表中可以结合不同的线条样式,绘制出更加复杂的线条。
import matplotlib.pyplot as plt

x = [1, 2, 3, 4, 5]
y1 = [2, 3, 5, 7, 11]
y2 = [1, 4, 9, 16, 25]

plt.plot(x, y1, linestyle='-', color='blue', label='solid line')
plt.plot(x, y2, linestyle='--', color='green', label='dashed line')
plt.legend()
plt.show()
Output:
8. 隐藏线条
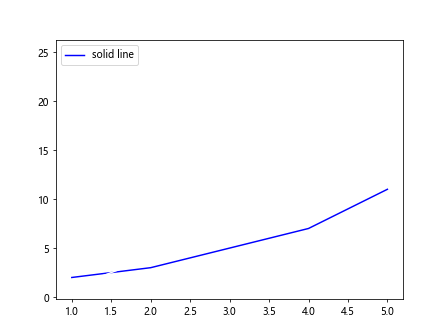
有时候我们需要在图表中显示一部分数据,并隐藏另一部分数据的线条。
import matplotlib.pyplot as plt

x = [1, 2, 3, 4, 5]
y1 = [2, 3, 5, 7, 11]
y2 = [1, 4, 9, 16, 25]

plt.plot(x, y1, linestyle='-', color='blue', label='solid line')
plt.plot(x, y2, linestyle='-', color='white') # 隐藏线条
plt.legend()
plt.show()
Output:
9. 自定义线条样式
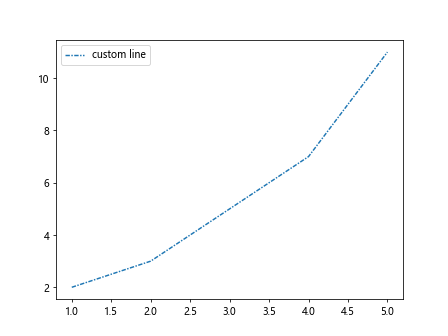
除了内置的线条样式外,我们还可以通过定义自定义样式的方式来绘制线条。
import matplotlib.pyplot as plt

x = [1, 2, 3, 4, 5]
y = [2, 3, 5, 7, 11]

plt.plot(x, y, linestyle=(0, (3, 1, 1, 1)), label='custom line')
plt.legend()
plt.show()
Output:
10. 线条样式总结
在matplotlib中,线条样式是控制图表外观的重要属性。通过选择合适的线条样式,我们可以绘制出清晰、美观的图表。除了常见的实线、虚线、点线样式外,我们还可以自定义线条样式,从而满足不同需求。
在本文中,我们介绍了常用的线条样式,并给出了详细的示例代码。通过学习和实践,相信读者可以更加熟练地运用matplotlib中的线条样式,绘制出更加精美的图表。
 极客教程
极客教程