Matplotlib图例(Legend)的全面指南:如何创建、自定义和优化
Matplotlib是Python中最流行的数据可视化库之一,而图例(Legend)是数据可视化中不可或缺的组成部分。本文将全面介绍Matplotlib中图例的使用,从基础创建到高级自定义,帮助您掌握如何在图表中有效地使用图例来增强数据的可读性和解释性。
1. 图例的基本概念
图例是图表中用于解释各个数据系列含义的元素。它通常包含一个小样本(如线条、标记或颜色块)和相应的描述文本。在Matplotlib中,我们可以使用legend()方法来添加图例。
让我们从一个简单的例子开始:
import matplotlib.pyplot as plt

plt.figure(figsize=(8, 6))
plt.plot([1, 2, 3, 4], [1, 4, 2, 3], label='Line 1')
plt.plot([1, 2, 3, 4], [2, 3, 4, 1], label='Line 2')
plt.title('Simple Plot with Legend - how2matplotlib.com')
plt.xlabel('X-axis')
plt.ylabel('Y-axis')
plt.legend()
plt.show()
Output:
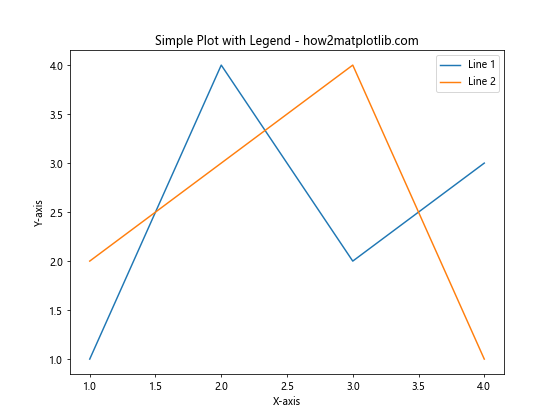
在这个例子中,我们创建了两条线,并为每条线设置了label参数。然后,我们调用plt.legend()来显示图例。legend()方法会自动收集所有带有label参数的图形元素,并创建相应的图例。
2. 图例的位置
默认情况下,Matplotlib会尝试将图例放置在最佳位置,以避免遮挡数据。但有时我们可能想要明确指定图例的位置。我们可以通过loc参数来实现这一点。
import matplotlib.pyplot as plt

plt.figure(figsize=(8, 6))
plt.plot([1, 2, 3, 4], [1, 4, 2, 3], label='Data 1')
plt.plot([1, 2, 3, 4], [2, 3, 4, 1], label='Data 2')
plt.title('Legend Position Demo - how2matplotlib.com')
plt.xlabel('X-axis')
plt.ylabel('Y-axis')
plt.legend(loc='upper right')
plt.show()
Output:
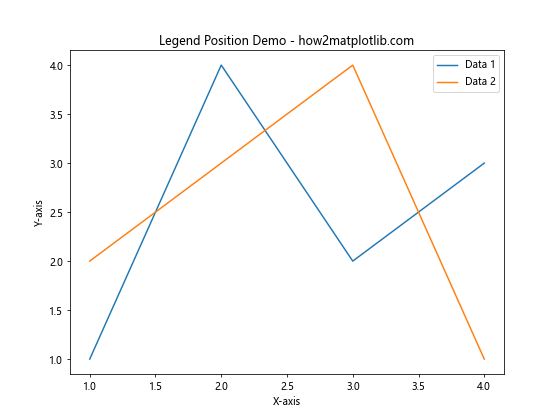
在这个例子中,我们将图例放置在右上角。loc参数可以接受以下值:
- ‘best’
- ‘upper right’
- ‘upper left’
- ‘lower left’
- ‘lower right’
- ‘right’
- ‘center left’
- ‘center right’
- ‘lower center’
- ‘upper center’
- ‘center’
您也可以使用数字代码(0-10)来指定这些位置。
3. 自定义图例样式
Matplotlib提供了多种方法来自定义图例的外观。我们可以更改图例框的颜色、透明度、边框等属性。
import matplotlib.pyplot as plt

plt.figure(figsize=(8, 6))
plt.plot([1, 2, 3, 4], [1, 4, 2, 3], label='Series A')
plt.plot([1, 2, 3, 4], [2, 3, 4, 1], label='Series B')
plt.title('Customized Legend Style - how2matplotlib.com')
plt.xlabel('X-axis')
plt.ylabel('Y-axis')
plt.legend(facecolor='lightgray', edgecolor='black', framealpha=0.5,
           title='Data Series', title_fontsize='large')
plt.show()
Output:
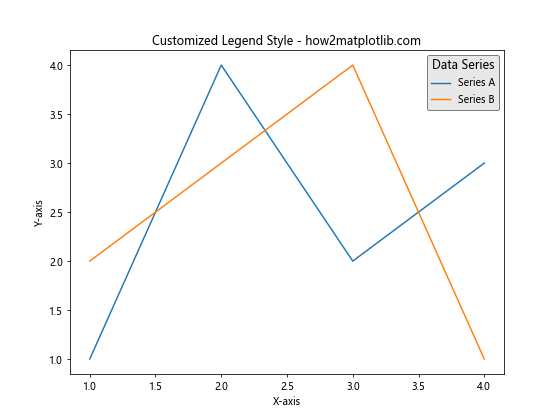
在这个例子中,我们设置了图例的背景色(facecolor)、边框颜色(edgecolor)、透明度(framealpha),并添加了一个标题。
4. 多列图例
当您有多个数据系列时,可能需要将图例排列成多列以节省空间。
import matplotlib.pyplot as plt

plt.figure(figsize=(10, 6))
for i in range(5):
    plt.plot([1, 2, 3, 4], [i+1, i+2, i+3, i+4], label=f'Series {i+1}')
plt.title('Multi-column Legend - how2matplotlib.com')
plt.xlabel('X-axis')
plt.ylabel('Y-axis')
plt.legend(ncol=3, loc='upper center', bbox_to_anchor=(0.5, -0.05))
plt.tight_layout()
plt.show()
Output:
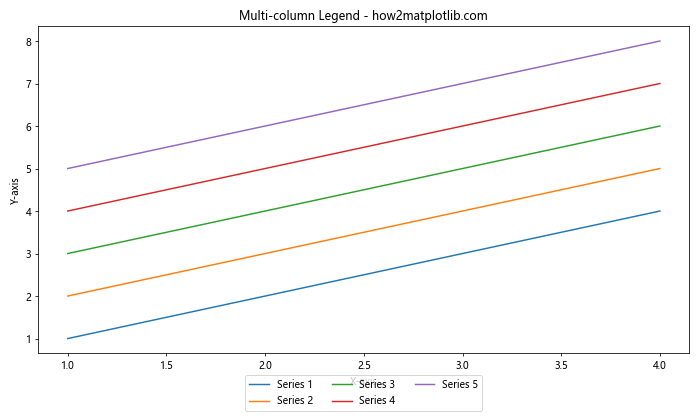
在这个例子中,我们使用ncol参数将图例排列成3列。bbox_to_anchor参数用于微调图例的位置,这里我们将图例放在图表下方。
5. 图例中的标记和线条
有时,您可能想要在图例中显示与实际数据相同的标记和线条样式。
import matplotlib.pyplot as plt

plt.figure(figsize=(8, 6))
plt.plot([1, 2, 3, 4], [1, 4, 2, 3], 'ro-', label='Red circles')
plt.plot([1, 2, 3, 4], [2, 3, 4, 1], 'bs--', label='Blue squares')
plt.title('Legend with Markers and Lines - how2matplotlib.com')
plt.xlabel('X-axis')
plt.ylabel('Y-axis')
plt.legend()
plt.show()
Output:
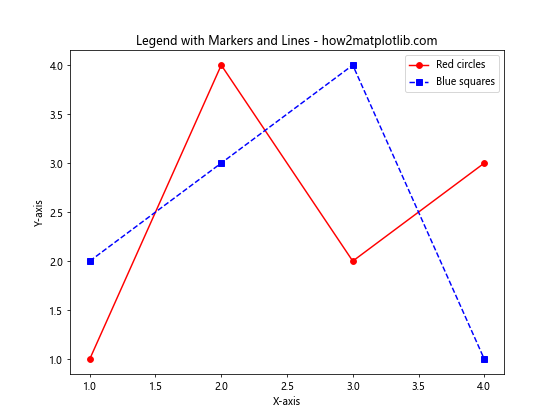
在这个例子中,我们使用了不同的标记和线条样式。图例会自动反映这些样式。
6. 自定义图例标签
有时,您可能想要使用与label参数不同的文本作为图例标签。
import matplotlib.pyplot as plt

plt.figure(figsize=(8, 6))
line1, = plt.plot([1, 2, 3, 4], [1, 4, 2, 3], label='Original label 1')
line2, = plt.plot([1, 2, 3, 4], [2, 3, 4, 1], label='Original label 2')
plt.title('Custom Legend Labels - how2matplotlib.com')
plt.xlabel('X-axis')
plt.ylabel('Y-axis')
plt.legend([line1, line2], ['Custom label 1', 'Custom label 2'])
plt.show()
Output:
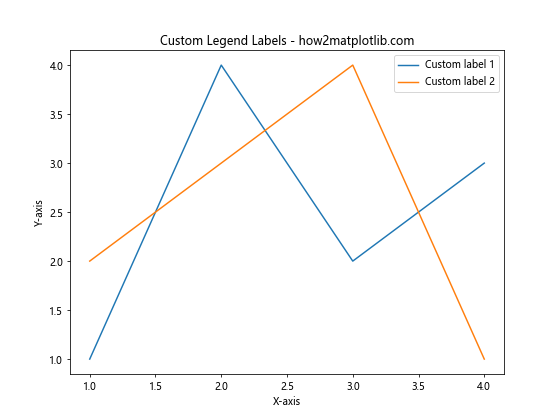
在这个例子中,我们在legend()方法中明确指定了要包含在图例中的线条对象和相应的自定义标签。
7. 图例中的数学表达式
Matplotlib支持在图例标签中使用LaTeX风格的数学表达式。
import matplotlib.pyplot as plt

plt.figure(figsize=(8, 6))
plt.plot([1, 2, 3, 4], [1, 4, 9, 16], label='y = x^2')
plt.plot([1, 2, 3, 4], [1, 8, 27, 64], label='y = x^3')
plt.title('Math Expressions in Legend - how2matplotlib.com')
plt.xlabel('X-axis')
plt.ylabel('Y-axis')
plt.legend()
plt.show()
Output:
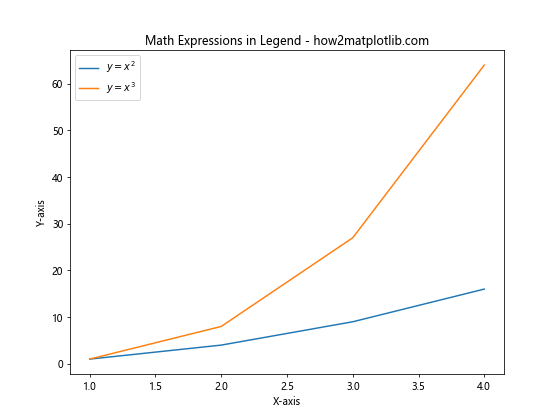
在这个例子中,我们在图例标签中使用了数学表达式来表示函数关系。
8. 图例的字体和文本样式
您可以自定义图例中文本的字体、大小和样式。
import matplotlib.pyplot as plt

plt.figure(figsize=(8, 6))
plt.plot([1, 2, 3, 4], [1, 4, 2, 3], label='Data A')
plt.plot([1, 2, 3, 4], [2, 3, 4, 1], label='Data B')
plt.title('Customized Legend Font - how2matplotlib.com')
plt.xlabel('X-axis')
plt.ylabel('Y-axis')
plt.legend(prop={'family': 'serif', 'size': 12, 'weight': 'bold', 'style': 'italic'})
plt.show()
Output:
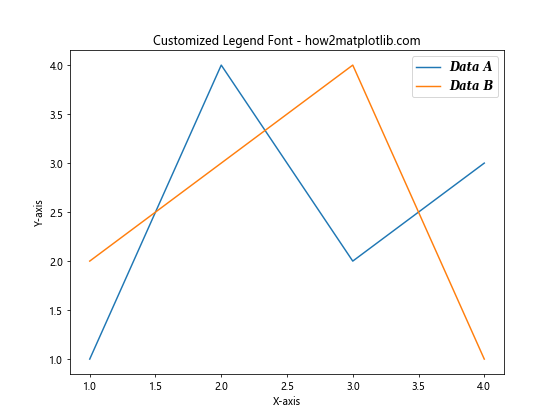
在这个例子中,我们使用prop参数来设置图例文本的字体系列、大小、粗细和样式。
9. 移除图例框
有时,您可能想要一个没有边框的”浮动”图例。
import matplotlib.pyplot as plt

plt.figure(figsize=(8, 6))
plt.plot([1, 2, 3, 4], [1, 4, 2, 3], label='Line A')
plt.plot([1, 2, 3, 4], [2, 3, 4, 1], label='Line B')
plt.title('Legend without Frame - how2matplotlib.com')
plt.xlabel('X-axis')
plt.ylabel('Y-axis')
plt.legend(frameon=False)
plt.show()
Output:
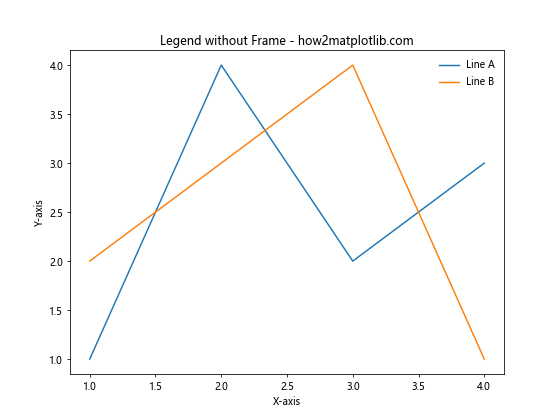
在这个例子中,我们使用frameon=False参数来移除图例的边框。
10. 图例中的阴影效果
为图例添加阴影可以增加视觉深度。
import matplotlib.pyplot as plt

plt.figure(figsize=(8, 6))
plt.plot([1, 2, 3, 4], [1, 4, 2, 3], label='Data 1')
plt.plot([1, 2, 3, 4], [2, 3, 4, 1], label='Data 2')
plt.title('Legend with Shadow - how2matplotlib.com')
plt.xlabel('X-axis')
plt.ylabel('Y-axis')
plt.legend(shadow=True)
plt.show()
Output:
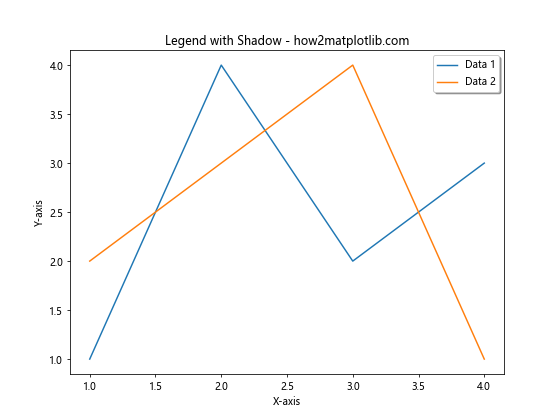
在这个例子中,我们使用shadow=True参数为图例添加阴影效果。
11. 图例中的透明度
您可以调整图例的透明度以避免遮挡重要的数据点。
import matplotlib.pyplot as plt
import numpy as np

plt.figure(figsize=(8, 6))
x = np.linspace(0, 10, 100)
plt.plot(x, np.sin(x), label='sin(x)')
plt.plot(x, np.cos(x), label='cos(x)')
plt.title('Legend with Transparency - how2matplotlib.com')
plt.xlabel('X-axis')
plt.ylabel('Y-axis')
plt.legend(framealpha=0.5)
plt.show()
Output:
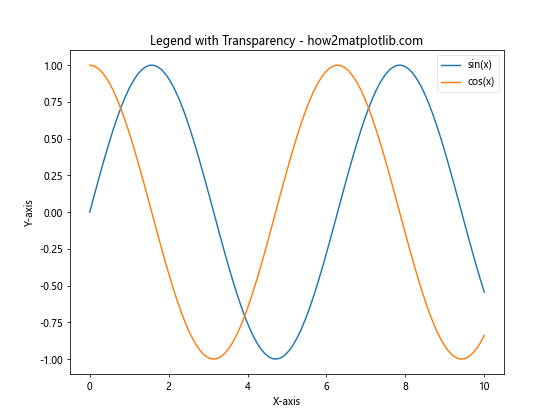
在这个例子中,我们使用framealpha参数来设置图例背景的透明度。
12. 图例的分组
当您有多个相关的数据系列时,可以将它们分组在图例中。
import matplotlib.pyplot as plt

fig, ax = plt.subplots(figsize=(10, 6))

line1, = ax.plot([1, 2, 3], [1, 2, 3], 'ro-', label='Type A')
line2, = ax.plot([1, 2, 3], [2, 3, 4], 'bo-', label='Type B')
line3, = ax.plot([1, 2, 3], [3, 4, 5], 'go-', label='Type C')
line4, = ax.plot([1, 2, 3], [4, 5, 6], 'mo-', label='Type D')

first_legend = ax.legend(handles=[line1, line2], loc='upper left', title='Group 1')
ax.add_artist(first_legend)
ax.legend(handles=[line3, line4], loc='lower right', title='Group 2')

plt.title('Grouped Legend - how2matplotlib.com')
plt.xlabel('X-axis')
plt.ylabel('Y-axis')
plt.show()
Output:
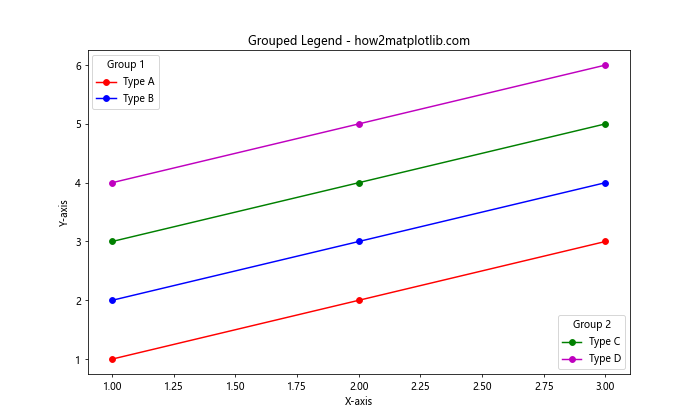
在这个例子中,我们创建了两个独立的图例,每个图例包含不同的数据系列组。
13. 图例中的颜色条
对于颜色映射的图,您可能想在图例中包含一个颜色条。
import matplotlib.pyplot as plt
import numpy as np

plt.figure(figsize=(10, 6))
x = np.linspace(0, 10, 200)
y = np.linspace(0, 10, 200)
X, Y = np.meshgrid(x, y)
Z = np.sin(X) * np.cos(Y)

plt.contourf(X, Y, Z, cmap='viridis')
plt.colorbar(label='Z value')

plt.title('Legend with Colorbar - how2matplotlib.com')
plt.xlabel('X-axis')
plt.ylabel('Y-axis')
plt.show()
Output:
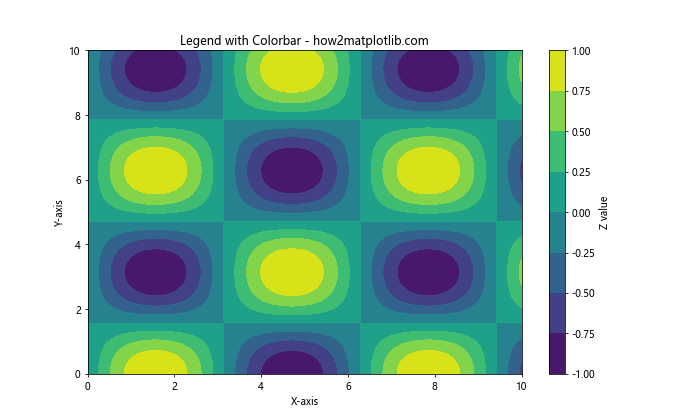
在这个例子中,我们创建了一个等高线图,并使用colorbar()方法添加了一个颜色条作为图例。
14. 自定义图例顺序
有时,您可能想要自定义图例中项目的顺序。
import matplotlib.pyplot as plt

plt.figure(figsize=(8, 6))
line1, = plt.plot([1, 2, 3, 4], [1, 4, 2, 3], label='Line C')
line2, = plt.plot([1, 2, 3, 4], [2, 3, 4, 1], label='Line A')
line3, = plt.plot([1, 2, 3, 4], [3, 2, 1, 4], label='Line B')

plt.title('Custom Legend Order - how2matplotlib.com')
plt.xlabel('X-axis')
plt.ylabel('Y-axis')
plt.legend([line2, line3, line1])
plt.show()
在这个例子中,我们通过在legend()方法中明确指定线条对象的顺序来自定义图例的顺序。
15. 图例中的标记大小
您可以调整图例中标记的大小,使其与实际数据点的大小不同。
import matplotlib.pyplot as plt

plt.figure(figsize=(8, 6))
plt.scatter([1, 2, 3, 4], [1, 4, 2, 3], s=100, label='Data points')
plt.title('Legend with Custom Marker Size - how2matplotlib.com')
plt.xlabel('X-axis')
plt.ylabel('Y-axis')
plt.legend(markerscale=0.5)
plt.show()
Output:
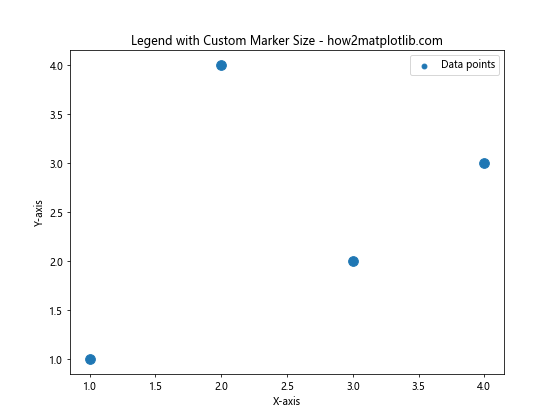
在这个例子中,我们使用markerscale参数来调整图例中标记的大小。这里我们将图例中的标记缩小到实际数据点大小的一半。## 16. 图例中的多行标签
有时,您可能需要在图例中使用多行标签来提供更详细的信息。
import matplotlib.pyplot as plt

plt.figure(figsize=(10, 6))
plt.plot([1, 2, 3, 4], [1, 4, 2, 3], label='Line 1\n(Dataset A)')
plt.plot([1, 2, 3, 4], [2, 3, 4, 1], label='Line 2\n(Dataset B)')
plt.title('Multi-line Legend Labels - how2matplotlib.com')
plt.xlabel('X-axis')
plt.ylabel('Y-axis')
plt.legend()
plt.show()
Output:
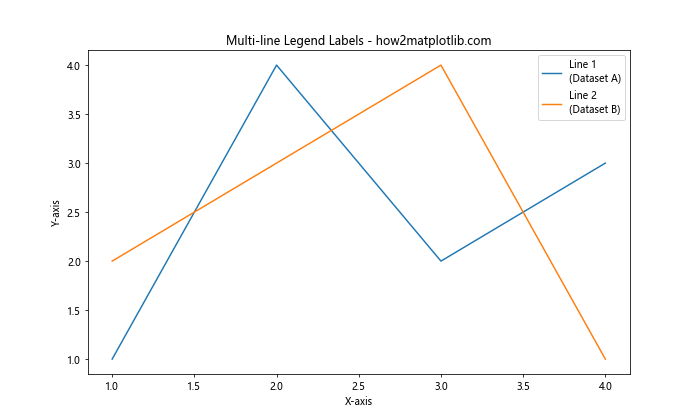
在这个例子中,我们在标签中使用\n来创建多行标签。这可以用来在图例中提供更多的上下文信息。
17. 图例中的自定义图标
Matplotlib允许您在图例中使用自定义图标,而不仅仅是默认的线条和标记。
import matplotlib.pyplot as plt
from matplotlib.patches import Circle, Rectangle

fig, ax = plt.subplots(figsize=(8, 6))

ax.plot([1, 2, 3], [1, 2, 3])

circle = Circle((0.5, 0.5), 0.1, facecolor="red")
square = Rectangle((0.4, 0.4), 0.2, 0.2, facecolor="green")

ax.legend([circle, square], ["Circle", "Square"])

plt.title('Legend with Custom Icons - how2matplotlib.com')
plt.xlabel('X-axis')
plt.ylabel('Y-axis')
plt.show()
Output:
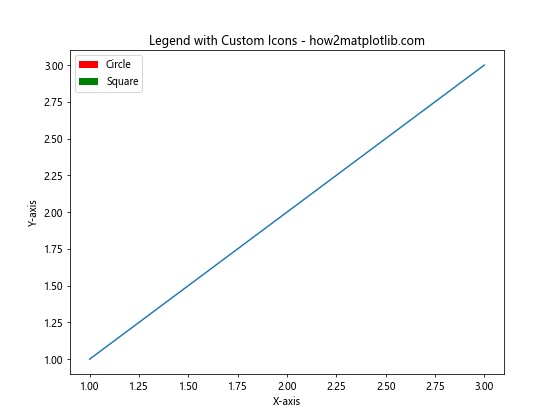
在这个例子中,我们创建了自定义的圆形和方形图标,并将它们用作图例中的项目。
18. 图例的动态更新
在交互式环境中,您可能需要动态更新图例。
import matplotlib.pyplot as plt
import numpy as np

plt.figure(figsize=(8, 6))
x = np.linspace(0, 10, 100)
line, = plt.plot(x, np.sin(x), label='sin(x)')
plt.title('Dynamic Legend Update - how2matplotlib.com')
plt.xlabel('X-axis')
plt.ylabel('Y-axis')

legend = plt.legend()

for i in range(5):
    line.set_ydata(np.sin(x + i))
    legend.get_texts()[0].set_text(f'sin(x + {i})')
    plt.pause(1)

plt.show()
Output:

这个例子展示了如何在循环中更新图例文本。在实际应用中,这可以用于实时数据可视化。
19. 图例中的复杂布局
对于复杂的图表,您可能需要更灵活的图例布局。
import matplotlib.pyplot as plt
import numpy as np

fig, (ax1, ax2) = plt.subplots(2, 1, figsize=(8, 10))

x = np.linspace(0, 10, 100)
ax1.plot(x, np.sin(x), label='sin(x)')
ax1.plot(x, np.cos(x), label='cos(x)')
ax1.set_title('Upper Plot - how2matplotlib.com')
ax1.legend(loc='upper right')

ax2.plot(x, np.exp(x), label='exp(x)')
ax2.plot(x, np.log(x), label='log(x)')
ax2.set_title('Lower Plot - how2matplotlib.com')
ax2.legend(loc='lower right')

plt.tight_layout()
plt.show()
Output:

在这个例子中,我们创建了两个子图,每个子图都有自己的图例,位置也各不相同。
20. 图例中的自定义处理程序
有时,您可能需要完全自定义图例中的图形表示。
import matplotlib.pyplot as plt
import matplotlib.patches as mpatches

class CustomLegendHandler:
    def legend_artist(self, legend, orig_handle, fontsize, handlebox):
        x0, y0 = handlebox.xdescent, handlebox.ydescent
        width, height = handlebox.width, handlebox.height
        patch = mpatches.Rectangle([x0, y0], width, height, facecolor='red',
                                   edgecolor='black', hatch='///', transform=handlebox.get_transform())
        handlebox.add_artist(patch)
        return patch

plt.figure(figsize=(8, 6))
plt.plot([1, 2, 3], [1, 2, 3], label='Custom')
plt.title('Legend with Custom Handler - how2matplotlib.com')
plt.xlabel('X-axis')
plt.ylabel('Y-axis')
plt.legend(handler_map={str: CustomLegendHandler()})
plt.show()
Output:
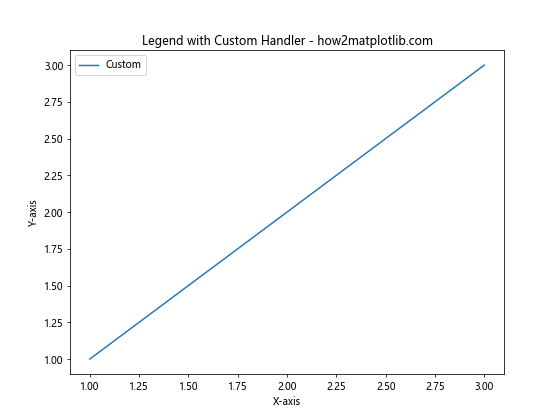
在这个例子中,我们创建了一个自定义的图例处理程序,它为图例项目绘制了一个带有斜线填充的矩形。
结论
Matplotlib的图例功能非常强大和灵活,可以满足各种数据可视化需求。从基本的图例创建到高级的自定义,本文涵盖了广泛的图例使用技巧。通过合理使用图例,您可以大大提高图表的可读性和信息传达效率。
记住,好的图例应该清晰、简洁,并且与图表的整体设计协调一致。在实际应用中,您可能需要结合多种技巧来创建最适合您数据和受众的图例。
随着您对Matplotlib的深入了解,您会发现还有更多的图例自定义选项可供探索。不断实践和尝试新的方法,将帮助您掌握创建引人注目且信息丰富的数据可视化的艺术。
最后,请记住图例只是数据可视化中的一个元素。它应该与其他元素(如标题、轴标签、数据点等)和谐共存,共同讲述数据背后的故事。通过精心设计和适当使用图例,您可以使您的图表不仅美观,而且富有洞察力和说服力。
 极客教程
极客教程