如何在matplotlib中设置legend的背景色
参考:matplotlib legend facecolor
在matplotlib中,legend是用来标识图中各个元素的标签。我们可以通过设置legend的facecolor属性来改变标签的背景色。下面我们就来详细介绍如何在matplotlib中设置legend的背景色。
设置legend的背景色
要设置legend的背景色,我们可以使用legend函数的facecolor参数。这个参数用来指定legend的背景色。下面是一个简单的示例代码:
import matplotlib.pyplot as plt

x = [1, 2, 3, 4, 5]
y = [2, 3, 5, 7, 6]

plt.plot(x, y, label='Line')
plt.legend(facecolor='lightblue')
plt.show()
Output:
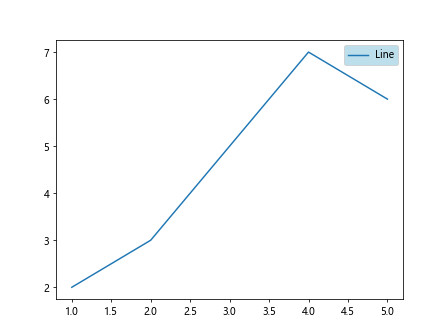
在这个示例中,我们使用plt.plot函数绘制了一条线,并给这条线加上了legend。通过设置plt.legend(facecolor='lightblue'),我们将legend的背景色设置为浅蓝色。
自定义legend的背景色
除了直接在legend函数中设置facecolor参数外,我们还可以通过set_facecolor方法来自定义legend的背景色。下面是一个示例代码:
import matplotlib.pyplot as plt

x = [1, 2, 3, 4, 5]
y = [2, 3, 5, 7, 6]

plt.plot(x, y, label='Line')
legend = plt.legend()
legend.get_frame().set_facecolor('lightgreen')
plt.show()
Output:
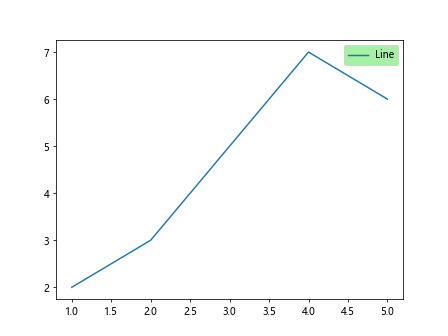
在这个示例中,我们首先创建了一个legend对象,然后通过legend.get_frame().set_facecolor方法来设置legend的背景色为浅绿色。
设置legend文本颜色
除了设置legend的背景色外,我们还可以设置legend文本的颜色。legend函数的textcolor参数用来指定文本的颜色。下面是一个示例代码:
import matplotlib.pyplot as plt

x = [1, 2, 3, 4, 5]
y = [2, 3, 5, 7, 6]

plt.plot(x, y, label='Line')
plt.legend(facecolor='lightblue', textcolor='red')
plt.show()
在这个示例中,我们设置了legend的背景色为浅蓝色,并设置了文本颜色为红色。
改变legend的边框样式
除了改变legend的背景色和文本颜色外,我们还可以改变legend的边框样式。legend函数的frameon参数用来控制是否显示边框,framealpha参数用来设置边框的透明度。下面是一个示例代码:
import matplotlib.pyplot as plt

x = [1, 2, 3, 4, 5]
y = [2, 3, 5, 7, 6]

plt.plot(x, y, label='Line')
plt.legend(facecolor='lightblue', frameon=False)
plt.show()
Output:
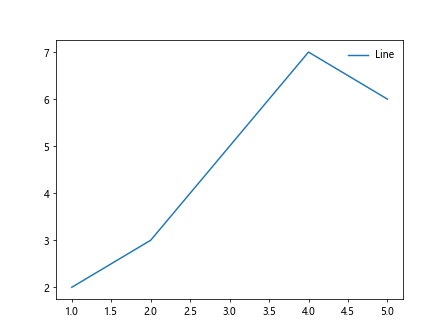
在这个示例中,我们设置了frameon=False来隐藏legend的边框。
使用边框样式设置legend背景色
有时候我们可能需要在legend中同时设置背景色和边框样式。我们可以通过facecolor和frame参数来实现。下面是一个示例代码:
import matplotlib.pyplot as plt

x = [1, 2, 3, 4, 5]
y = [2, 3, 5, 7, 6]

plt.plot(x, y, label='Line')
plt.legend(facecolor='lightblue', frameon=True, framealpha=0.8, edgecolor='red')
plt.show()
Output:
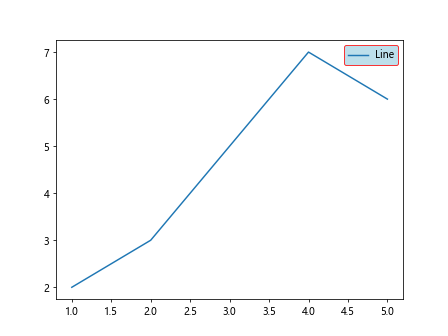
在这个示例中,我们设置了legend的背景色为浅蓝色,边框的透明度为0.8,边框颜色为红色。
设置legend的阴影
除了设置背景色和边框样式外,我们还可以为legend添加阴影。legend函数的shadow参数用来控制是否显示阴影。下面是一个示例代码:
import matplotlib.pyplot as plt

x = [1, 2, 3, 4, 5]
y = [2, 3, 5, 7, 6]

plt.plot(x, y, label='Line')
plt.legend(facecolor='lightblue', shadow=True)
plt.show()
Output:
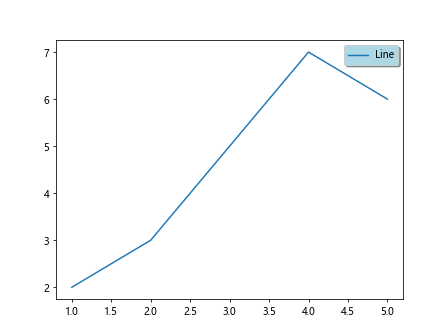
在这个示例中,我们设置了shadow=True来为legend添加阴影效果。
使用字典设置legend的属性
除了直接在legend函数中设置各种属性外,我们还可以使用一个字典来设置legend的属性。下面是一个示例代码:
import matplotlib.pyplot as plt

x = [1, 2, 3, 4, 5]
y = [2, 3, 5, 7, 6]

plt.plot(x, y, label='Line')
plt.legend(facecolor='lightblue', shadow=True, prop={'size': 12, 'weight': 'bold'})
plt.show()
Output:
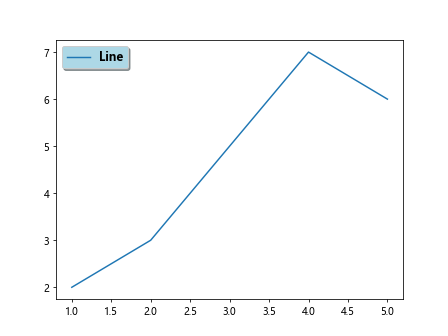
在这个示例中,我们通过prop={'size': 12, 'weight': 'bold'}来设置legend中文本的大小和粗细。
调整legend的位置
除了修改legend的样式外,有时候我们还需要调整legend的位置。legend函数的loc参数可以用来设置legend的位置。下面是一些常用的loc参数:
- ‘best’: 自动选择最佳位置
- ‘upper right’: 右上角
- ‘upper left’: 左上角
- ‘lower right’: 右下角
- ‘lower left’: 左下角
下面是一个示例代码:
import matplotlib.pyplot as plt

x = [1, 2, 3, 4, 5]
y = [2, 3, 5, 7, 6]

plt.plot(x, y, label='Line')
plt.legend(facecolor='lightblue', loc='upper left')
plt.show()
Output:
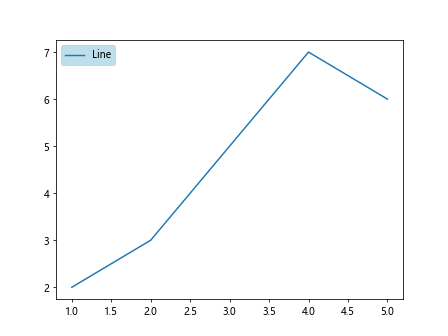
在这个示例中,我们将legend的位置设置为左上角。
结语
通过本文的介绍,你已经学会了如何在matplotlib中设置legend的背景色,文本颜色,边框样式,阴影效果,属性等。这些技巧可以帮助你更好地定制图表,让你的数据更有说服力。
 极客教程
极客教程