Matplotlib中的套索选择器小部件:交互式数据选择利器
参考:Matplotlib Lasso Selector Widget
Matplotlib是Python中最流行的数据可视化库之一,它不仅提供了丰富的静态绘图功能,还支持各种交互式操作。其中,套索选择器(Lasso Selector)小部件是一个强大的交互式工具,允许用户在图表上自由绘制不规则形状来选择数据点。本文将深入探讨Matplotlib中的套索选择器小部件,介绍其使用方法、应用场景以及高级技巧。
1. 套索选择器简介
套索选择器是Matplotlib中的一个交互式小部件,它允许用户在图表上通过鼠标绘制一个闭合的不规则形状(套索),以选择落在该形状内的数据点。这个工具特别适用于需要从复杂散点图或其他类型的图表中选择特定区域数据的场景。
以下是一个简单的示例,展示了如何在散点图上使用套索选择器:
import numpy as np
import matplotlib.pyplot as plt
from matplotlib.widgets import LassoSelector
from matplotlib.path import Path

class SelectFromCollection:
    def __init__(self, ax, collection, alpha_other=0.3):
        self.canvas = ax.figure.canvas
        self.collection = collection
        self.alpha_other = alpha_other

        self.xys = collection.get_offsets()
        self.Npts = len(self.xys)

        self.fc = collection.get_facecolors()
        if len(self.fc) == 0:
            raise ValueError('Collection must have a facecolor')
        elif len(self.fc) == 1:
            self.fc = np.tile(self.fc, (self.Npts, 1))

        self.lasso = LassoSelector(ax, onselect=self.onselect)
        self.ind = []

    def onselect(self, verts):
        path = Path(verts)
        self.ind = np.nonzero(path.contains_points(self.xys))[0]
        self.fc[:, -1] = self.alpha_other
        self.fc[self.ind, -1] = 1
        self.collection.set_facecolors(self.fc)
        self.canvas.draw_idle()

    def disconnect(self):
        self.lasso.disconnect_events()
        self.fc[:, -1] = 1
        self.collection.set_facecolors(self.fc)
        self.canvas.draw_idle()

fig, ax = plt.subplots()
pts = ax.scatter(np.random.rand(100), np.random.rand(100), s=80)
selector = SelectFromCollection(ax, pts)

ax.set_title("How2matplotlib.com - Lasso Selector Example")
plt.show()
Output:
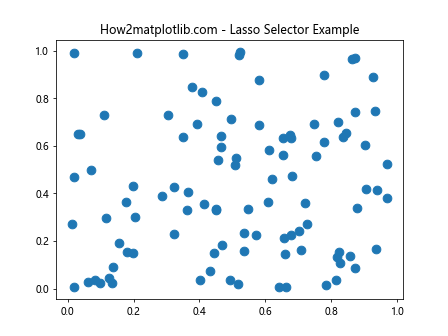
在这个示例中,我们创建了一个散点图,并为其添加了套索选择器功能。用户可以在图表上绘制一个闭合的形状来选择点,被选中的点会变为不透明,而未选中的点会变为半透明。
2. 套索选择器的工作原理
套索选择器的工作原理相对简单:
- 用户在图表上按住鼠标左键并拖动,绘制一个闭合的不规则形状。
- 释放鼠标按键后,Matplotlib会计算哪些数据点落在这个形状内。
- 根据选择结果,可以对选中的数据点进行特定的操作,如改变颜色、提取数据等。
以下是一个更详细的示例,展示了套索选择器的工作原理:
import numpy as np
import matplotlib.pyplot as plt
from matplotlib.widgets import LassoSelector
from matplotlib.path import Path

def onselect(verts):
    path = Path(verts)
    ind = np.nonzero(path.contains_points(points))[0]
    selected_points.set_offsets(points[ind])
    fig.canvas.draw_idle()

# Generate random points
np.random.seed(42)
points = np.random.rand(1000, 2)

fig, ax = plt.subplots()
scatter = ax.scatter(points[:, 0], points[:, 1], s=20, c='blue', alpha=0.5)
selected_points = ax.scatter([], [], s=20, c='red')

lasso = LassoSelector(ax, onselect)

ax.set_title("How2matplotlib.com - Lasso Selector Mechanism")
plt.show()
Output:
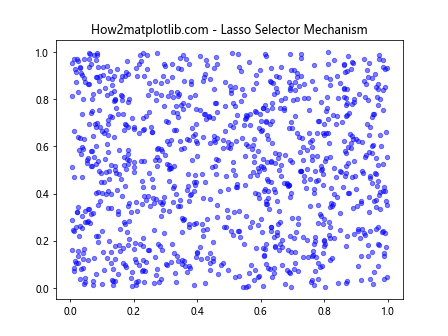
在这个示例中,我们生成了1000个随机点,并使用套索选择器来选择其中的一部分。选中的点会以红色显示,而未选中的点保持蓝色。这个例子清楚地展示了套索选择器的工作机制。
3. 套索选择器的应用场景
套索选择器在数据分析和可视化中有广泛的应用,以下是一些常见的场景:
3.1 数据清洗
在数据清洗过程中,套索选择器可以帮助识别和选择异常值或离群点。例如:
import numpy as np
import matplotlib.pyplot as plt
from matplotlib.widgets import LassoSelector
from matplotlib.path import Path

class DataCleaner:
    def __init__(self, ax, scatter):
        self.ax = ax
        self.scatter = scatter
        self.xys = scatter.get_offsets()
        self.lasso = LassoSelector(ax, onselect=self.onselect)

    def onselect(self, verts):
        path = Path(verts)
        ind = np.nonzero(path.contains_points(self.xys))[0]
        self.xys = np.delete(self.xys, ind, axis=0)
        self.scatter.set_offsets(self.xys)
        self.ax.figure.canvas.draw_idle()

# Generate data with outliers
np.random.seed(42)
x = np.random.normal(0, 1, 1000)
y = np.random.normal(0, 1, 1000)
x = np.concatenate([x, np.random.uniform(-5, 5, 50)])
y = np.concatenate([y, np.random.uniform(-5, 5, 50)])

fig, ax = plt.subplots()
scatter = ax.scatter(x, y, s=20, c='blue', alpha=0.5)

cleaner = DataCleaner(ax, scatter)

ax.set_title("How2matplotlib.com - Data Cleaning with Lasso Selector")
plt.show()
Output:
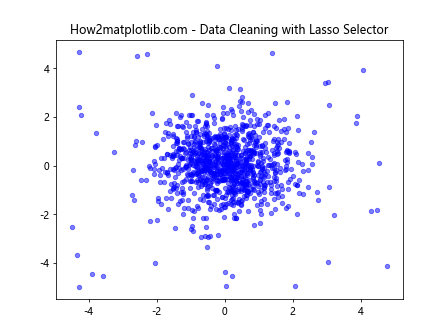
在这个示例中,我们生成了一些包含离群点的数据。用户可以使用套索选择器来选择并删除这些离群点,从而实现数据清洗的目的。
3.2 特征选择
在机器学习中,套索选择器可以用于交互式特征选择。例如:
import numpy as np
import matplotlib.pyplot as plt
from matplotlib.widgets import LassoSelector
from matplotlib.path import Path
from sklearn.datasets import make_classification

class FeatureSelector:
    def __init__(self, ax, scatter, features, labels):
        self.ax = ax
        self.scatter = scatter
        self.features = features
        self.labels = labels
        self.xys = scatter.get_offsets()
        self.lasso = LassoSelector(ax, onselect=self.onselect)
        self.selected_features = []

    def onselect(self, verts):
        path = Path(verts)
        ind = np.nonzero(path.contains_points(self.xys))[0]
        self.selected_features = ind
        print(f"Selected features: {self.selected_features}")

# Generate synthetic dataset
X, y = make_classification(n_samples=1000, n_features=20, n_informative=2, n_redundant=2, n_repeated=0, n_classes=2, random_state=42)

fig, ax = plt.subplots()
scatter = ax.scatter(X[:, 0], X[:, 1], c=y, cmap='viridis', s=20, alpha=0.5)

selector = FeatureSelector(ax, scatter, X, y)

ax.set_title("How2matplotlib.com - Feature Selection with Lasso Selector")
plt.show()
Output:
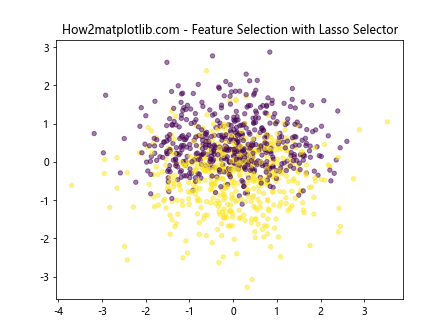
在这个示例中,我们使用scikit-learn生成了一个合成数据集,并使用套索选择器来选择特征。用户可以在散点图上选择感兴趣的区域,程序会输出所选择的特征索引。
3.3 聚类分析
套索选择器也可以用于交互式聚类分析,允许用户手动选择和分组数据点。例如:
import numpy as np
import matplotlib.pyplot as plt
from matplotlib.widgets import LassoSelector
from matplotlib.path import Path
from sklearn.datasets import make_blobs

class InteractiveClusterer:
    def __init__(self, ax, scatter):
        self.ax = ax
        self.scatter = scatter
        self.xys = scatter.get_offsets()
        self.lasso = LassoSelector(ax, onselect=self.onselect)
        self.clusters = np.zeros(len(self.xys))
        self.current_cluster = 1

    def onselect(self, verts):
        path = Path(verts)
        ind = np.nonzero(path.contains_points(self.xys))[0]
        self.clusters[ind] = self.current_cluster
        self.scatter.set_array(self.clusters)
        self.current_cluster += 1
        self.ax.figure.canvas.draw_idle()

# Generate synthetic clusters
X, _ = make_blobs(n_samples=300, centers=4, cluster_std=0.60, random_state=42)

fig, ax = plt.subplots()
scatter = ax.scatter(X[:, 0], X[:, 1], c='gray', s=20)

clusterer = InteractiveClusterer(ax, scatter)

ax.set_title("How2matplotlib.com - Interactive Clustering with Lasso Selector")
plt.show()
Output:
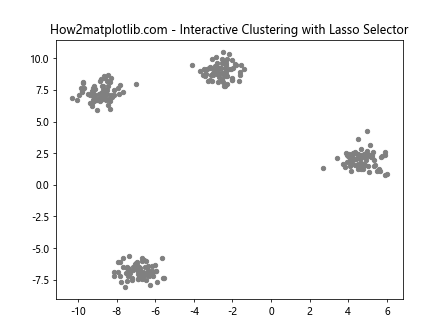
在这个示例中,我们生成了一些模拟的聚类数据,并使用套索选择器来手动定义聚类。每次使用套索选择一组点时,这些点会被赋予一个新的聚类标签,并用不同的颜色显示。
4. 套索选择器的高级技巧
4.1 多图表联动
套索选择器可以用于实现多个图表之间的联动,例如在一个散点图中选择点,同时在另一个图表中高亮显示相应的数据。
import numpy as np
import matplotlib.pyplot as plt
from matplotlib.widgets import LassoSelector
from matplotlib.path import Path

class LinkedViews:
    def __init__(self, ax1, ax2, scatter1, scatter2):
        self.ax1 = ax1
        self.ax2 = ax2
        self.scatter1 = scatter1
        self.scatter2 = scatter2
        self.xys1 = scatter1.get_offsets()
        self.xys2 = scatter2.get_offsets()
        self.lasso = LassoSelector(ax1, onselect=self.onselect)

    def onselect(self, verts):
        path = Path(verts)
        ind = np.nonzero(path.contains_points(self.xys1))[0]
        self.scatter1.set_facecolors('gray')
        self.scatter2.set_facecolors('gray')
        self.scatter1.set_facecolors('red', ind)
        self.scatter2.set_facecolors('red', ind)
        self.ax1.figure.canvas.draw_idle()
        self.ax2.figure.canvas.draw_idle()

# Generate data
np.random.seed(42)
x = np.random.rand(100)
y1 = np.sin(2 * np.pi * x)
y2 = np.cos(2 * np.pi * x)

fig, (ax1, ax2) = plt.subplots(1, 2, figsize=(12, 5))
scatter1 = ax1.scatter(x, y1, s=20)
scatter2 = ax2.scatter(x, y2, s=20)

linked_views = LinkedViews(ax1, ax2, scatter1, scatter2)

ax1.set_title("How2matplotlib.com - Linked View 1")
ax2.set_title("How2matplotlib.com - Linked View 2")
plt.show()
Output:
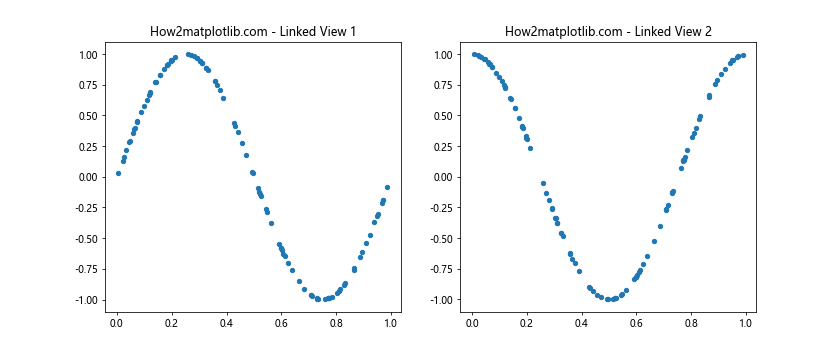
在这个示例中,我们创建了两个散点图,并使它们通过套索选择器联动。在左侧图表中选择点时,右侧图表中对应的点也会被高亮显示。
4.2 自定义选择行为
您可以自定义套索选择器的行为,例如根据选择的点执行特定的操作或更新其他图表元素。
import numpy as np
import matplotlib.pyplot as plt
from matplotlib.widgets import LassoSelector
from matplotlib.path import Path

class CustomSelector:
    def __init__(self, ax, scatter, text):
        self.ax = ax
        self.scatter = scatter
        self.text = text
        self.xys = scatter.get_offsets()
        self.lasso = LassoSelector(ax, onselect=self.onselect)
        self.selected_indices = []

    def onselect(self, verts):
        path = Path(verts)
        self.selected_indices = np.nonzero(path.contains_points(self.xys))[0]
        self.update_selection()

    def update_selection(self):
        fc = np.full(len(self.xys), 0.3)
        fc[self.selected_indices] = 1.0
        self.scatter.set_facecolors(plt.cm.viridis(fc))
        selected_points = len(self.selected_indices)
        total_points = len(self.xys)
        percentage = (selected_points / total_points) * 100
        self.text.set_text(f"Selected: {selected_points}/{total_points} ({percentage:.1f}%)")
        self.ax.figure.canvas.draw_idle()

# Generate data
np.random.seed(42)
x = np.random.rand(500)
y = np.random.rand(500)

fig, ax = plt.subplots()
scatter = ax.scatter(x, y, s=20)
text = ax.text(0.05, 0.95, "", transform=ax.transAxes, va='top')

custom_selector = CustomSelector(ax, scatter, text)

ax.set_title("How2matplotlib.com - Custom Lasso Selector Behavior")
plt.show()
Output:
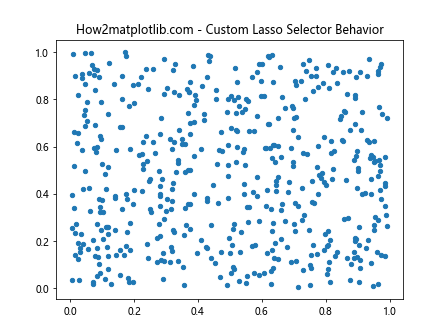
在这个示例中,我们自定义了套索选择器的行为。当用户选择点时,程序会更新选中点的颜色,并在图表上显示选中点的数量和百分比。
4.3 结合其他交互式工具
套索选择器可以与其他Matplotlib交互式工具结合使用,例如与滑块(Slider)或按钮(Button)一起使用,以提供更丰富的交互体验。
import numpy as np
import matplotlib.pyplot as plt
from matplotlib.widgets import LassoSelector, Button
from matplotlib.path import Path

class LassoSelectorWithReset:
    def __init__(self, ax, scatter):
        self.ax = ax
        self.scatter = scatter
        self.xys = scatter.get_offsets()
        self.lasso = LassoSelector(ax, onselect=self.onselect)
        self.fc = scatter.get_facecolors()
        self.original_fc = self.fc.copy()

    def onselect(self, verts):
        path = Path(verts)
        ind = np.nonzero(path.contains_points(self.xys))[0]
        self.fc[:] = (0.3, 0.3, 0.3, 1)
        self.fc[ind] = (1, 0, 0, 1)
        self.scatter.set_facecolors(self.fc)
        self.ax.figure.canvas.draw_idle()

    def reset(self, event):
        self.fc[:] = self.original_fc
        self.scatter.set_facecolors(self.fc)
        self.ax.figure.canvas.draw_idle()

# Generate data
np.random.seed(42)
x = np.random.rand(200)
y = np.random.rand(200)

fig, ax = plt.subplots()
scatter = ax.scatter(x, y, s=20, c=np.random.rand(200, 3))

selector = LassoSelectorWithReset(ax, scatter)

ax_reset = plt.axes([0.8, 0.025, 0.1, 0.04])
button_reset = Button(ax_reset, 'Reset')
button_reset.on_clicked(selector.reset)

ax.set_title("How2matplotlib.com - Lasso Selector with Reset Button")
plt.show()
Output:

在这个示例中,我们结合了套索选择器和一个重置按钮。用户可以使用套索选择器选择点,然后通过点击重置按钮恢复原始状态。
5. 套索选择器的性能优化
当处理大量数据点时,套索选择器的性能可能会受到影响。以下是一些优化建议:
5.1 使用blitting技术
Blitting是一种优化绘图性能的技术,特别适用于频繁更新的交互式图表。
import numpy as np
import matplotlib.pyplot as plt
from matplotlib.widgets import LassoSelector
from matplotlib.path import Path

class OptimizedLassoSelector:
    def __init__(self, ax, scatter):
        self.ax = ax
        self.scatter = scatter
        self.canvas = ax.figure.canvas
        self.xys = scatter.get_offsets()
        self.lasso = LassoSelector(ax, onselect=self.onselect)
        self.fc = scatter.get_facecolors()

        self.background = None
        self.canvas.mpl_connect('draw_event', self.update_background)

    def onselect(self, verts):
        path = Path(verts)
        ind = np.nonzero(path.contains_points(self.xys))[0]
        self.fc[:] = (0.3, 0.3, 0.3, 1)
        self.fc[ind] = (1, 0, 0, 1)
        self.scatter.set_facecolors(self.fc)
        self.update()

    def update_background(self, event):
        self.background = self.canvas.copy_from_bbox(self.ax.bbox)

    def update(self):
        if self.background is not None:
            self.canvas.restore_region(self.background)
            self.ax.draw_artist(self.scatter)
            self.canvas.blit(self.ax.bbox)

# Generate data
np.random.seed(42)
x = np.random.rand(5000)
y = np.random.rand(5000)

fig, ax = plt.subplots()
scatter = ax.scatter(x, y, s=5, c='blue', alpha=0.5)

selector = OptimizedLassoSelector(ax, scatter)

ax.set_title("How2matplotlib.com - Optimized Lasso Selector")
plt.show()
Output:
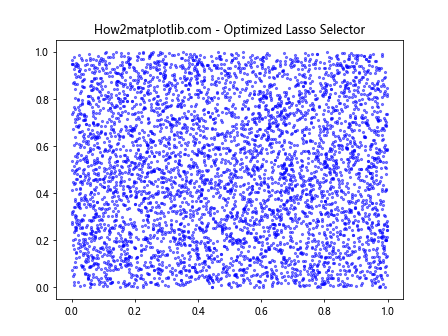
在这个示例中,我们使用了blitting技术来优化套索选择器的性能。这种方法特别适用于处理大量数据点的情况。
5.2 减少重绘频率
在处理大量数据时,可以考虑减少重绘的频率,只在必要时更新图表。
import numpy as np
import matplotlib.pyplot as plt
from matplotlib.widgets import LassoSelector
from matplotlib.path import Path

class LazyUpdateLassoSelector:
    def __init__(self, ax, scatter):
        self.ax = ax
        self.scatter = scatter
        self.xys = scatter.get_offsets()
        self.lasso = LassoSelector(ax, onselect=self.onselect)
        self.fc = scatter.get_facecolors()
        self.selected = np.zeros(len(self.xys), dtype=bool)
        self.update_pending = False

    def onselect(self, verts):
        path = Path(verts)
        new_selected = path.contains_points(self.xys)
        self.selected |= new_selected
        self.update_pending = True
        self.ax.figure.canvas.draw_idle()

    def on_draw(self, event):
        if self.update_pending:
            self.fc[:] = (0.3, 0.3, 0.3, 1)
            self.fc[self.selected] = (1, 0, 0, 1)
            self.scatter.set_facecolors(self.fc)
            self.update_pending = False

# Generate data
np.random.seed(42)
x = np.random.rand(10000)
y = np.random.rand(10000)

fig, ax = plt.subplots()
scatter = ax.scatter(x, y, s=1, c='blue', alpha=0.5)

selector = LazyUpdateLassoSelector(ax, scatter)
fig.canvas.mpl_connect('draw_event', selector.on_draw)

ax.set_title("How2matplotlib.com - Lazy Update Lasso Selector")
plt.show()
Output:
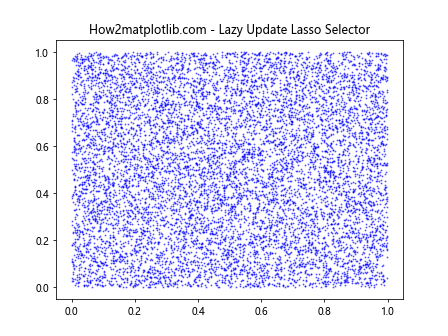
在这个示例中,我们实现了一个”懒惰更新”的套索选择器。它不会立即更新选中的点,而是在下一次重绘时才进行更新,从而减少了不必要的重绘操作。
6. 套索选择器的高级应用
6.1 3D图表中的套索选择
虽然套索选择器主要用于2D图表,但我们也可以将其应用于3D图表的投影平面上。
import numpy as np
import matplotlib.pyplot as plt
from mpl_toolkits.mplot3d import Axes3D
from matplotlib.widgets import LassoSelector
from matplotlib.path import Path

class Lasso3DSelector:
    def __init__(self, ax, scatter):
        self.ax = ax
        self.scatter = scatter
        self.lasso = LassoSelector(ax, onselect=self.onselect)
        self.xys = self.get_2d_coordinates()

    def get_2d_coordinates(self):
        x, y, _ = self.scatter._offsets3d
        return np.column_stack([x, y])

    def onselect(self, verts):
        path = Path(verts)
        ind = path.contains_points(self.xys)
        fc = np.full(len(self.xys), 0.3)
        fc[ind] = 1.0
        self.scatter.set_facecolors(plt.cm.viridis(fc))
        self.ax.figure.canvas.draw_idle()

# Generate 3D data
np.random.seed(42)
x = np.random.rand(500)
y = np.random.rand(500)
z = np.random.rand(500)

fig = plt.figure()
ax = fig.add_subplot(111, projection='3d')
scatter = ax.scatter(x, y, z, c='blue', s=20)

selector = Lasso3DSelector(ax, scatter)

ax.set_title("How2matplotlib.com - 3D Lasso Selector")
plt.show()
Output:
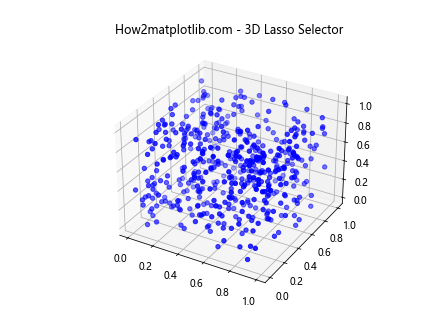
在这个示例中,我们将套索选择器应用于3D散点图的2D投影。用户可以在2D平面上进行选择,而选择结果会反映在3D图表中。
6.2 时间序列数据的套索选择
套索选择器也可以用于时间序列数据的分析,例如选择特定时间范围内的异常值。
import numpy as np
import matplotlib.pyplot as plt
from matplotlib.widgets import LassoSelector
from matplotlib.path import Path
import pandas as pd

class TimeSeriesLassoSelector:
    def __init__(self, ax, line):
        self.ax = ax
        self.line = line
        self.xys = line.get_xydata()
        self.lasso = LassoSelector(ax, onselect=self.onselect)

    def onselect(self, verts):
        path = Path(verts)
        ind = path.contains_points(self.xys)
        self.line.set_color('gray')
        selected_xys = self.xys[ind]
        self.ax.plot(selected_xys[:, 0], selected_xys[:, 1], 'ro', markersize=4)
        self.ax.figure.canvas.draw_idle()

# Generate time series data
np.random.seed(42)
dates = pd.date_range(start='2023-01-01', end='2023-12-31', freq='D')
values = np.cumsum(np.random.randn(len(dates))) + 100
df = pd.DataFrame({'date': dates, 'value': values})

fig, ax = plt.subplots(figsize=(12, 6))
line, = ax.plot(df['date'], df['value'])

selector = TimeSeriesLassoSelector(ax, line)

ax.set_title("How2matplotlib.com - Time Series Lasso Selector")
plt.show()
Output:
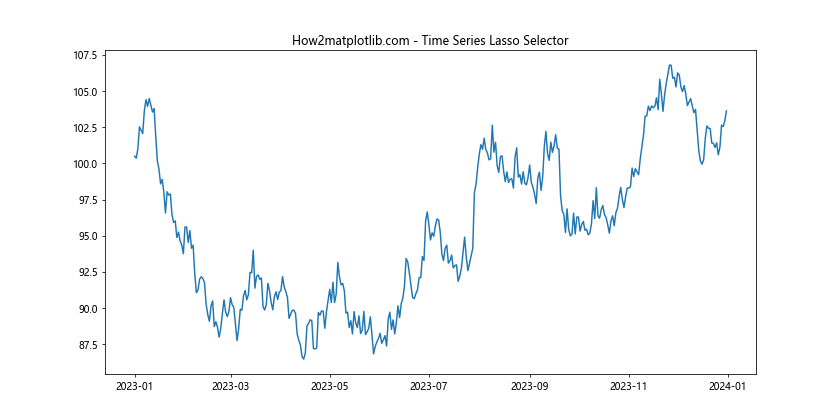
在这个示例中,我们创建了一个时间序列数据的线图,并使用套索选择器来选择特定时间范围内的数据点。选中的点会以红色标记显示。
7. 结论
Matplotlib的套索选择器小部件是一个强大而灵活的工具,可以大大增强数据可视化的交互性。通过本文的详细介绍和丰富的示例,我们展示了套索选择器在各种场景下的应用,从基本的数据选择到高级的交互式分析。无论是进行数据清洗、特征选择、聚类分析,还是处理复杂的多维数据,套索选择器都能提供直观和高效的解决方案。
在实际应用中,套索选择器可以与其他Matplotlib工具和功能结合使用,创造出更加丰富和强大的交互式数据可视化体验。通过优化技术,如blitting和懒惰更新,我们还可以确保在处理大规模数据集时保持良好的性能。
总的来说,掌握套索选择器的使用不仅可以提高数据分析的效率,还能为用户提供更直观、更深入的数据洞察。随着数据可视化和交互式分析在各个领域的重要性不断增加,Matplotlib的套索选择器无疑将成为数据科学家和分析师工具箱中不可或缺的一部分。
 极客教程
极客教程