Matplotlib Cursor Widget:增强数据可视化交互的强大工具
Matplotlib是Python中最流行的数据可视化库之一,而Cursor Widget是Matplotlib中一个强大的交互式工具,它能够极大地增强数据可视化的交互性和用户体验。本文将深入探讨Matplotlib Cursor Widget的使用方法、功能特性以及实际应用场景,帮助读者充分利用这一工具来提升数据分析和可视化的效果。
1. Cursor Widget 简介
Cursor Widget是Matplotlib库中的一个交互式组件,它允许用户在图表上移动鼠标时实时显示坐标信息。这个功能对于精确读取数据点、分析趋势和识别异常值非常有用。
以下是一个简单的Cursor Widget示例:
import matplotlib.pyplot as plt
from matplotlib.widgets import Cursor

fig, ax = plt.subplots(figsize=(8, 6))
ax.set_title("Cursor Widget Demo - how2matplotlib.com")
ax.plot([1, 2, 3, 4], [10, 20, 25, 30], label='Data')
ax.set_xlabel('X-axis')
ax.set_ylabel('Y-axis')
ax.legend()

cursor = Cursor(ax, useblit=True, color='red', linewidth=1)

plt.show()
Output:
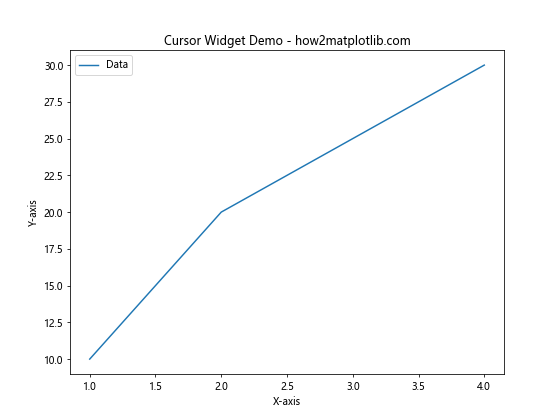
在这个示例中,我们创建了一个简单的线图,并添加了一个红色的Cursor Widget。当用户移动鼠标时,十字光标会跟随鼠标移动,帮助用户精确定位数据点。
2. Cursor Widget 的基本配置
Cursor Widget提供了多种配置选项,允许用户自定义其外观和行为。以下是一些常用的配置参数:
useblit:布尔值,启用或禁用blitting(一种用于提高绘图性能的技术)color:光标的颜色linewidth:光标线的宽度linestyle:光标线的样式(如实线、虚线等)horizOn:布尔值,是否显示水平线vertOn:布尔值,是否显示垂直线
让我们看一个更详细的配置示例:
import matplotlib.pyplot as plt
from matplotlib.widgets import Cursor

fig, ax = plt.subplots(figsize=(8, 6))
ax.set_title("Customized Cursor Widget - how2matplotlib.com")
ax.plot([1, 2, 3, 4], [10, 20, 25, 30], label='Data')
ax.set_xlabel('X-axis')
ax.set_ylabel('Y-axis')
ax.legend()

cursor = Cursor(ax, useblit=True, color='green', linewidth=2,
                linestyle='--', horizOn=True, vertOn=True)

plt.show()
Output:
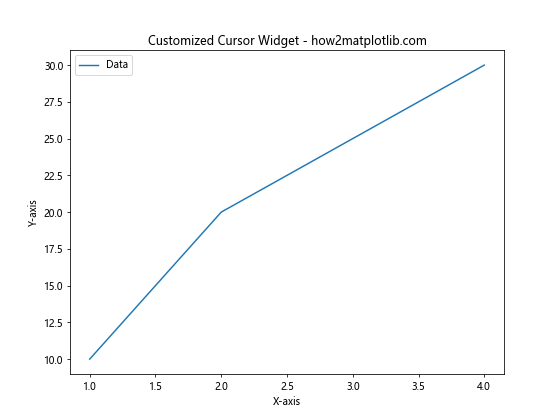
在这个示例中,我们创建了一个绿色的虚线光标,线宽为2。这种自定义配置可以帮助光标在不同背景下更加醒目。
3. 添加坐标显示功能
虽然基本的Cursor Widget已经很有用,但如果能够实时显示鼠标位置的坐标值,会更加方便。我们可以通过结合使用Cursor Widget和annotate函数来实现这一功能。
import matplotlib.pyplot as plt
from matplotlib.widgets import Cursor

fig, ax = plt.subplots(figsize=(8, 6))
ax.set_title("Cursor with Coordinates - how2matplotlib.com")
ax.plot([1, 2, 3, 4], [10, 20, 25, 30], label='Data')
ax.set_xlabel('X-axis')
ax.set_ylabel('Y-axis')
ax.legend()

cursor = Cursor(ax, useblit=True, color='red', linewidth=1)
annotation = ax.annotate("", xy=(0, 0), xytext=(20, 20), textcoords="offset points",
                         bbox=dict(boxstyle="round", fc="w"),
                         arrowprops=dict(arrowstyle="->"))
annotation.set_visible(False)

def on_mouse_move(event):
    if event.inaxes:
        x, y = event.xdata, event.ydata
        annotation.xy = (x, y)
        annotation.set_text(f"x={x:.2f}, y={y:.2f}")
        annotation.set_visible(True)
        fig.canvas.draw_idle()
    else:
        annotation.set_visible(False)
        fig.canvas.draw_idle()

fig.canvas.mpl_connect('motion_notify_event', on_mouse_move)

plt.show()
Output:
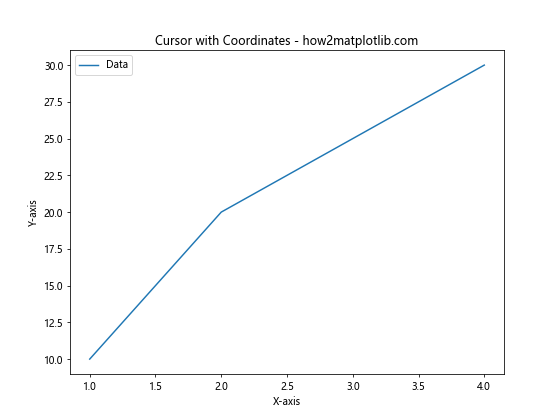
这个示例添加了一个注释框,实时显示鼠标位置的坐标。当鼠标移动到图表区域时,坐标信息会自动更新和显示。
4. 多子图中使用Cursor Widget
在复杂的数据分析中,我们经常需要在同一个图形中显示多个子图。Cursor Widget也可以应用于这种情况,让我们看一个例子:
import matplotlib.pyplot as plt
from matplotlib.widgets import Cursor

fig, (ax1, ax2) = plt.subplots(2, 1, figsize=(8, 10))
fig.suptitle("Cursor in Multiple Subplots - how2matplotlib.com")

ax1.plot([1, 2, 3, 4], [10, 20, 25, 30], label='Data 1')
ax1.set_xlabel('X-axis')
ax1.set_ylabel('Y-axis')
ax1.legend()

ax2.plot([1, 2, 3, 4], [5, 15, 10, 20], label='Data 2')
ax2.set_xlabel('X-axis')
ax2.set_ylabel('Y-axis')
ax2.legend()

cursor1 = Cursor(ax1, useblit=True, color='red', linewidth=1)
cursor2 = Cursor(ax2, useblit=True, color='blue', linewidth=1)

plt.tight_layout()
plt.show()
Output:
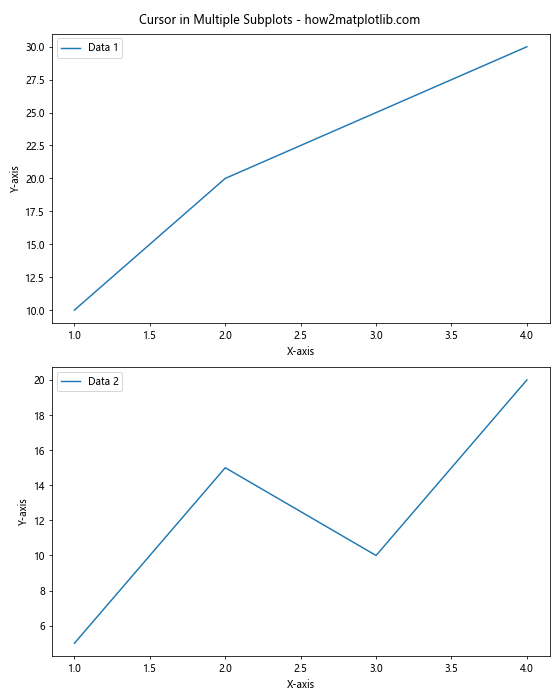
在这个示例中,我们创建了两个子图,每个子图都有自己的Cursor Widget。这样,用户可以在两个子图中独立地使用光标功能。
5. 自定义Cursor行为
有时,我们可能需要根据特定需求自定义Cursor的行为。例如,我们可以创建一个只在数据点附近显示的Cursor。以下是一个实现这种功能的示例:
import matplotlib.pyplot as plt
import numpy as np
from matplotlib.widgets import Cursor

class SnapCursor(object):
    def __init__(self, ax, x, y):
        self.ax = ax
        self.ly = ax.axvline(color='k', alpha=0.2)  # the vert line
        self.marker, = ax.plot([0],[0], marker="o", color="crimson", zorder=3)
        self.x = x
        self.y = y
        self.txt = ax.text(0.7, 0.9, '')

    def mouse_move(self, event):
        if not event.inaxes: return
        x, y = event.xdata, event.ydata
        indx = np.searchsorted(self.x, [x])[0]
        x = self.x[indx]
        y = self.y[indx]
        self.ly.set_xdata(x)
        self.marker.set_data([x],[y])
        self.txt.set_text('x=%1.2f, y=%1.2f'%(x,y))
        self.txt.set_position((x,y))
        self.ax.figure.canvas.draw_idle()

x = np.linspace(0, 10, 1000)
y = np.sin(x)

fig, ax = plt.subplots()
ax.set_title("Custom Snap Cursor - how2matplotlib.com")
ax.plot(x, y, 'b')

snap_cursor = SnapCursor(ax, x, y)
fig.canvas.mpl_connect('motion_notify_event', snap_cursor.mouse_move)

plt.show()
Output:
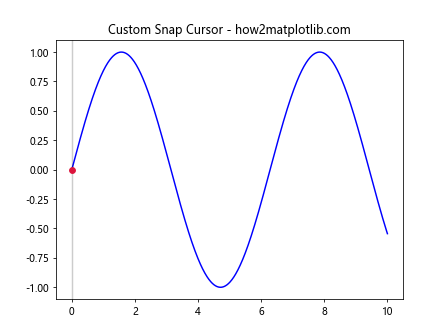
这个自定义的SnapCursor类创建了一个只在数据点上显示的光标,并在光标位置显示精确的坐标值。这对于分析离散数据点或者需要精确定位的场景非常有用。
6. 结合其他Widget使用Cursor
Cursor Widget可以与其他Matplotlib Widget结合使用,以创建更复杂的交互式可视化。例如,我们可以将Cursor与Slider Widget结合,允许用户调整数据并实时查看结果。
import matplotlib.pyplot as plt
import numpy as np
from matplotlib.widgets import Cursor, Slider

fig, ax = plt.subplots(figsize=(8, 6))
plt.subplots_adjust(bottom=0.25)

t = np.arange(0.0, 1.0, 0.001)
a0 = 5
f0 = 3
s = a0 * np.sin(2 * np.pi * f0 * t)

l, = plt.plot(t, s, lw=2)
ax.set_title("Cursor with Slider - how2matplotlib.com")
ax.set_xlabel('Time [s]')
ax.set_ylabel('Amplitude')

cursor = Cursor(ax, useblit=True, color='red', linewidth=1)

ax_freq = plt.axes([0.25, 0.1, 0.65, 0.03])
slider_freq = Slider(ax_freq, 'Frequency', 0.1, 30.0, valinit=f0)

def update(val):
    f = slider_freq.val
    l.set_ydata(a0 * np.sin(2 * np.pi * f * t))
    fig.canvas.draw_idle()

slider_freq.on_changed(update)

plt.show()
Output:
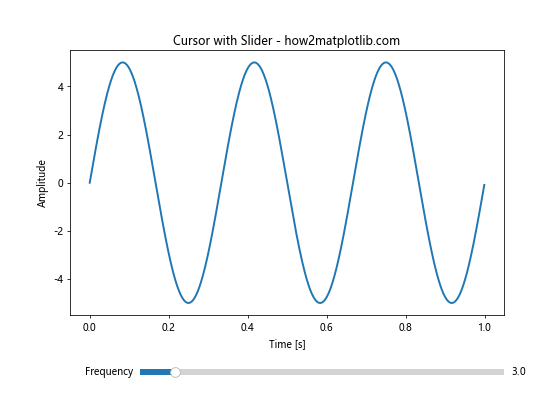
在这个示例中,用户可以使用滑块调整正弦波的频率,同时使用Cursor精确定位波形上的点。这种组合为用户提供了强大的交互式数据探索工具。
7. 在3D图中使用Cursor
虽然Cursor Widget主要用于2D图表,但我们也可以在3D图中使用类似的功能。以下是一个在3D散点图中实现类似光标功能的示例:
import matplotlib.pyplot as plt
import numpy as np
from mpl_toolkits.mplot3d import Axes3D

class Cursor3D(object):
    def __init__(self, ax, x, y, z):
        self.ax = ax
        self.x = x
        self.y = y
        self.z = z
        self.annotation = ax.text2D(0.05, 0.95, '', transform=ax.transAxes)

    def mouse_move(self, event):
        if not event.inaxes: return
        x2, y2, _ = proj3d.proj_transform(self.x, self.y, self.z, self.ax.get_proj())
        x2, y2 = self.ax.transData.inverted().transform((event.x, event.y))
        closest_index = np.argmin((x2 - self.x)**2 + (y2 - self.y)**2)
        x = self.x[closest_index]
        y = self.y[closest_index]
        z = self.z[closest_index]
        self.annotation.set_text(f'x={x:.2f}, y={y:.2f}, z={z:.2f}')
        self.ax.figure.canvas.draw_idle()

fig = plt.figure(figsize=(8, 6))
ax = fig.add_subplot(111, projection='3d')
ax.set_title("3D Cursor-like Functionality - how2matplotlib.com")

x = np.random.rand(100)
y = np.random.rand(100)
z = np.random.rand(100)
ax.scatter(x, y, z)

cursor = Cursor3D(ax, x, y, z)
fig.canvas.mpl_connect('motion_notify_event', cursor.mouse_move)

plt.show()
Output:
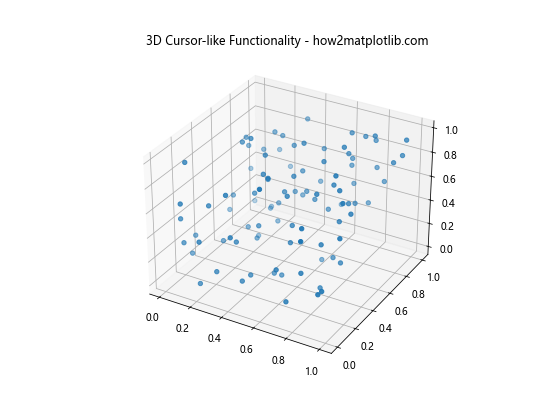
这个示例创建了一个3D散点图,并实现了一个类似光标的功能,可以显示最接近鼠标位置的数据点的坐标。
8. 在实时数据可视化中使用Cursor
Cursor Widget也可以应用于实时数据可视化场景。以下是一个简单的实时数据绘制示例,结合了Cursor功能:
import matplotlib.pyplot as plt
import numpy as np
from matplotlib.widgets import Cursor
from matplotlib.animation import FuncAnimation

fig, ax = plt.subplots(figsize=(8, 6))
ax.set_title("Real-time Data with Cursor - how2matplotlib.com")
ax.set_xlim(0, 100)
ax.set_ylim(-1, 1)
line, = ax.plot([], [])

cursor = Cursor(ax, useblit=True, color='red', linewidth=1)

x_data = []
y_data = []

def update(frame):
    x_data.append(frame)
    y_data.append(np.sin(frame * 0.1))
    line.set_data(x_data, y_data)
    ax.relim()
    ax.autoscale_view()
    return line,

ani = FuncAnimation(fig, update, frames=range(100), interval=50, blit=True)

plt.show()
Output:
在这个示例中,我们创建了一个实时更新的正弦波图表,并添加了Cursor Widget。这使得用户可以在数据实时更新的同时,精确地跟踪和分析数据点。
9. 使用Cursor进行数据选择
Cursor Widget不仅可以用于显示坐标,还可以用于数据选择。以下是一个允许用户通过点击选择数据点的示例:
import matplotlib.pyplot as plt
import numpy as np
from matplotlib.widgets import Cursor

class ClickCursor(object):
    def __init__(self, ax):
        self.ax = ax
        self.cursor = Cursor(ax, useblit=True, color='red', linewidth=1)
        self.selected_points = []
        self.scatter = ax.scatter([], [], color='red', s=100)

    def on_click(self, event):
        if event.inaxes:
            self.selected_points.append((event.xdata, event.ydata))
            x, y = zip(*self.selected_points) if self.selected_points else ([], [])
            self.scatter.set_offsets(list(zip(x, y)))
            self.ax.figure.canvas.draw_idle()

fig, ax = plt.subplots(figsize=(8, 6))
ax.set_title("Click to Select Points - how2matplotlib.com")
x = np.linspace(0, 10, 100)
y = np.sin(x)
ax.plot(x, y)

click_cursor = ClickCursor(ax)
fig.canvas.mpl_connect('button_press_event', click_cursor.on_click)

plt.show()
Output:
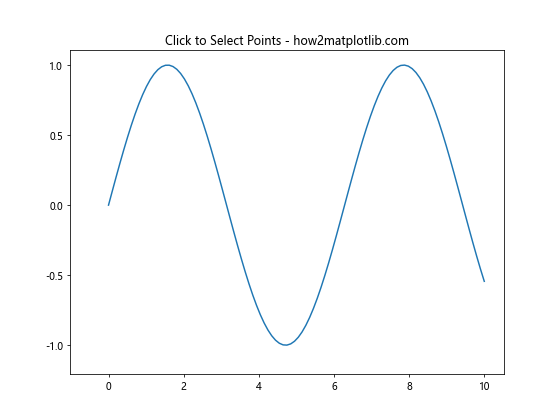
在这个示例中,用户可以点击图表上的任意位置来选择数据点。选中的点会以红色标记显示出来。这种功能在数据分析中非常有用,例如选择异常值或感兴趣的数据点。
10. 多图联动的Cursor
在某些情况下,我们可能需要在多个相关的图表之间同步Cursor的移动。以下是一个实现多图联动Cursor的示例:
import matplotlib.pyplot as plt
import numpy as np
from matplotlib.widgets import Cursor

class SyncedCursors:
    def __init__(self, fig, axes):
        self.axes = axes
        self.cursors = [Cursor(ax, useblit=True, color='red', linewidth=1) for ax in axes]
        self.annotations = [ax.text(0.7, 0.9, '', transform=ax.transAxes) for ax in axes]
        fig.canvas.mpl_connect('motion_notify_event', self.on_mouse_move)

    def on_mouse_move(self, event):
        for ax, annotation in zip(self.axes, self.annotations):
            if event.inaxes == ax:
                x, y = event.xdata, event.ydata
                annotation.set_text(f'x={x:.2f}, y={y:.2f}')
            else:
                annotation.set_text('')
        event.canvas.draw_idle()

fig, (ax1, ax2) = plt.subplots(1, 2, figsize=(12, 5))
fig.suptitle("Synced Cursors - how2matplotlib.com")

x = np.linspace(0, 10, 100)
ax1.plot(x, np.sin(x))
ax1.set_title('Sin(x)')
ax2.plot(x, np.cos(x))
ax2.set_title('Cos(x)')

synced_cursors = SyncedCursors(fig, [ax1, ax2])

plt.tight_layout()
plt.show()
Output:
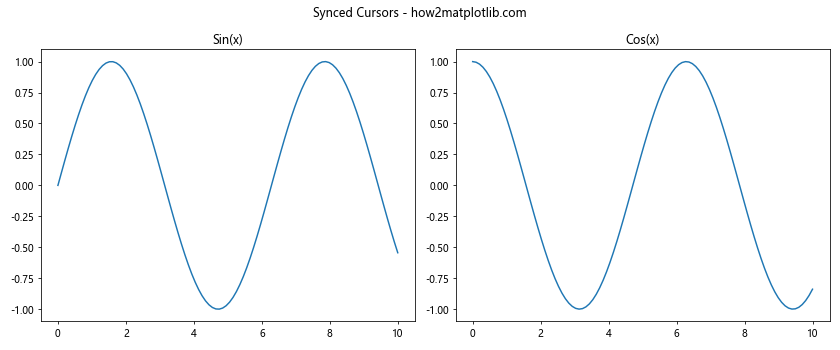
这个示例创建了两个子图,分别显示正弦和余弦函数。Cursor在两个图之间同步移动,并在当前活动的图上显示坐标信息。
11. 自定义Cursor形状
默认的Cursor是十字形的,但有时我们可能需要其他形状的Cursor。以下是一个自定义Cursor形状的示例:
import matplotlib.pyplot as plt
import numpy as np
from matplotlib.widgets import Cursor

class CustomCursor(Cursor):
    def __init__(self, ax, **kwargs):
        super().__init__(ax, **kwargs)
        self.circle = plt.Circle((0, 0), 0.1, fill=False, color='red')
        ax.add_artist(self.circle)

    def onmove(self, event):
        if event.inaxes != self.ax:
            self.circle.set_visible(False)
            return
        self.circle.set_center((event.xdata, event.ydata))
        self.circle.set_visible(True)
        super().onmove(event)

fig, ax = plt.subplots(figsize=(8, 6))
ax.set_title("Custom Circular Cursor - how2matplotlib.com")
x = np.linspace(0, 10, 100)
ax.plot(x, np.sin(x))

cursor = CustomCursor(ax, useblit=True, color='red', linewidth=1)

plt.show()
Output:
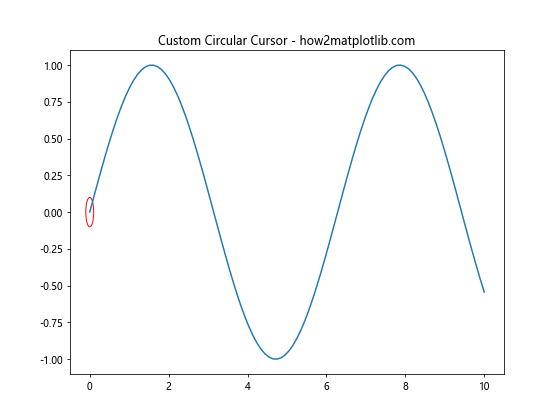
这个示例创建了一个圆形的Cursor,它会跟随鼠标移动。这种自定义Cursor可以用于强调特定区域或提供不同的视觉效果。
12. Cursor与交互式缩放的结合
Matplotlib的交互式缩放功能可以与Cursor结合使用,以提供更丰富的数据探索体验。以下是一个示例:
import matplotlib.pyplot as plt
import numpy as np
from matplotlib.widgets import Cursor

fig, ax = plt.subplots(figsize=(8, 6))
ax.set_title("Cursor with Interactive Zoom - how2matplotlib.com")
x = np.linspace(0, 10, 1000)
y = np.sin(x) * np.exp(-x/10)
ax.plot(x, y)

cursor = Cursor(ax, useblit=True, color='red', linewidth=1)

annotation = ax.annotate("", xy=(0, 0), xytext=(20, 20), textcoords="offset points",
                         bbox=dict(boxstyle="round", fc="w"),
                         arrowprops=dict(arrowstyle="->"))
annotation.set_visible(False)

def on_mouse_move(event):
    if event.inaxes:
        x, y = event.xdata, event.ydata
        annotation.xy = (x, y)
        annotation.set_text(f"x={x:.2f}, y={y:.2f}")
        annotation.set_visible(True)
    else:
        annotation.set_visible(False)
    fig.canvas.draw_idle()

fig.canvas.mpl_connect('motion_notify_event', on_mouse_move)

plt.show()
Output:
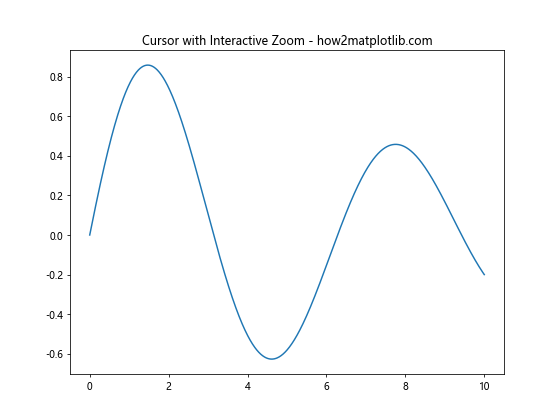
在这个示例中,用户可以使用Matplotlib的内置缩放工具来放大感兴趣的区域,同时Cursor会继续提供精确的坐标信息。
13. 在极坐标图中使用Cursor
Cursor Widget不仅适用于笛卡尔坐标系,也可以应用于极坐标系。以下是一个在极坐标图中使用Cursor的示例:
import matplotlib.pyplot as plt
import numpy as np
from matplotlib.widgets import Cursor

fig, ax = plt.subplots(figsize=(8, 8), subplot_kw=dict(projection='polar'))
ax.set_title("Polar Plot with Cursor - how2matplotlib.com")

r = np.linspace(0, 1, 100)
theta = 2 * np.pi * r
ax.plot(theta, r)

cursor = Cursor(ax, useblit=True, color='red', linewidth=1)

annotation = ax.annotate("", xy=(0, 0), xytext=(20, 20), textcoords="offset points",
                         bbox=dict(boxstyle="round", fc="w"),
                         arrowprops=dict(arrowstyle="->"))
annotation.set_visible(False)

def on_mouse_move(event):
    if event.inaxes:
        theta, r = event.xdata, event.ydata
        annotation.xy = (theta, r)
        annotation.set_text(f"θ={theta:.2f}, r={r:.2f}")
        annotation.set_visible(True)
    else:
        annotation.set_visible(False)
    fig.canvas.draw_idle()

fig.canvas.mpl_connect('motion_notify_event', on_mouse_move)

plt.show()
Output:
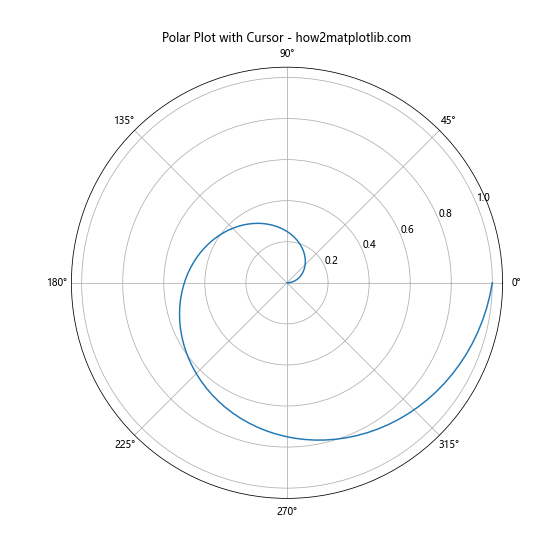
这个示例在极坐标系中绘制了一个螺旋线,并添加了Cursor功能。用户可以精确地读取任意点的角度和半径值。
14. Cursor在金融数据分析中的应用
Cursor Widget在金融数据分析中特别有用,尤其是在绘制股票价格图表时。以下是一个简单的股票价格图表示例,结合了Cursor功能:
import matplotlib.pyplot as plt
import numpy as np
import pandas as pd
from matplotlib.widgets import Cursor

# 生成模拟的股票数据
dates = pd.date_range(start='2023-01-01', end='2023-12-31', freq='D')
prices = 100 + np.cumsum(np.random.randn(len(dates)) * 0.5)
df = pd.DataFrame({'Date': dates, 'Price': prices})

fig, ax = plt.subplots(figsize=(12, 6))
ax.set_title("Stock Price with Cursor - how2matplotlib.com")
ax.plot(df['Date'], df['Price'])
ax.set_xlabel('Date')
ax.set_ylabel('Price')

cursor = Cursor(ax, useblit=True, color='red', linewidth=1)

annotation = ax.annotate("", xy=(0, 0), xytext=(20, 20), textcoords="offset points",
                         bbox=dict(boxstyle="round", fc="w"),
                         arrowprops=dict(arrowstyle="->"))
annotation.set_visible(False)

def on_mouse_move(event):
    if event.inaxes:
        x, y = event.xdata, event.ydata
        date = pd.to_datetime(x).strftime('%Y-%m-%d')
        annotation.xy = (x, y)
        annotation.set_text(f"Date: {date}\nPrice: ${y:.2f}")
        annotation.set_visible(True)
    else:
        annotation.set_visible(False)
    fig.canvas.draw_idle()

fig.canvas.mpl_connect('motion_notify_event', on_mouse_move)

plt.show()
Output:

这个示例创建了一个模拟的股票价格图表,并添加了Cursor功能。用户可以精确地查看任意日期的股票价格。
15. 在热图中使用Cursor
Cursor Widget也可以应用于热图,帮助用户精确定位和读取热图中的数值。以下是一个在热图中使用Cursor的示例:
import matplotlib.pyplot as plt
import numpy as np
from matplotlib.widgets import Cursor

fig, ax = plt.subplots(figsize=(8, 6))
ax.set_title("Heatmap with Cursor - how2matplotlib.com")

data = np.random.rand(10, 10)
im = ax.imshow(data, cmap='viridis')
plt.colorbar(im)

cursor = Cursor(ax, useblit=True, color='white', linewidth=1)

annotation = ax.annotate("", xy=(0, 0), xytext=(20, 20), textcoords="offset points",
                         bbox=dict(boxstyle="round", fc="w"),
                         arrowprops=dict(arrowstyle="->"))
annotation.set_visible(False)

def on_mouse_move(event):
    if event.inaxes:
        x, y = int(event.xdata), int(event.ydata)
        if 0 <= x < data.shape[1] and 0 <= y < data.shape[0]:
            value = data[y, x]
            annotation.xy = (x, y)
            annotation.set_text(f"x={x}, y={y}\nvalue={value:.2f}")
            annotation.set_visible(True)
        else:
            annotation.set_visible(False)
    else:
        annotation.set_visible(False)
    fig.canvas.draw_idle()

fig.canvas.mpl_connect('motion_notify_event', on_mouse_move)

plt.show()
Output:
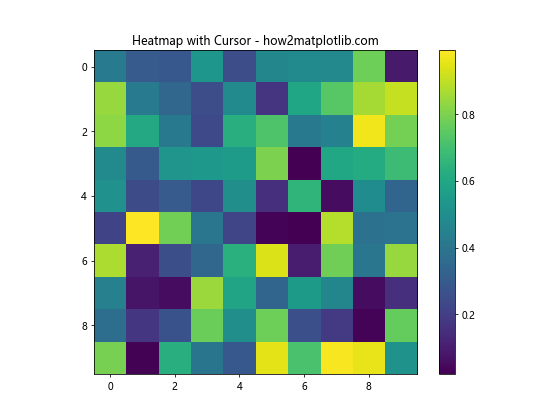
这个示例创建了一个随机数据的热图,并添加了Cursor功能。用户可以精确地查看热图中任意位置的数值。
结论
Matplotlib的Cursor Widget是一个强大的工具,可以极大地增强数据可视化的交互性和信息量。通过本文介绍的各种技巧和示例,读者可以灵活运用Cursor Widget来创建更加丰富、直观的数据可视化图表。无论是在科学研究、数据分析还是金融领域,Cursor Widget都能为用户提供精确的数据读取和探索能力,帮助用户更好地理解和分析数据。
在实际应用中,可以根据具体需求来定制和扩展Cursor Widget的功能。例如,可以结合其他交互式工具,如滑块、按钮等,创建更复杂的交互式数据探索界面。此外,还可以考虑将Cursor Widget与其他Python库(如Pandas、NumPy等)结合使用,以处理更大规模和更复杂的数据集。
总之,掌握Matplotlib Cursor Widget的使用,将为您的数据可视化工作带来新的维度和可能性。希望本文的内容能够帮助读者充分利用这一强大工具,创造出更加精彩的数据可视化作品。
 极客教程
极客教程