Matplotlib 图形尺寸设置:全面掌握 Figure Size 控制技巧
Matplotlib 是 Python 中最流行的数据可视化库之一,它提供了丰富的绘图功能和灵活的自定义选项。在使用 Matplotlib 创建图形时,控制图形尺寸是一个非常重要的方面。适当的图形尺寸不仅能够提高可视化效果,还能确保图形在不同场景下的适用性。本文将深入探讨 Matplotlib 中的图形尺寸设置,包括基本概念、常用方法、高级技巧以及实际应用案例。
1. 图形尺寸的基本概念
在 Matplotlib 中,图形尺寸主要由 Figure 对象的 size 属性控制。Figure 是整个图形的容器,包含了所有的绘图元素。图形尺寸通常以英寸为单位,但也可以使用其他单位。
1.1 默认图形尺寸
Matplotlib 有一个默认的图形尺寸,通常为 6.4 x 4.8 英寸。这个默认值可以通过 rcParams 参数来查看或修改。
import matplotlib.pyplot as plt

# 查看默认图形尺寸
print(f"Default figure size: {plt.rcParams['figure.figsize']}")

# 修改默认图形尺寸
plt.rcParams['figure.figsize'] = [8, 6]

# 创建一个使用新默认尺寸的图形
fig, ax = plt.subplots()
ax.plot([1, 2, 3, 4], [1, 4, 2, 3])
ax.set_title("How2matplotlib.com - Default Figure Size")
plt.show()
Output:
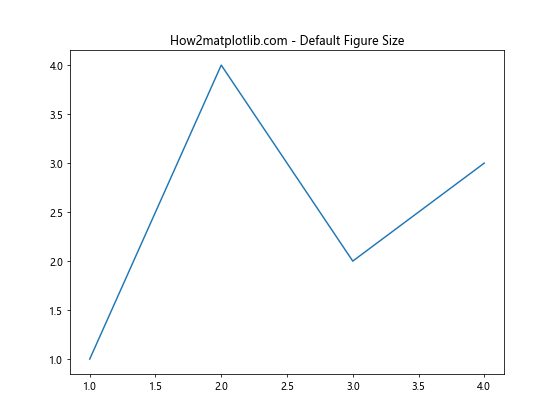
在这个例子中,我们首先打印了默认的图形尺寸,然后将其修改为 8×6 英寸。之后创建的所有图形都会使用这个新的默认尺寸,除非另有指定。
1.2 DPI(每英寸点数)
DPI 是另一个与图形尺寸密切相关的概念。它决定了图形在屏幕上显示的大小以及保存为图片文件时的分辨率。
import matplotlib.pyplot as plt

# 创建一个指定 DPI 的图形
fig, ax = plt.subplots(figsize=(6, 4), dpi=100)
ax.plot([1, 2, 3, 4], [1, 4, 2, 3])
ax.set_title("How2matplotlib.com - Figure with Specified DPI")
plt.show()

# 保存高分辨率图片
fig.savefig('high_res_plot.png', dpi=300)
Output:
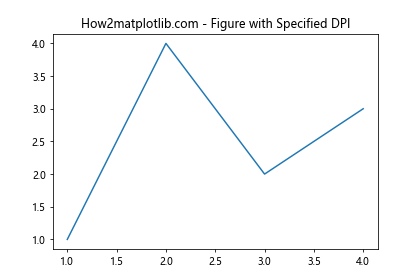
这个例子展示了如何在创建图形时指定 DPI,以及如何在保存图形时使用不同的 DPI 值。较高的 DPI 值会产生更高分辨率的图像,但文件大小也会相应增加。
2. 设置图形尺寸的常用方法
Matplotlib 提供了多种方法来设置图形尺寸,以适应不同的使用场景和个人偏好。
2.1 使用 figsize 参数
最直接的方法是在创建 Figure 对象时使用 figsize 参数。
import matplotlib.pyplot as plt

# 使用 figsize 参数创建指定尺寸的图形
fig, ax = plt.subplots(figsize=(10, 5))
ax.plot([1, 2, 3, 4], [1, 4, 2, 3])
ax.set_title("How2matplotlib.com - Custom Figure Size")
plt.show()
Output:
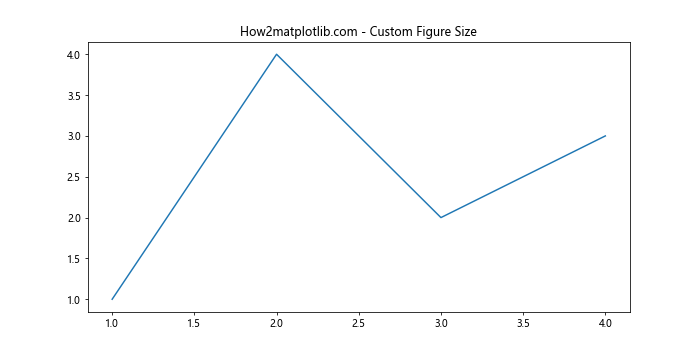
这个例子创建了一个 10×5 英寸的图形。figsize 参数接受一个包含宽度和高度的元组。
2.2 使用 set_size_inches() 方法
对于已经创建的 Figure 对象,可以使用 set_size_inches() 方法来调整其尺寸。
import matplotlib.pyplot as plt

# 创建默认尺寸的图形
fig, ax = plt.subplots()
ax.plot([1, 2, 3, 4], [1, 4, 2, 3])

# 调整图形尺寸
fig.set_size_inches(12, 6)
ax.set_title("How2matplotlib.com - Resized Figure")
plt.show()
Output:
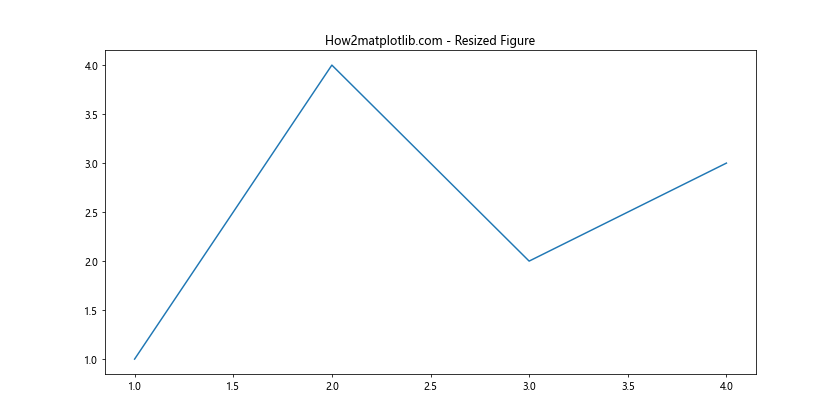
这个方法允许你在绘图过程中动态调整图形尺寸,非常灵活。
2.3 使用 tight_layout() 自动调整
tight_layout() 函数可以自动调整子图之间的间距,确保所有元素都能正确显示。
import matplotlib.pyplot as plt

fig, (ax1, ax2) = plt.subplots(1, 2, figsize=(10, 4))
ax1.plot([1, 2, 3, 4], [1, 4, 2, 3])
ax2.plot([1, 2, 3, 4], [3, 2, 4, 1])

ax1.set_title("How2matplotlib.com - Subplot 1")
ax2.set_title("How2matplotlib.com - Subplot 2")

plt.tight_layout()
plt.show()
Output:
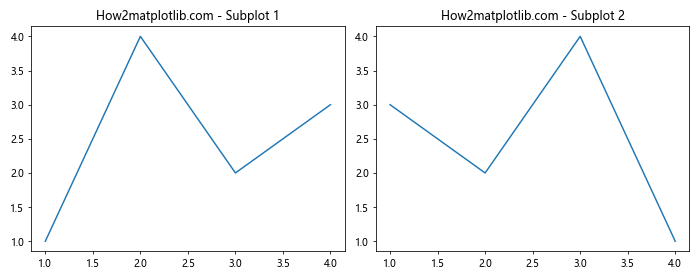
tight_layout() 特别适用于包含多个子图或有长标题的图形,它可以防止元素之间的重叠。
3. 高级图形尺寸控制技巧
除了基本的尺寸设置方法,Matplotlib 还提供了一些高级技巧来更精细地控制图形尺寸和布局。
3.1 使用 GridSpec 进行复杂布局
GridSpec 允许你创建更复杂的图形布局,并精确控制每个子图的大小和位置。
import matplotlib.pyplot as plt
import matplotlib.gridspec as gridspec

fig = plt.figure(figsize=(12, 8))
gs = gridspec.GridSpec(2, 3, height_ratios=[2, 1], width_ratios=[1, 2, 1])

ax1 = fig.add_subplot(gs[0, :2])
ax2 = fig.add_subplot(gs[0, 2])
ax3 = fig.add_subplot(gs[1, :])

ax1.plot([1, 2, 3, 4], [1, 4, 2, 3])
ax2.plot([1, 2, 3, 4], [3, 2, 4, 1])
ax3.plot([1, 2, 3, 4], [2, 3, 1, 4])

ax1.set_title("How2matplotlib.com - Main Plot")
ax2.set_title("How2matplotlib.com - Side Plot")
ax3.set_title("How2matplotlib.com - Bottom Plot")

plt.tight_layout()
plt.show()
Output:
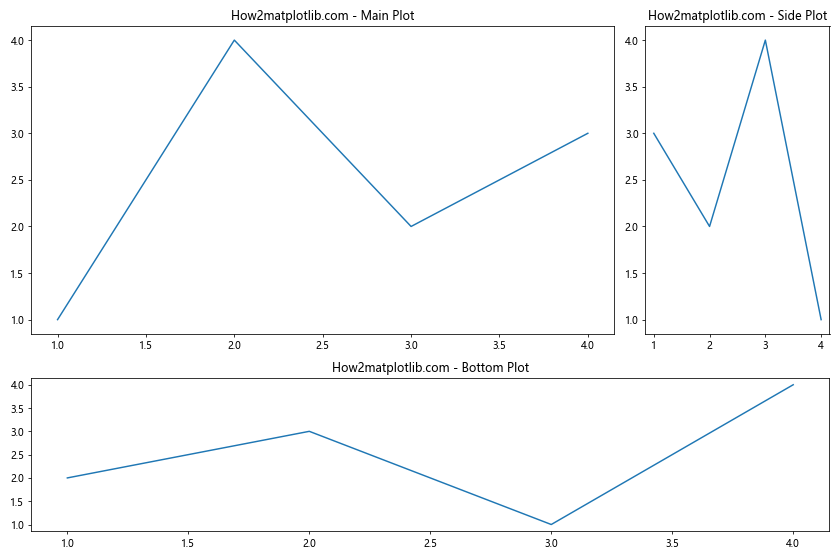
这个例子展示了如何使用 GridSpec 创建一个包含三个子图的复杂布局,每个子图的大小和位置都可以精确控制。
3.2 调整子图间距
除了使用 tight_layout(),你还可以手动调整子图之间的间距。
import matplotlib.pyplot as plt

fig, (ax1, ax2) = plt.subplots(1, 2, figsize=(12, 5))
ax1.plot([1, 2, 3, 4], [1, 4, 2, 3])
ax2.plot([1, 2, 3, 4], [3, 2, 4, 1])

ax1.set_title("How2matplotlib.com - Left Plot")
ax2.set_title("How2matplotlib.com - Right Plot")

# 调整子图间距
plt.subplots_adjust(wspace=0.5, hspace=0.5)
plt.show()
Output:
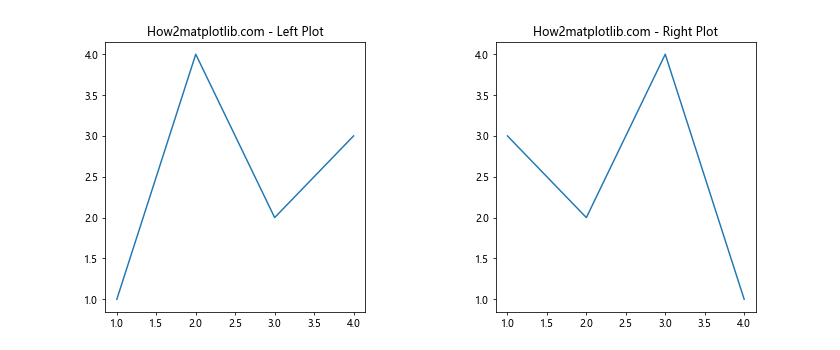
subplots_adjust() 函数允许你精细控制子图之间的间距,wspace 控制宽度方向的间距,hspace 控制高度方向的间距。
3.3 使用 constrained_layout
constrained_layout 是一个新的自动布局调整器,它可以更智能地处理复杂的布局情况。
import matplotlib.pyplot as plt

fig, axs = plt.subplots(2, 2, figsize=(10, 8), constrained_layout=True)

for ax in axs.flat:
    ax.plot([1, 2, 3, 4], [1, 4, 2, 3])
    ax.set_title("How2matplotlib.com - Subplot")

plt.show()
Output:
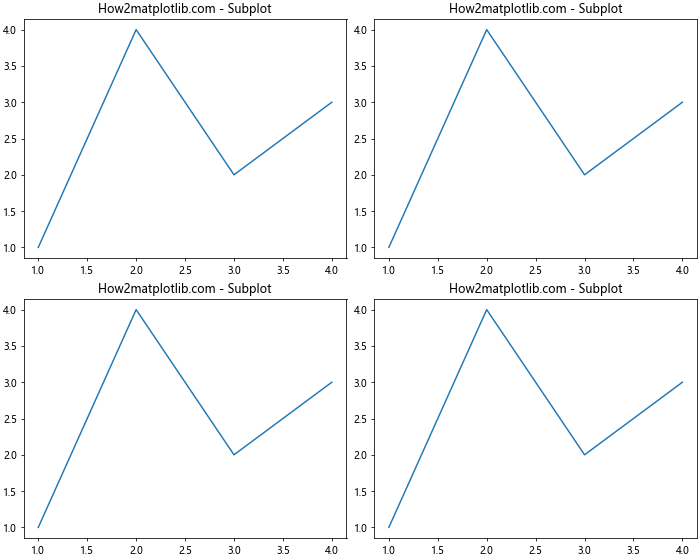
constrained_layout 可以自动调整子图的大小和位置,以确保标题、标签等元素不会重叠。
4. 图形尺寸与不同输出格式的关系
图形尺寸设置不仅影响屏幕显示,还会影响保存为不同格式的输出效果。
4.1 矢量格式 (SVG, PDF)
对于矢量格式,图形尺寸决定了输出文件中的实际尺寸。
import matplotlib.pyplot as plt

fig, ax = plt.subplots(figsize=(8, 6))
ax.plot([1, 2, 3, 4], [1, 4, 2, 3])
ax.set_title("How2matplotlib.com - Vector Format Output")

# 保存为 SVG 格式
fig.savefig('vector_plot.svg')

# 保存为 PDF 格式
fig.savefig('vector_plot.pdf')
这些矢量格式可以无损放大,非常适合用于印刷或需要高质量图像的场景。
4.2 位图格式 (PNG, JPG)
对于位图格式,图形尺寸和 DPI 共同决定了输出图像的像素大小。
import matplotlib.pyplot as plt

fig, ax = plt.subplots(figsize=(8, 6))
ax.plot([1, 2, 3, 4], [1, 4, 2, 3])
ax.set_title("How2matplotlib.com - Raster Format Output")

# 保存为高分辨率 PNG
fig.savefig('high_res_plot.png', dpi=300)

# 保存为低分辨率 JPG
fig.savefig('low_res_plot.jpg', dpi=72)
调整 DPI 可以在文件大小和图像质量之间找到平衡。
5. 响应式图形尺寸
在某些情况下,你可能需要创建能够自适应不同显示环境的响应式图形。
5.1 使用百分比尺寸
可以使用 figsize 的百分比形式来创建相对尺寸的图形。
import matplotlib.pyplot as plt
from matplotlib.figure import Figure

def create_responsive_figure():
    fig = Figure(figsize=(0.8, 0.6))  # 80% 宽度,60% 高度
    ax = fig.add_subplot(111)
    ax.plot([1, 2, 3, 4], [1, 4, 2, 3])
    ax.set_title("How2matplotlib.com - Responsive Figure")
    return fig

# 在 Jupyter Notebook 或其他支持环境中使用
fig = create_responsive_figure()
plt.show()
Output:

这种方法创建的图形会根据显示环境的大小自动调整。
5.2 动态调整图形尺寸
在交互式环境中,可以根据用户输入或窗口大小动态调整图形尺寸。
import matplotlib.pyplot as plt
from matplotlib.backends.backend_tkagg import FigureCanvasTkAgg
import tkinter as tk

def update_figure_size(event):
    width = event.width / 100  # 将像素转换为英寸
    height = event.height / 100
    fig.set_size_inches(width, height)
    canvas.draw()

root = tk.Tk()
fig, ax = plt.subplots()
ax.plot([1, 2, 3, 4], [1, 4, 2, 3])
ax.set_title("How2matplotlib.com - Resizable Figure")

canvas = FigureCanvasTkAgg(fig, master=root)
canvas.draw()
canvas.get_tk_widget().pack(fill=tk.BOTH, expand=True)

canvas.get_tk_widget().bind("<Configure>", update_figure_size)

root.mainloop()
这个例子展示了如何创建一个可以随窗口大小变化的图形。
6. 图形尺寸与性能考虑
图形尺寸不仅影响视觉效果,还会影响绘图性能和内存使用。
6.1 大尺寸图形的性能优化
对于大尺寸图形,可以使用一些技巧来优化性能:
import matplotlib.pyplot as plt
import numpy as np

# 创建大尺寸图形
fig, ax = plt.subplots(figsize=(20, 15), dpi=100)

# 使用 rasterization 来减少文件大小
x = np.linspace(0, 10, 1000)
y = np.sin(x)
ax.plot(x, y, rasterized=True)

ax.set_title("How2matplotlib.com - Large Figure with Rasterization")

# 保存为 PDF,矢量和栅格混合
fig.savefig('large_plot_optimized.pdf', dpi=300)
使用 rasterized=True 可以将部分元素栅格化,减少文件大小和渲染时间。
6.2 内存管理
对于内存受限的环境,可以使用分块处理的方法:
import matplotlib.pyplot as plt
import numpy as np

def plot_large_data(data, chunk_size=1000):
    fig, ax = plt.subplots(figsize=(10, 6))
    for i in range(0, len(data), chunk_size):
        chunk = data[i:i+chunk_size]
        ax.plot(chunk, label=f'Chunk {i//chunk_size}')
    ax.set_title("How2matplotlib.com - Large Data Plot")
    plt.legend()
    plt.show()

# 生成大量数据
large_data = np.random.randn(10000)
plot_large_data(large_data)
Output:

这种方法通过分块处理大量数据,可以有效减少内存使用。
7. 图形尺寸与不同类型的图表
不同类型的图表可能需要不同的尺寸设置来达到最佳效果。
7.1 散点图
散点图通常需要更方形的尺寸以保持数据点的可读性。
import matplotlib.pyplot as plt
import numpy as np

fig, ax = plt.subplots(figsize=(8, 8))
x = np.random.rand(50)
y = np.random.rand(50)
colors = np.random.rand(50)
sizes = 1000 * np.random.rand(50)

scatter = ax.scatter(x, y, c=colors, s=sizes, alpha=0.5)
ax.set_title("How2matplotlib.com - Scatter Plot")

plt.colorbar(scatter)
plt.show()
Output:
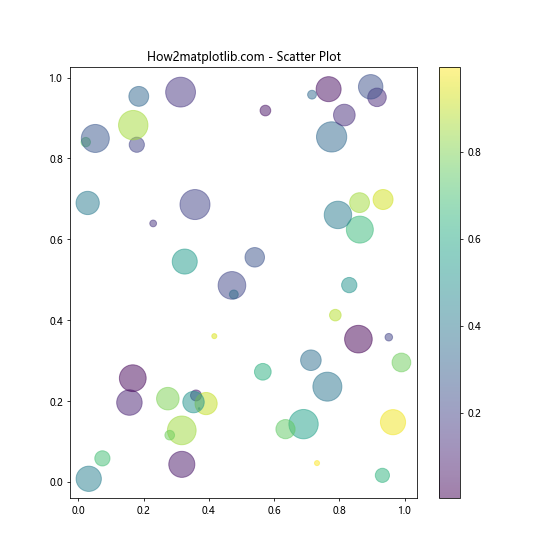
这个例子创建了一个正方形的散点图,适合展示二维数据分布。
7.2 条形图
条形图通常需要更宽的尺寸,特别是当有多个类别时。
import matplotlib.pyplot as plt
import numpy as np

fig, ax = plt.subplots(figsize=(12, 6))
categories = ['A', 'B', 'C', 'D', 'E']
values = np.random.randint(10, 100, size=5)

ax.bar(categories, values)
ax.set_title("How2matplotlib.com - Bar Chart")
ax.set_ylabel("Values")
ax.set_xlabel("Categories")

plt.show()
Output:
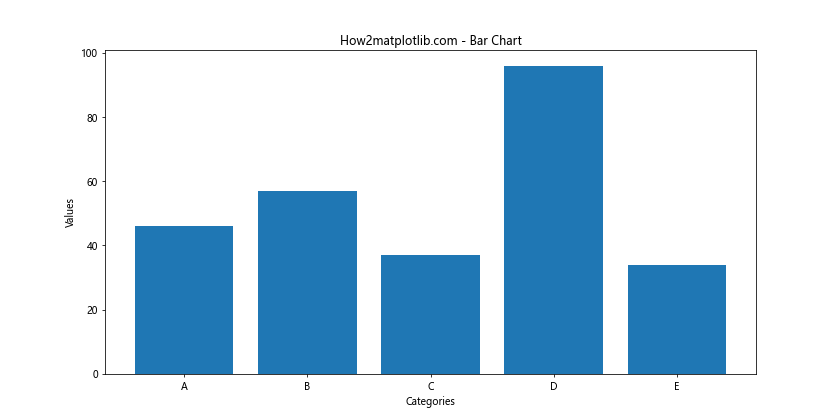
这个宽矩形的尺寸适合展示多个类别的条形图。
7.3 时间序列图
时间序列图通常需要较宽的尺寸以展示长时间跨度的数据。
import matplotlib.pyplot as plt
import pandas as pd
import numpy as np

fig, ax = plt.subplots(figsize=(14, 6))
dates = pd.date_range(start='2023-01-01', end='2023-12-31', freq='D')
values = np.cumsum(np.random.randn(len(dates)))

ax.plot(dates, values)
ax.set_title("How2matplotlib.com - Time Series Plot")
ax.set_xlabel("Date")
ax.set_ylabel("Value")

plt.xticks(rotation=45)
plt.tight_layout()
plt.show()
Output:
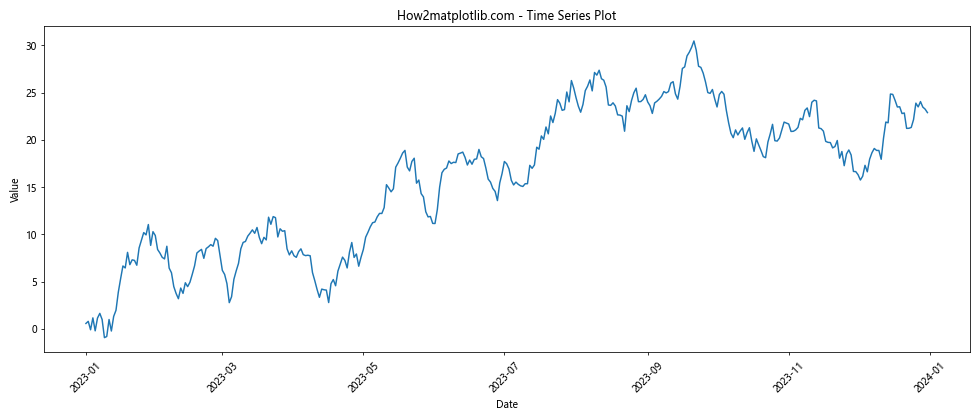
这个例子使用了较宽的图形来展示全年的时间序列数据。
8. 图形尺寸与多子图布局
在创建包含多个子图的复杂图形时,合理设置整体尺寸和各子图的相对大小非常重要。
8.1 网格布局
使用 subplot 可以轻松创建网格布局的多子图。
import matplotlib.pyplot as plt
import numpy as np

fig, axs = plt.subplots(2, 2, figsize=(12, 10))
fig.suptitle("How2matplotlib.com - Multiple Subplots")

x = np.linspace(0, 2*np.pi, 100)

axs[0, 0].plot(x, np.sin(x))
axs[0, 0].set_title("Sine")

axs[0, 1].plot(x, np.cos(x))
axs[0, 1].set_title("Cosine")

axs[1, 0].plot(x, np.tan(x))
axs[1, 0].set_title("Tangent")

axs[1, 1].plot(x, np.exp(x))
axs[1, 1].set_title("Exponential")

plt.tight_layout()
plt.show()
Output:
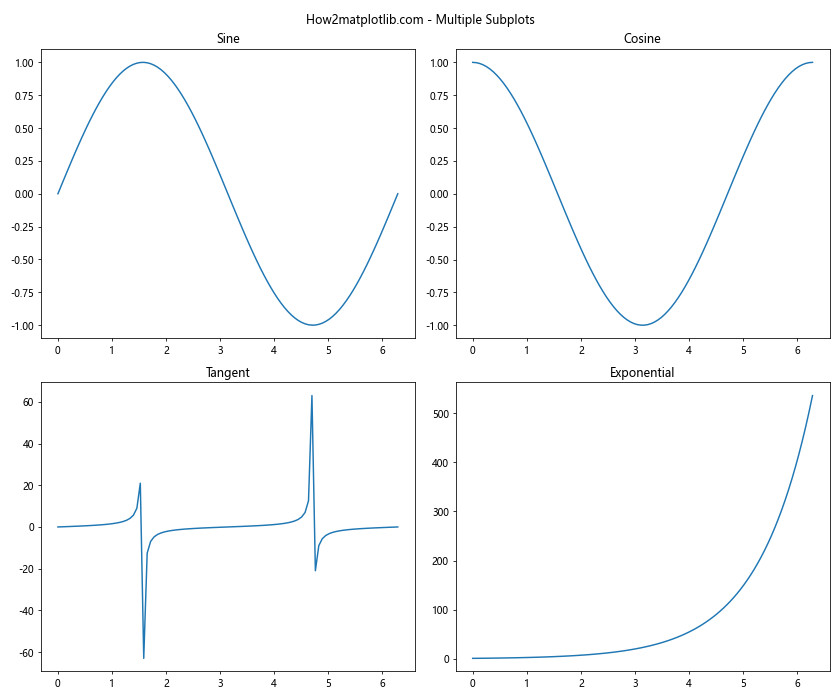
这个例子创建了一个 2×2 的子图网格,每个子图展示不同的数学函数。
8.2 不规则布局
对于更复杂的布局,可以使用 GridSpec 来创建不规则的子图排列。
import matplotlib.pyplot as plt
import matplotlib.gridspec as gridspec

fig = plt.figure(figsize=(12, 8))
gs = gridspec.GridSpec(3, 3)

ax1 = fig.add_subplot(gs[0, :])
ax2 = fig.add_subplot(gs[1, :-1])
ax3 = fig.add_subplot(gs[1:, -1])
ax4 = fig.add_subplot(gs[-1, 0])
ax5 = fig.add_subplot(gs[-1, -2])

ax1.set_title("How2matplotlib.com - Top")
ax2.set_title("How2matplotlib.com - Middle Left")
ax3.set_title("How2matplotlib.com - Right")
ax4.set_title("How2matplotlib.com - Bottom Left")
ax5.set_title("How2matplotlib.com - Bottom Middle")

plt.tight_layout()
plt.show()
Output:
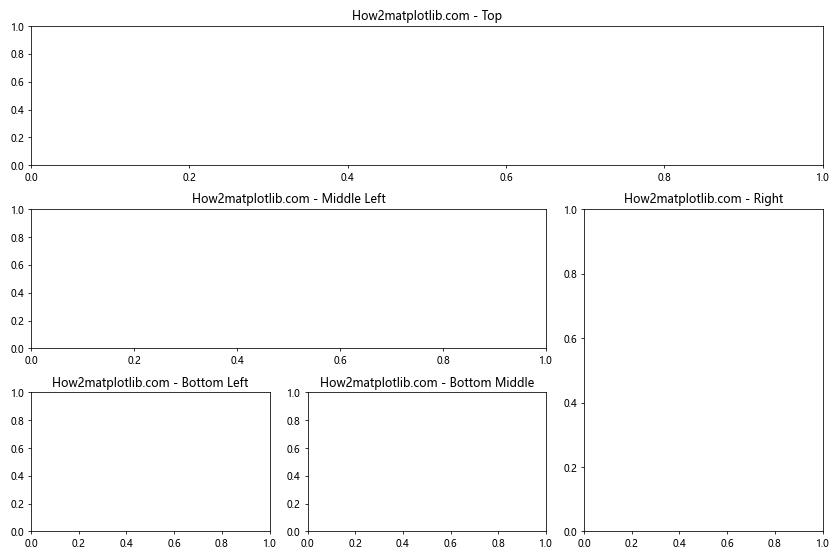
这个例子展示了如何使用 GridSpec 创建一个复杂的不规则子图布局。
9. 图形尺寸与标注
在设置图形尺寸时,需要考虑各种标注元素(如标题、轴标签、图例等)所占用的空间。
9.1 长标题和轴标签
对于具有长标题或轴标签的图形,可能需要调整尺寸以适应这些文本。
import matplotlib.pyplot as plt
import numpy as np

fig, ax = plt.subplots(figsize=(10, 6))
x = np.linspace(0, 10, 100)
y = np.sin(x)

ax.plot(x, y)
ax.set_title("How2matplotlib.com - A Very Long Title That Needs Extra Space")
ax.set_xlabel("This is a long X-axis label that might need more room")
ax.set_ylabel("This is a long Y-axis label that might need more room")

plt.tight_layout()
plt.show()
Output:
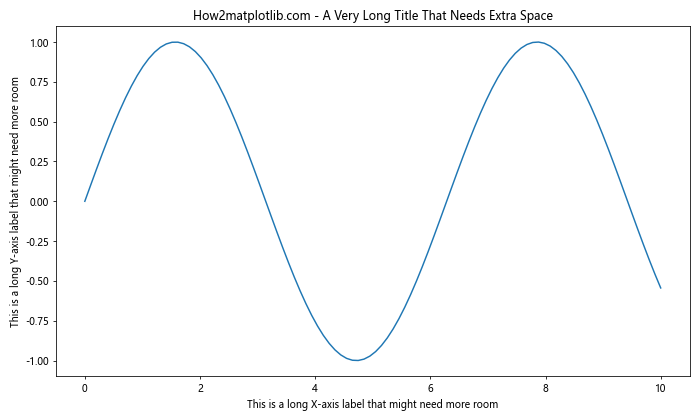
使用 tight_layout() 可以自动调整布局以适应长标题和标签。
9.2 图例位置
图例的位置和大小也会影响整体图形的布局。
import matplotlib.pyplot as plt
import numpy as np

fig, ax = plt.subplots(figsize=(10, 6))
x = np.linspace(0, 10, 100)

ax.plot(x, np.sin(x), label='Sine')
ax.plot(x, np.cos(x), label='Cosine')
ax.plot(x, np.tan(x), label='Tangent')

ax.set_title("How2matplotlib.com - Trigonometric Functions")
ax.legend(loc='center left', bbox_to_anchor=(1, 0.5))

plt.tight_layout()
plt.show()
Output:
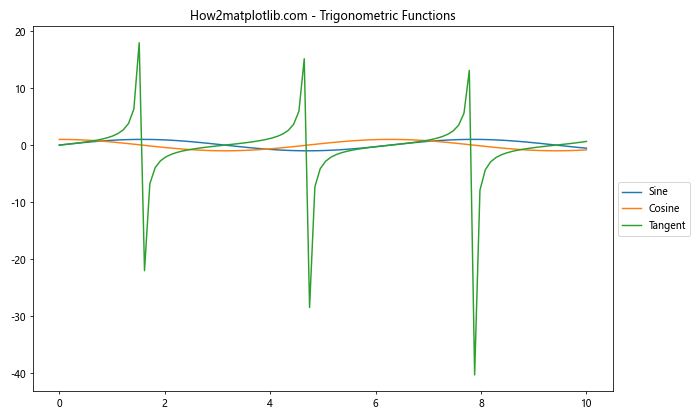
这个例子将图例放置在图形的右侧,并相应地调整了图形尺寸。
10. 图形尺寸与交互性
在创建交互式图形时,需要考虑不同设备和屏幕尺寸。
10.1 响应式图形
使用相对尺寸可以创建适应不同屏幕大小的响应式图形。
import matplotlib.pyplot as plt
from matplotlib.figure import Figure
from IPython.display import display

def create_responsive_figure(width_percentage=0.8, height_percentage=0.6):
    fig = Figure(figsize=(width_percentage, height_percentage))
    ax = fig.add_subplot(111)
    ax.plot([1, 2, 3, 4], [1, 4, 2, 3])
    ax.set_title("How2matplotlib.com - Responsive Figure")
    return fig

# 在 Jupyter Notebook 中使用
fig = create_responsive_figure()
display(fig)
这个函数创建的图形会根据显示环境的大小自动调整。
10.2 可缩放图形
在某些交互式环境中,允许用户动态调整图形大小。
import matplotlib.pyplot as plt
from matplotlib.backends.backend_tkagg import FigureCanvasTkAgg
import tkinter as tk

def on_resize(event):
    fig.set_size_inches(event.width/100, event.height/100)
    fig.canvas.draw()

root = tk.Tk()
fig, ax = plt.subplots()
ax.plot([1, 2, 3, 4], [1, 4, 2, 3])
ax.set_title("How2matplotlib.com - Resizable Plot")

canvas = FigureCanvasTkAgg(fig, master=root)
canvas.draw()
canvas.get_tk_widget().pack(fill=tk.BOTH, expand=1)
canvas.get_tk_widget().bind('<Configure>', on_resize)

root.mainloop()
这个例子创建了一个可以随窗口大小变化的图形。
结论
掌握 Matplotlib 中的图形尺寸设置是创建高质量数据可视化的关键技能。通过合理设置图形尺寸,可以优化数据展示效果,提高可读性,并确保图形在不同场景下的适用性。本文详细介绍了从基本概念到高级技巧的各种图形尺寸控制方法,涵盖了不同类型的图表、多子图布局、标注处理等方面。通过灵活运用这些技巧,你可以创建出既美观又实用的数据可视化图形,无论是用于学术论文、商业报告还是交互式应用。记住,图形尺寸的选择应该根据具体的数据特征、展示需求和目标受众来决定,并且要考虑到不同输出格式和显示环境的要求。通过不断实践和调整,你将能够为每个可视化任务找到最佳的图形尺寸设置。
 极客教程
极客教程