Matplotlib 图形尺寸和单位:全面掌握绘图大小控制
参考:matplotlib figure size units
Matplotlib 是 Python 中最流行的数据可视化库之一,它提供了强大而灵活的工具来创建各种类型的图表和绘图。在使用 Matplotlib 时,控制图形的尺寸和单位是一个非常重要的方面,因为它直接影响到图形的显示效果和可读性。本文将深入探讨 Matplotlib 中的图形尺寸和单位设置,帮助你全面掌握如何精确控制绘图大小。
1. 理解 Matplotlib 中的 Figure 和 Axes
在开始讨论图形尺寸和单位之前,我们需要先了解 Matplotlib 中的两个核心概念:Figure 和 Axes。
- Figure:整个图形窗口,可以包含一个或多个 Axes。
- Axes:实际的绘图区域,包含数据、坐标轴等。
理解这两个概念对于正确设置图形尺寸至关重要。
示例代码:
import matplotlib.pyplot as plt

# 创建一个 Figure 和一个 Axes
fig, ax = plt.subplots()

# 在 Axes 上绘制一些数据
ax.plot([1, 2, 3, 4], [1, 4, 2, 3], label='Data from how2matplotlib.com')

# 添加标题和标签
ax.set_title('Simple Plot')
ax.set_xlabel('X-axis')
ax.set_ylabel('Y-axis')
ax.legend()

plt.show()
Output:
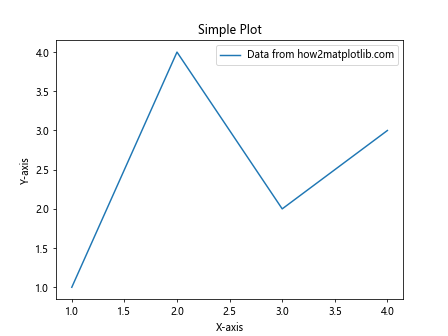
这个示例创建了一个包含单个 Axes 的 Figure,并在其中绘制了一条简单的线。
2. 设置 Figure 尺寸
2.1 使用 figsize 参数
最常用的设置 Figure 尺寸的方法是使用 figsize 参数。这个参数接受一个元组,表示宽度和高度,单位为英寸。
示例代码:
import matplotlib.pyplot as plt

# 创建一个 10x6 英寸的 Figure
fig, ax = plt.subplots(figsize=(10, 6))

# 绘制数据
ax.plot([1, 2, 3, 4], [1, 4, 2, 3], label='Data from how2matplotlib.com')

ax.set_title('Figure with Custom Size')
ax.set_xlabel('X-axis')
ax.set_ylabel('Y-axis')
ax.legend()

plt.show()
Output:
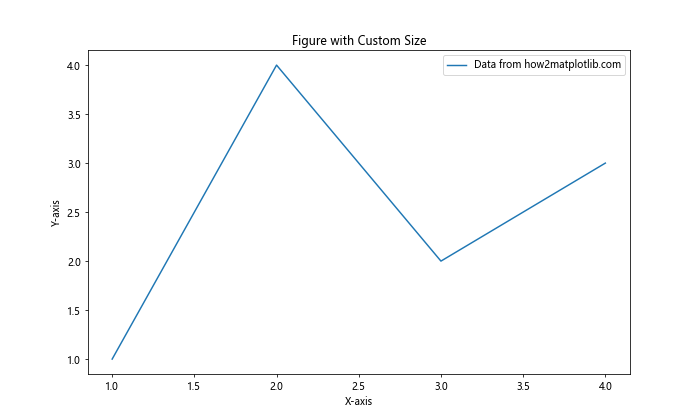
在这个例子中,我们创建了一个宽 10 英寸、高 6 英寸的 Figure。
2.2 使用 plt.figure() 函数
另一种设置 Figure 尺寸的方法是使用 plt.figure() 函数。
示例代码:
import matplotlib.pyplot as plt

# 创建一个 8x5 英寸的 Figure
fig = plt.figure(figsize=(8, 5))

# 添加一个 Axes
ax = fig.add_subplot(111)

# 绘制数据
ax.plot([1, 2, 3, 4], [1, 4, 2, 3], label='Data from how2matplotlib.com')

ax.set_title('Figure Created with plt.figure()')
ax.set_xlabel('X-axis')
ax.set_ylabel('Y-axis')
ax.legend()

plt.show()
Output:
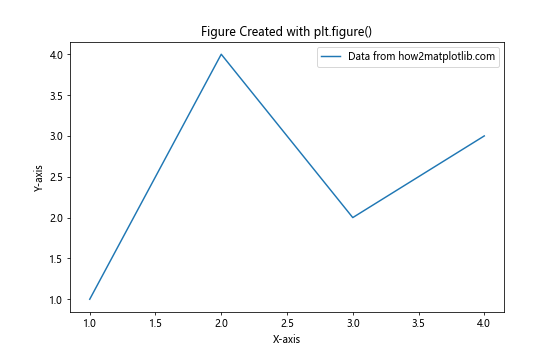
这个方法允许你先创建 Figure,然后再添加 Axes。
3. 理解 DPI(每英寸点数)
DPI(Dots Per Inch)是影响图形尺寸的另一个重要因素。它决定了每英寸包含多少个像素。
3.1 设置 DPI
你可以在创建 Figure 时设置 DPI。
示例代码:
import matplotlib.pyplot as plt

# 创建一个 6x4 英寸、DPI 为 150 的 Figure
fig, ax = plt.subplots(figsize=(6, 4), dpi=150)

# 绘制数据
ax.plot([1, 2, 3, 4], [1, 4, 2, 3], label='Data from how2matplotlib.com')

ax.set_title('Figure with Custom DPI')
ax.set_xlabel('X-axis')
ax.set_ylabel('Y-axis')
ax.legend()

plt.show()
Output:
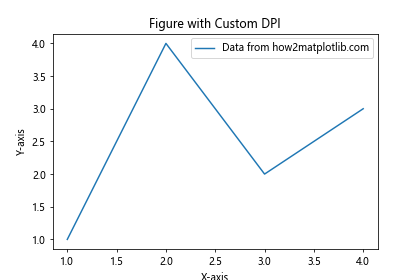
这个例子创建了一个 6×4 英寸的 Figure,但由于 DPI 设置为 150,实际像素尺寸会比默认 DPI(通常是 100)时大。
3.2 DPI 对图形质量的影响
更高的 DPI 会产生更高质量的图像,但文件大小也会增加。在选择 DPI 时,需要在图像质量和文件大小之间权衡。
4. 使用不同的单位
虽然 Matplotlib 默认使用英寸作为单位,但你也可以使用其他单位。
4.1 使用厘米
你可以通过简单的换算来使用厘米作为单位。
示例代码:
import matplotlib.pyplot as plt

# 将厘米转换为英寸
cm = 1/2.54  # 1 英寸 = 2.54 厘米

# 创建一个 20x15 厘米的 Figure
fig, ax = plt.subplots(figsize=(20*cm, 15*cm))

# 绘制数据
ax.plot([1, 2, 3, 4], [1, 4, 2, 3], label='Data from how2matplotlib.com')

ax.set_title('Figure Size in Centimeters')
ax.set_xlabel('X-axis')
ax.set_ylabel('Y-axis')
ax.legend()

plt.show()
Output:
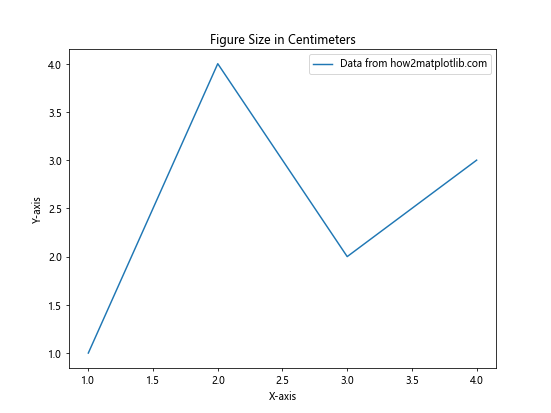
这个例子创建了一个 20×15 厘米的 Figure。
4.2 使用像素
如果你想直接指定像素尺寸,可以结合 figsize 和 dpi 参数来实现。
示例代码:
import matplotlib.pyplot as plt

# 目标像素尺寸
width_px, height_px = 800, 600

# 设置 DPI
dpi = 100

# 计算 figsize
figsize = (width_px / dpi, height_px / dpi)

# 创建 Figure
fig, ax = plt.subplots(figsize=figsize, dpi=dpi)

# 绘制数据
ax.plot([1, 2, 3, 4], [1, 4, 2, 3], label='Data from how2matplotlib.com')

ax.set_title('Figure Size in Pixels')
ax.set_xlabel('X-axis')
ax.set_ylabel('Y-axis')
ax.legend()

plt.show()
Output:
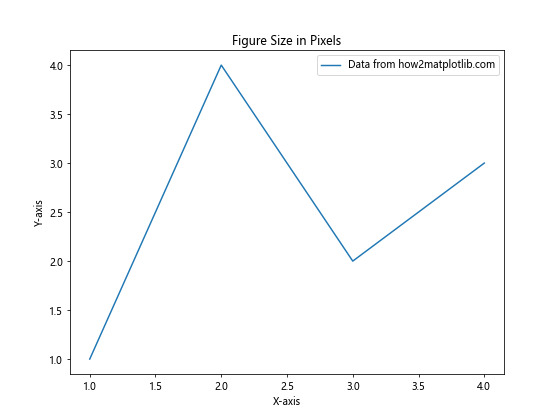
这个例子创建了一个 800×600 像素的 Figure。
5. 调整 Axes 尺寸和位置
除了设置整个 Figure 的尺寸,你还可以调整 Axes 在 Figure 中的尺寸和位置。
5.1 使用 set_position() 方法
set_position() 方法允许你精确控制 Axes 的位置和大小。
示例代码:
import matplotlib.pyplot as plt

fig, ax = plt.subplots(figsize=(8, 6))

# 绘制数据
ax.plot([1, 2, 3, 4], [1, 4, 2, 3], label='Data from how2matplotlib.com')

# 调整 Axes 位置和大小
ax.set_position([0.1, 0.1, 0.8, 0.8])  # [left, bottom, width, height]

ax.set_title('Adjusted Axes Position')
ax.set_xlabel('X-axis')
ax.set_ylabel('Y-axis')
ax.legend()

plt.show()
Output:
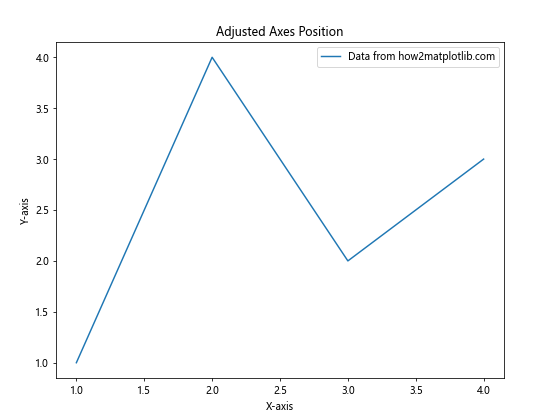
这个例子将 Axes 设置为占据 Figure 的中心 80% 区域。
5.2 使用 tight_layout()
tight_layout() 函数可以自动调整子图参数,以给定的填充适合 Figure。
示例代码:
import matplotlib.pyplot as plt

fig, (ax1, ax2) = plt.subplots(2, 1, figsize=(8, 8))

# 绘制数据
ax1.plot([1, 2, 3, 4], [1, 4, 2, 3], label='Data 1 from how2matplotlib.com')
ax2.plot([1, 2, 3, 4], [3, 2, 4, 1], label='Data 2 from how2matplotlib.com')

ax1.set_title('Subplot 1')
ax2.set_title('Subplot 2')

ax1.legend()
ax2.legend()

# 应用 tight_layout
plt.tight_layout()

plt.show()
Output:
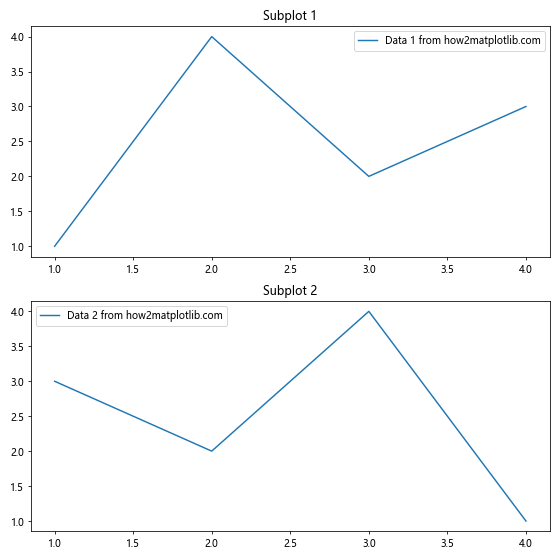
这个例子创建了两个子图,并使用 tight_layout() 自动调整它们的布局。
6. 保存图形时的尺寸控制
当保存图形为文件时,你可能需要特别注意尺寸设置。
6.1 使用 savefig() 函数
savefig() 函数允许你在保存图形时指定尺寸和 DPI。
示例代码:
import matplotlib.pyplot as plt

fig, ax = plt.subplots(figsize=(8, 6))

# 绘制数据
ax.plot([1, 2, 3, 4], [1, 4, 2, 3], label='Data from how2matplotlib.com')

ax.set_title('Saved Figure with Custom Size')
ax.set_xlabel('X-axis')
ax.set_ylabel('Y-axis')
ax.legend()

# 保存图形
plt.savefig('custom_size_figure.png', dpi=300, bbox_inches='tight')

plt.show()
Output:
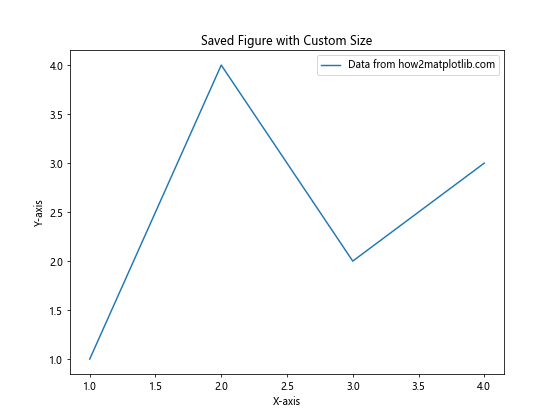
这个例子创建了一个图形,并以 300 DPI 的分辨率保存为 PNG 文件。bbox_inches='tight' 参数确保图形的所有部分都包含在保存的文件中。
6.2 调整保存的图形大小
有时你可能需要在保存时调整图形大小,而不改变原始 Figure 的尺寸。
示例代码:
import matplotlib.pyplot as plt

fig, ax = plt.subplots(figsize=(8, 6))

# 绘制数据
ax.plot([1, 2, 3, 4], [1, 4, 2, 3], label='Data from how2matplotlib.com')

ax.set_title('Resized Figure on Save')
ax.set_xlabel('X-axis')
ax.set_ylabel('Y-axis')
ax.legend()

# 保存图形,调整大小
fig.savefig('resized_figure.png', dpi=300, bbox_inches='tight',
            pad_inches=0.1, facecolor='white', edgecolor='none',
            orientation='portrait', papertype=None, format=None,
            transparent=False, bbox_extra_artists=None, frameon=None,
            metadata=None)

plt.show()
这个例子展示了 savefig() 函数的多个参数,允许你精细控制保存的图形。
7. 响应式图形尺寸
在某些情况下,你可能需要创建能够根据显示环境自动调整大小的图形。
7.1 使用 %matplotlib notebook
在 Jupyter Notebook 中,你可以使用 %matplotlib notebook 魔法命令来创建交互式、可调整大小的图形。
示例代码:
%matplotlib notebook
import matplotlib.pyplot as plt
import numpy as np

fig, ax = plt.subplots()

x = np.linspace(0, 10, 100)
ax.plot(x, np.sin(x), label='Sin(x) from how2matplotlib.com')
ax.plot(x, np.cos(x), label='Cos(x) from how2matplotlib.com')

ax.set_title('Interactive Resizable Plot')
ax.set_xlabel('X-axis')
ax.set_ylabel('Y-axis')
ax.legend()

plt.show()
这个例子创建了一个可以在 Jupyter Notebook 中交互调整大小的图形。
7.2 使用 plt.rcParams
你可以通过修改 plt.rcParams 来设置默认的图形尺寸和其他参数。
示例代码:
import matplotlib.pyplot as plt
import numpy as np

# 设置默认图形尺寸
plt.rcParams['figure.figsize'] = [10.0, 8.0]
plt.rcParams['figure.dpi'] = 100

fig, ax = plt.subplots()

x = np.linspace(0, 10, 100)
ax.plot(x, np.sin(x), label='Sin(x) from how2matplotlib.com')
ax.plot(x, np.cos(x), label='Cos(x) from how2matplotlib.com')

ax.set_title('Plot with Default Size from rcParams')
ax.set_xlabel('X-axis')
ax.set_ylabel('Y-axis')
ax.legend()

plt.show()
Output:
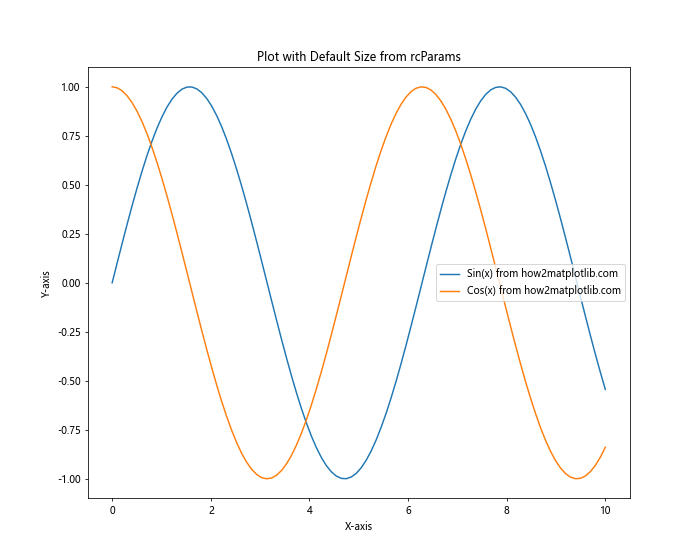
这个例子设置了默认的图形尺寸为 10×8 英寸,DPI 为 100。
8. 处理不同屏幕分辨率
在不同的显示设备上,相同尺寸的图形可能会有不同的显示效果。
8.1 使用相对尺寸
你可以使用相对尺寸来创建在不同分辨率下都能良好显示的图形。
示例代码:
import matplotlib.pyplot as plt
from matplotlib.figure import Figure
from matplotlib.backends.backend_agg import FigureCanvasAgg

# 获取屏幕 DPI(这里假设为 96,实际应用中需要获取真实值)
screen_dpi = 96

# 设置目标尺寸(以厘米为单位)
width_cm, height_cm = 20, 15

# 转换为英寸
width_inch = width_cm / 2.54
height_inch = height_cm /2.54

# 创建 Figure
fig = Figure(figsize=(width_inch, height_inch), dpi=screen_dpi)
canvas = FigureCanvasAgg(fig)

# 添加 Axes 和绘图
ax = fig.add_subplot(111)
ax.plot([1, 2, 3, 4], [1, 4, 2, 3], label='Data from how2matplotlib.com')

ax.set_title('Relative Size Plot')
ax.set_xlabel('X-axis')
ax.set_ylabel('Y-axis')
ax.legend()

# 保存图形
canvas.print_figure('relative_size_plot.png', dpi=screen_dpi)
这个例子创建了一个相对尺寸的图形,考虑了屏幕 DPI,使得图形在不同分辨率的屏幕上都能保持相似的物理尺寸。
8.2 使用矢量格式
使用矢量格式(如 SVG)可以确保图形在任何分辨率下都能清晰显示。
示例代码:
import matplotlib.pyplot as plt

fig, ax = plt.subplots(figsize=(8, 6))

# 绘制数据
ax.plot([1, 2, 3, 4], [1, 4, 2, 3], label='Data from how2matplotlib.com')

ax.set_title('Vector Format Plot')
ax.set_xlabel('X-axis')
ax.set_ylabel('Y-axis')
ax.legend()

# 保存为 SVG 格式
plt.savefig('vector_plot.svg', format='svg', dpi=300)

plt.show()
Output:
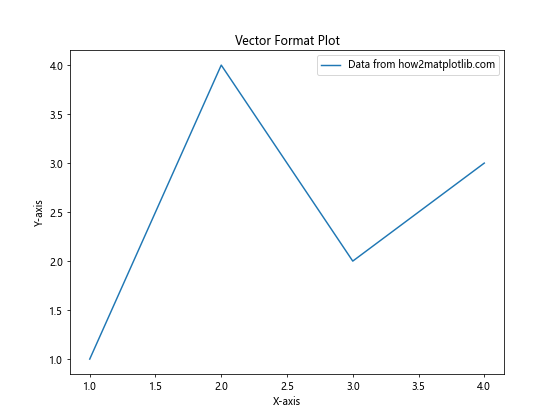
这个例子将图形保存为 SVG 格式,确保在任何分辨率下都能保持清晰。
9. 高级尺寸控制技巧
9.1 使用 GridSpec
GridSpec 允许你创建复杂的子图布局。
示例代码:
import matplotlib.pyplot as plt
import matplotlib.gridspec as gridspec

fig = plt.figure(figsize=(12, 8))
gs = gridspec.GridSpec(2, 2, width_ratios=[1, 2], height_ratios=[2, 1])

ax1 = fig.add_subplot(gs[0, 0])
ax2 = fig.add_subplot(gs[0, 1])
ax3 = fig.add_subplot(gs[1, :])

ax1.plot([1, 2, 3], [3, 2, 1], label='Data 1 from how2matplotlib.com')
ax2.plot([1, 2, 3], [1, 2, 3], label='Data 2 from how2matplotlib.com')
ax3.plot([1, 2, 3, 4], [1, 4, 2, 3], label='Data 3 from how2matplotlib.com')

ax1.set_title('Subplot 1')
ax2.set_title('Subplot 2')
ax3.set_title('Subplot 3')

ax1.legend()
ax2.legend()
ax3.legend()

plt.tight_layout()
plt.show()
Output:
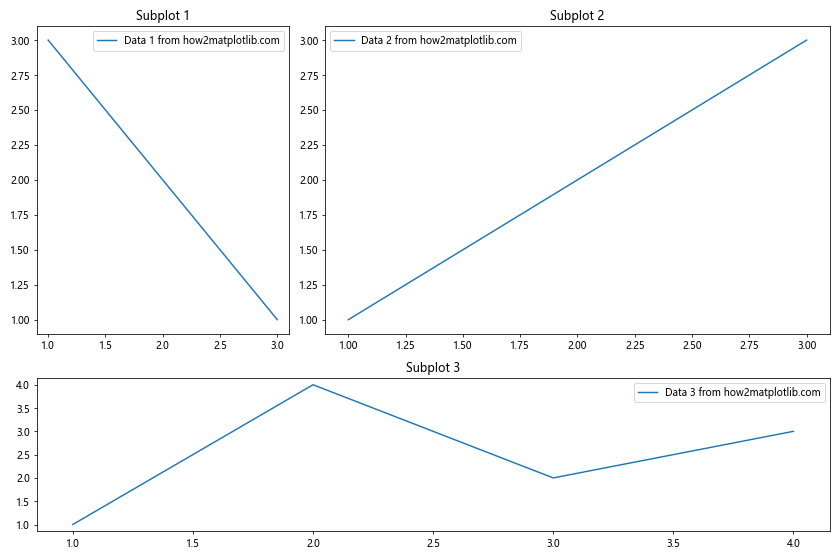
这个例子使用 GridSpec 创建了一个复杂的子图布局,包括不同大小的子图。
9.2 动态调整尺寸
有时你可能需要根据数据动态调整图形尺寸。
示例代码:
import matplotlib.pyplot as plt
import numpy as np

def create_plot(data):
    # 根据数据长度动态设置图形宽度
    width = max(8, len(data) * 0.5)
    fig, ax = plt.subplots(figsize=(width, 6))

    ax.plot(data, label='Dynamic data from how2matplotlib.com')

    ax.set_title(f'Dynamic Plot (Width: {width} inches)')
    ax.set_xlabel('X-axis')
    ax.set_ylabel('Y-axis')
    ax.legend()

    plt.tight_layout()
    plt.show()

# 测试不同长度的数据
short_data = np.random.rand(10)
long_data = np.random.rand(50)

create_plot(short_data)
create_plot(long_data)
这个例子展示了如何根据数据的长度动态调整图形的宽度。
10. 常见问题和解决方案
10.1 图形被裁剪
有时图形的某些部分(如标题或标签)可能会被裁剪。
解决方案示例:
import matplotlib.pyplot as plt

fig, ax = plt.subplots(figsize=(8, 6))

ax.plot([1, 2, 3, 4], [1, 4, 2, 3], label='Data from how2matplotlib.com')

ax.set_title('Plot with Long Title That Might Get Clipped', fontsize=16)
ax.set_xlabel('This is a very long X-axis label', fontsize=12)
ax.set_ylabel('Y-axis', fontsize=12)
ax.legend()

# 调整布局以避免裁剪
plt.tight_layout()

# 如果还是有问题,可以手动调整
#plt.subplots_adjust(top=0.9, bottom=0.15)

plt.show()
Output:
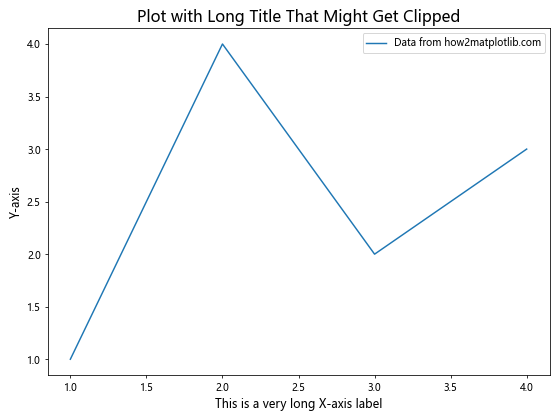
这个例子使用 tight_layout() 自动调整布局,避免标题和标签被裁剪。如果自动调整不够,还可以使用 subplots_adjust() 手动微调。
10.2 图形尺寸在不同环境中不一致
在不同的环境(如 IDE、Jupyter Notebook、保存的文件)中,图形尺寸可能会有所不同。
解决方案示例:
import matplotlib.pyplot as plt

# 设置一致的 DPI
plt.rcParams['figure.dpi'] = 100

fig, ax = plt.subplots(figsize=(8, 6))

ax.plot([1, 2, 3, 4], [1, 4, 2, 3], label='Data from how2matplotlib.com')

ax.set_title('Consistent Size Plot')
ax.set_xlabel('X-axis')
ax.set_ylabel('Y-axis')
ax.legend()

# 保存图形时使用相同的 DPI
plt.savefig('consistent_size_plot.png', dpi=100)

plt.show()
Output:
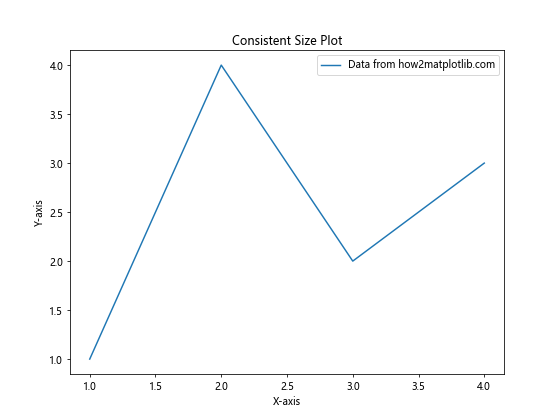
这个例子通过设置一致的 DPI 值,确保图形在不同环境中保持相似的尺寸。
结论
掌握 Matplotlib 中的图形尺寸和单位设置是创建高质量可视化的关键。通过本文介绍的各种技巧和方法,你可以精确控制图形的大小、比例和分辨率,以适应不同的显示需求和输出格式。记住,图形尺寸的选择应该基于你的具体需求,包括数据的复杂性、显示环境和目标受众。通过实践和实验,你将能够创建既美观又实用的数据可视化作品。
最后,建议在实际应用中多尝试不同的设置,找出最适合你的数据和展示需求的尺寸和单位配置。同时,也要考虑到图形的最终用途,如屏幕显示、打印或嵌入文档,以确保在所有情况下都能获得最佳的视觉效果。
 极客教程
极客教程