Matplotlib中使用Figure.set_constrained_layout()优化布局
参考:Matplotlib.figure.Figure.set_constrained_layout() in Python
Matplotlib是Python中最流行的数据可视化库之一,它提供了丰富的绘图功能和灵活的自定义选项。在创建复杂的图表布局时,经常会遇到元素重叠或空间利用不佳的问题。为了解决这些问题,Matplotlib引入了constrained_layout功能,而Figure.set_constrained_layout()方法则是启用和配置这一功能的关键。本文将深入探讨如何使用set_constrained_layout()方法来优化图表布局,提高可读性和美观度。
1. constrained_layout的基本概念
constrained_layout是Matplotlib中的一个自动布局调整功能,它的主要目的是解决以下常见问题:
- 子图之间的重叠
- 轴标签被截断
- 图例位置不合理
- 整体布局不平衡
通过使用constrained_layout,Matplotlib会自动调整图形元素的位置和大小,以确保所有内容都能正确显示,同时保持图表的整体美观。
让我们从一个简单的例子开始,看看如何启用constrained_layout:
import matplotlib.pyplot as plt
import numpy as np

fig, axs = plt.subplots(2, 2, figsize=(8, 8))
fig.set_constrained_layout(True)

for ax in axs.flat:
    x = np.linspace(0, 10, 100)
    y = np.sin(x) + np.random.random(100)
    ax.plot(x, y, label='how2matplotlib.com')
    ax.set_title('Subplot Title')
    ax.set_xlabel('X-axis')
    ax.set_ylabel('Y-axis')
    ax.legend()

plt.show()
Output:
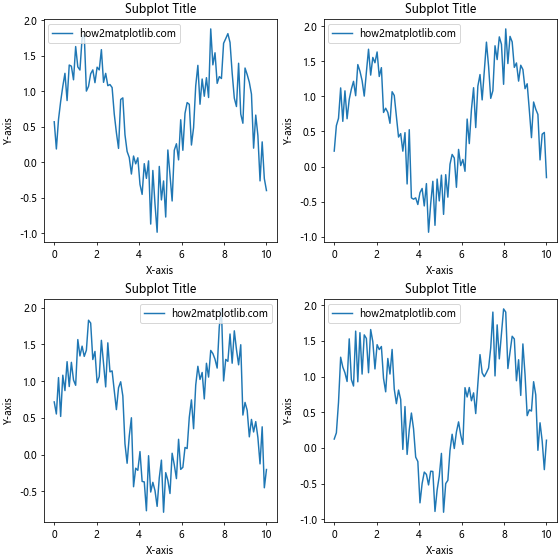
在这个例子中,我们创建了一个2×2的子图网格,并通过fig.set_constrained_layout(True)启用了constrained_layout。这将自动调整子图之间的间距,确保标题、标签和图例都能完整显示。
2. set_constrained_layout()方法的参数
set_constrained_layout()方法接受以下参数:
use: 布尔值,用于启用或禁用constrained_layout。h_pad,w_pad: 浮点数,分别控制子图之间的垂直和水平间距。hspace,wspace: 浮点数,分别控制子图之间的相对垂直和水平间距。
让我们看一个使用这些参数的例子:
import matplotlib.pyplot as plt
import numpy as np

fig, axs = plt.subplots(2, 2, figsize=(10, 10))
fig.set_constrained_layout(use=True, h_pad=0.5, w_pad=0.5, hspace=0.1, wspace=0.1)

for ax in axs.flat:
    x = np.linspace(0, 10, 100)
    y = np.cos(x) + np.random.random(100)
    ax.plot(x, y, label='how2matplotlib.com')
    ax.set_title('Custom Spacing')
    ax.set_xlabel('X-axis')
    ax.set_ylabel('Y-axis')
    ax.legend()

plt.show()
在这个例子中,我们设置了自定义的间距参数。h_pad和w_pad控制绝对间距,而hspace和wspace控制相对间距。这允许我们微调布局以满足特定需求。
3. 与tight_layout的比较
Matplotlib还提供了另一个自动布局调整功能:tight_layout。虽然两者都旨在改善布局,但constrained_layout通常能提供更好的结果,特别是在处理复杂布局时。
让我们比较一下两者的效果:
import matplotlib.pyplot as plt
import numpy as np

# 使用constrained_layout
fig1, axs1 = plt.subplots(2, 2, figsize=(10, 10))
fig1.set_constrained_layout(True)

# 使用tight_layout
fig2, axs2 = plt.subplots(2, 2, figsize=(10, 10))
fig2.tight_layout()

for axs in [axs1, axs2]:
    for ax in axs.flat:
        x = np.linspace(0, 10, 100)
        y = np.tan(x) + np.random.random(100)
        ax.plot(x, y, label='how2matplotlib.com')
        ax.set_title('Layout Comparison')
        ax.set_xlabel('X-axis (with long label)')
        ax.set_ylabel('Y-axis (with long label)')
        ax.legend(loc='upper left', bbox_to_anchor=(1, 1))

plt.show()
Output:
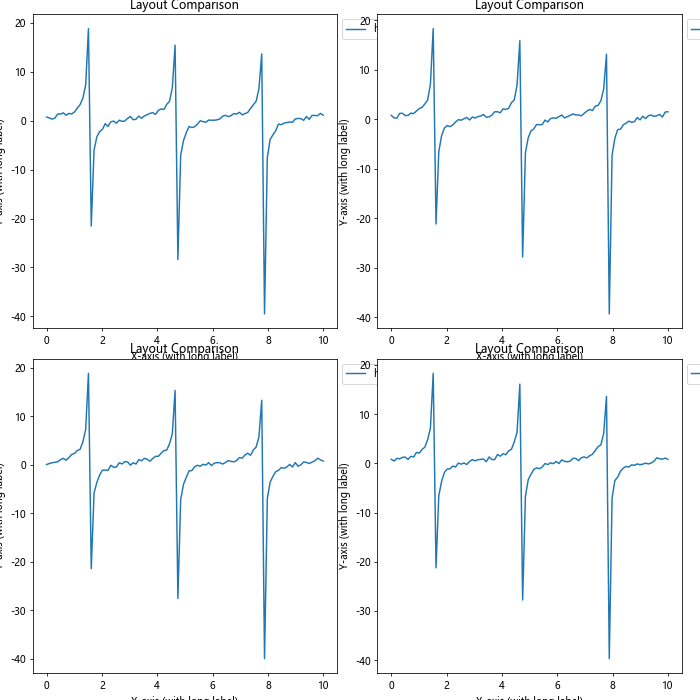
在这个例子中,我们创建了两个图形,一个使用constrained_layout,另一个使用tight_layout。通过比较,你会发现constrained_layout通常能更好地处理长标签和图例位置。
4. 处理复杂布局
constrained_layout的优势在处理复杂布局时更加明显。例如,当我们有不同大小的子图时:
import matplotlib.pyplot as plt
import numpy as np

fig = plt.figure(figsize=(12, 8))
fig.set_constrained_layout(True)

gs = fig.add_gridspec(3, 3)

ax1 = fig.add_subplot(gs[0, :])
ax2 = fig.add_subplot(gs[1, :-1])
ax3 = fig.add_subplot(gs[1:, -1])
ax4 = fig.add_subplot(gs[-1, 0])
ax5 = fig.add_subplot(gs[-1, -2])

for ax in [ax1, ax2, ax3, ax4, ax5]:
    x = np.linspace(0, 10, 100)
    y = np.exp(np.sin(x)) + np.random.random(100)
    ax.plot(x, y, label='how2matplotlib.com')
    ax.set_title('Complex Layout')
    ax.set_xlabel('X-axis')
    ax.set_ylabel('Y-axis')
    ax.legend()

plt.show()
Output:
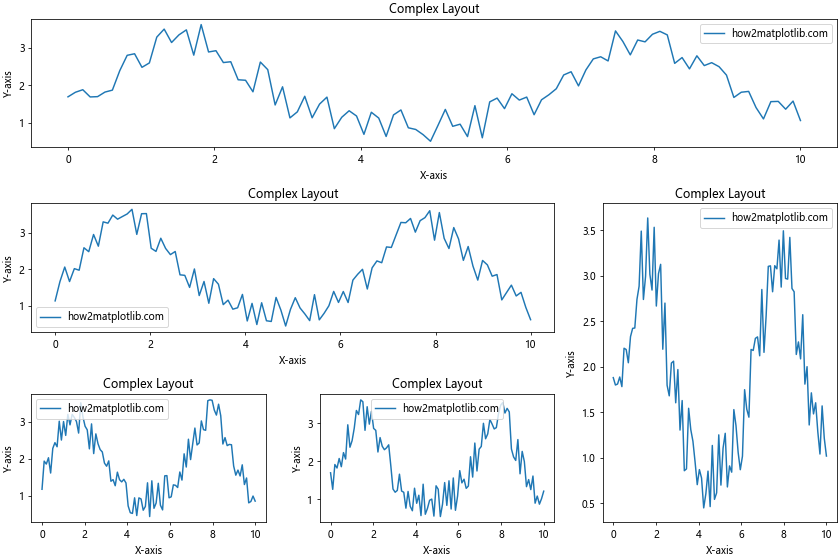
在这个例子中,我们创建了一个复杂的网格布局,包含不同大小和位置的子图。constrained_layout会自动调整每个子图的大小和位置,以确保它们都能正确显示,同时保持整体布局的平衡。
5. 嵌套布局
constrained_layout还可以处理嵌套布局,这在创建复杂的仪表板或报告时特别有用:
import matplotlib.pyplot as plt
import numpy as np

fig = plt.figure(figsize=(12, 8))
fig.set_constrained_layout(True)

gs0 = fig.add_gridspec(1, 2)

gs00 = gs0[0].subgridspec(2, 2)
gs01 = gs0[1].subgridspec(3, 1)

for i in range(2):
    for j in range(2):
        ax = fig.add_subplot(gs00[i, j])
        ax.plot(np.random.rand(10), label='how2matplotlib.com')
        ax.set_title(f'Nested Plot {i*2+j+1}')
        ax.legend()

for i in range(3):
    ax = fig.add_subplot(gs01[i])
    ax.plot(np.random.rand(10), label='how2matplotlib.com')
    ax.set_title(f'Side Plot {i+1}')
    ax.legend()

plt.show()
Output:
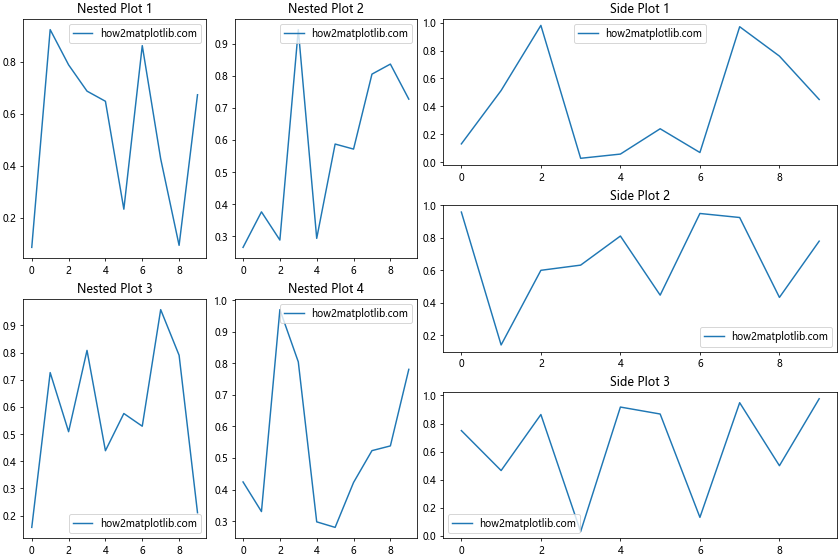
这个例子展示了如何创建一个包含多个嵌套网格的复杂布局。constrained_layout会自动处理所有层级的布局,确保每个子图都有足够的空间。
6. 动态调整布局
有时,我们可能需要在运行时动态调整布局。set_constrained_layout()方法允许我们随时启用或禁用constrained_layout:
import matplotlib.pyplot as plt
import numpy as np

fig, axs = plt.subplots(2, 2, figsize=(10, 10))

for ax in axs.flat:
    x = np.linspace(0, 10, 100)
    y = np.log(x + 1) + np.random.random(100)
    ax.plot(x, y, label='how2matplotlib.com')
    ax.set_title('Dynamic Layout')
    ax.set_xlabel('X-axis')
    ax.set_ylabel('Y-axis')
    ax.legend()

# 初始状态不使用constrained_layout
plt.show()

# 启用constrained_layout
fig.set_constrained_layout(True)
plt.show()

# 再次禁用constrained_layout
fig.set_constrained_layout(False)
plt.show()
这个例子展示了如何在同一个图形上动态切换constrained_layout的状态。这在交互式环境中特别有用,可以让用户根据需要调整布局。
7. 处理colorbar和子图标题
当使用colorbar或子图标题时,constrained_layout也能很好地处理这些额外元素:
import matplotlib.pyplot as plt
import numpy as np

fig, axs = plt.subplots(2, 2, figsize=(10, 10))
fig.set_constrained_layout(True)

for ax in axs.flat:
    im = ax.imshow(np.random.rand(10, 10), cmap='viridis')
    ax.set_title('Subplot with Colorbar')
    fig.colorbar(im, ax=ax, label='how2matplotlib.com')

fig.suptitle('Main Title for how2matplotlib.com', fontsize=16)
plt.show()
Output:
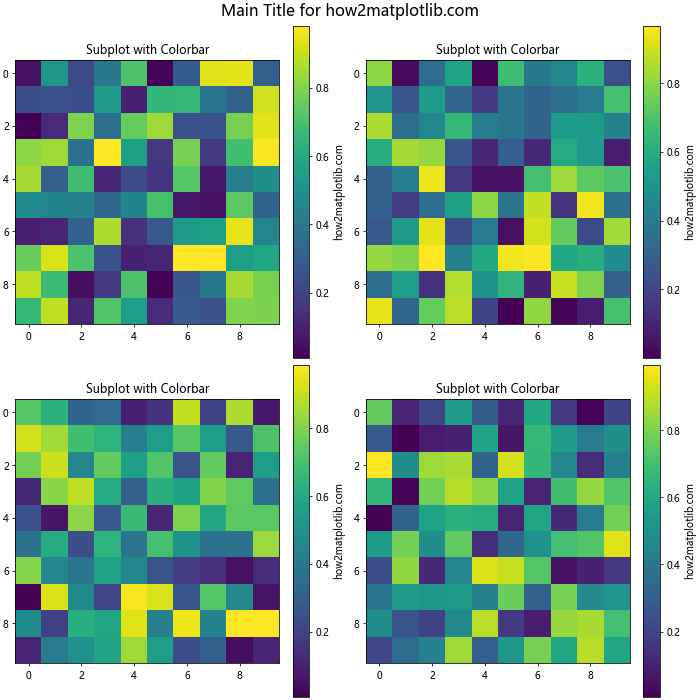
在这个例子中,我们为每个子图添加了一个colorbar,并为整个图形添加了一个主标题。constrained_layout会自动调整布局,以确保所有元素都能正确显示。
8. 处理不同大小的子图
constrained_layout还可以处理不同大小的子图,这在创建复杂的数据可视化时非常有用:
import matplotlib.pyplot as plt
import numpy as np

fig = plt.figure(figsize=(12, 8))
fig.set_constrained_layout(True)

gs = fig.add_gridspec(3, 3)

ax1 = fig.add_subplot(gs[0, :2])
ax2 = fig.add_subplot(gs[0, 2])
ax3 = fig.add_subplot(gs[1:, :2])
ax4 = fig.add_subplot(gs[1, 2])
ax5 = fig.add_subplot(gs[2, 2])

axes = [ax1, ax2, ax3, ax4, ax5]

for i, ax in enumerate(axes):
    x = np.linspace(0, 10, 100)
    y = np.sin(x * (i + 1)) + np.random.random(100)
    ax.plot(x, y, label=f'Plot {i+1} - how2matplotlib.com')
    ax.set_title(f'Subplot {i+1}')
    ax.set_xlabel('X-axis')
    ax.set_ylabel('Y-axis')
    ax.legend()

plt.show()
Output:
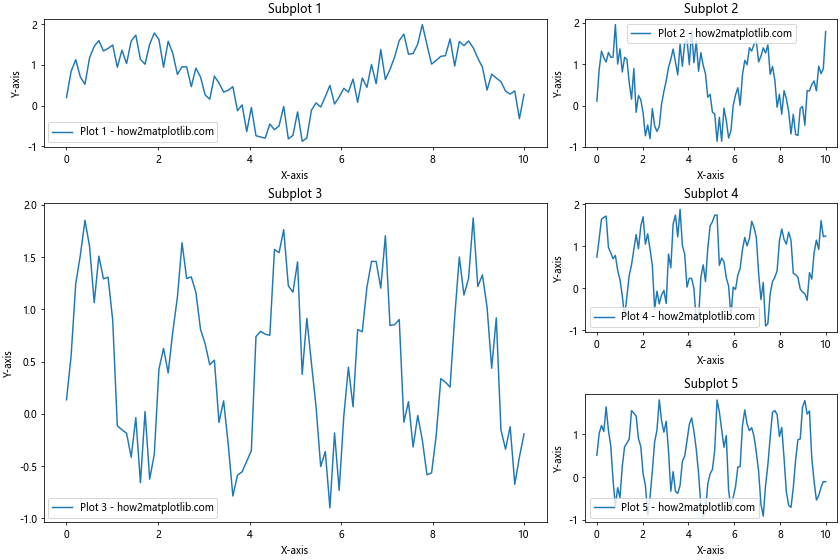
这个例子创建了一个包含不同大小子图的布局。constrained_layout会自动调整每个子图的大小和位置,以确保它们都能正确显示,同时保持整体布局的平衡。
9. 处理极坐标图
constrained_layout也适用于极坐标图等特殊类型的图表:
import matplotlib.pyplot as plt
import numpy as np

fig, (ax1, ax2) = plt.subplots(1, 2, figsize=(12, 6), subplot_kw=dict(projection='polar'))
fig.set_constrained_layout(True)

r = np.linspace(0, 1, 100)
theta = 2 * 2 * np.pi * r

ax1.plot(theta, r, label='how2matplotlib.com')
ax1.set_title('Polar Plot 1')

ax2.plot(theta, r**2, label='how2matplotlib.com')
ax2.set_title('Polar Plot 2')

for ax in (ax1, ax2):
    ax.legend()

plt.show()
Output:
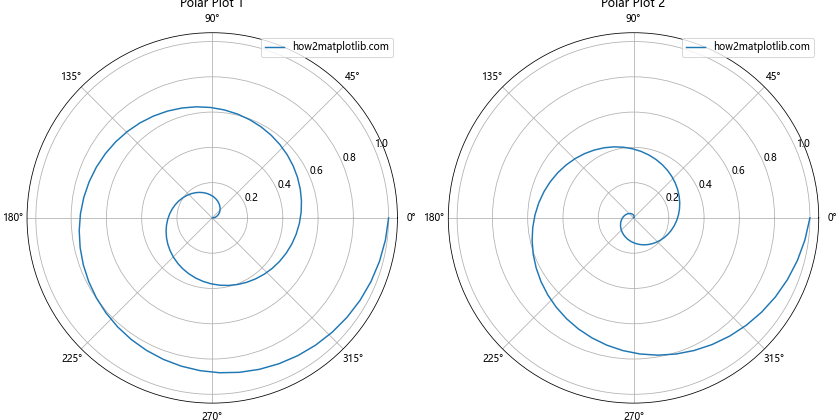
在这个例子中,我们创建了两个极坐标图。constrained_layout会自动调整这些特殊类型图表的布局,确保它们正确显示。
10. 与其他布局方法的结合
虽然constrained_layout通常能很好地处理大多数情况,但有时我们可能需要将其与其他布局方法结合使用:
import matplotlib.pyplot as plt
import numpy as np

fig = plt.figure(figsize=(12, 8))
fig.set_constrained_layout(True)

gs = fig.add_gridspec(2, 2)

ax1 = fig.add_subplot(gs[0, 0])
ax2 = fig.add_subplot(gs[0, 1])
ax3 = fig.add_subplot(gs[1, :])

for i, ax in enumerate([ax1, ax2, ax3]):
    x = np.linspace(0, 10, 100)
    y = np.exp(np.sin(x * (i + 1))) + np.random.random(100)
    ax.plot(x, y, label=f'Plot {i+1} - how2matplotlib.com')
    ax.set_title(f'Subplot {i+1}')
    ax.set_xlabel('X-axis')
    ax.set_ylabel('Y-axis')
    ax.legend()

# 手动调整子图之间的间距
plt.subplots_adjust(hspace=0.4)

plt.show()
Output:
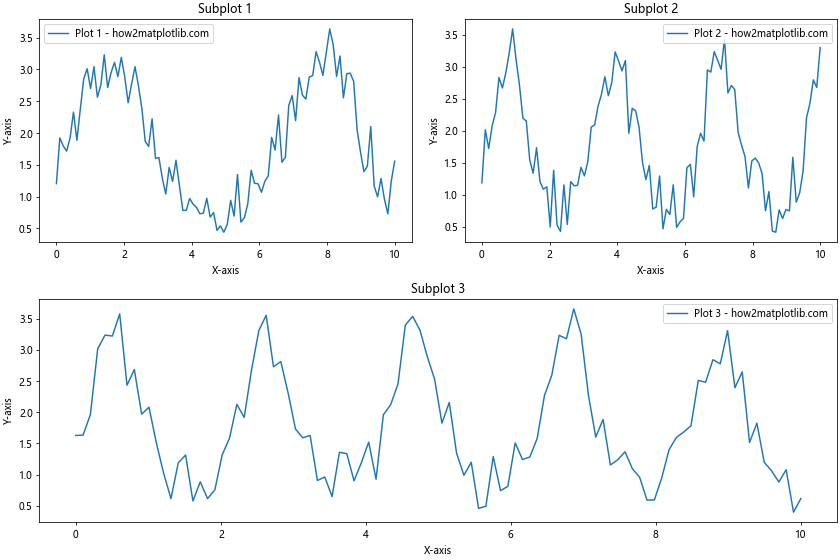
在这个例子中,我们使用了constrained_layout,但同时也使用了plt.subplots_adjust()来手动调整子图之间的垂直间距。这种组合可以让我们在自动布局的基础上进行微调。
结论
Matplotlib的Figure.set_constrained_layout()方法是一个强大的工具,可以帮助我们创建美观、易读的图表布局。它能够自动处理各种复杂的布局情况,包括不同大小的子图、嵌套布局、特殊类型的图表等。通过使用constrained_layout,我们可以大大减少手动调整布局的时间,同时确保图表的各个元素都能正确显示。
以下是一些使用set_constrained_layout()时的最佳实践和注意事项:
- 尽早启用:最好在创建图形时就启用constrained_layout,这样可以确保所有后续添加的元素都能被正确考虑在内。
-
调整参数:如果默认的布局不能满足你的需求,可以尝试调整
h_pad、w_pad、hspace和wspace参数来微调布局。 -
结合其他方法:在某些情况下,可能需要将constrained_layout与其他布局方法(如
subplots_adjust())结合使用,以实现更精细的控制。 -
注意性能:对于非常复杂的布局或大量子图,constrained_layout可能会增加一些计算开销。在这种情况下,可以考虑使用
tight_layout()或手动调整布局。 -
处理动态内容:如果你的图表内容是动态变化的,可能需要在每次更新后重新调用
fig.set_constrained_layout(True)来刷新布局。
让我们再看几个高级应用的例子,以进一步展示set_constrained_layout()的功能:
11. 处理多行标题和长标签
有时,我们可能需要处理多行标题或非常长的轴标签。constrained_layout可以很好地处理这些情况:
import matplotlib.pyplot as plt
import numpy as np

fig, axs = plt.subplots(2, 2, figsize=(12, 10))
fig.set_constrained_layout(True)

for i, ax in enumerate(axs.flat):
    x = np.linspace(0, 10, 100)
    y = np.sin(x * (i + 1)) + np.random.random(100)
    ax.plot(x, y, label='how2matplotlib.com')
    ax.set_title(f'Subplot {i+1}\nwith a very long title\nthat spans multiple lines')
    ax.set_xlabel('This is a very long X-axis label that might cause problems')
    ax.set_ylabel('This is a very long Y-axis label that might cause problems')
    ax.legend()

fig.suptitle('Main title for how2matplotlib.com\nwith multiple lines', fontsize=16)
plt.show()
Output:
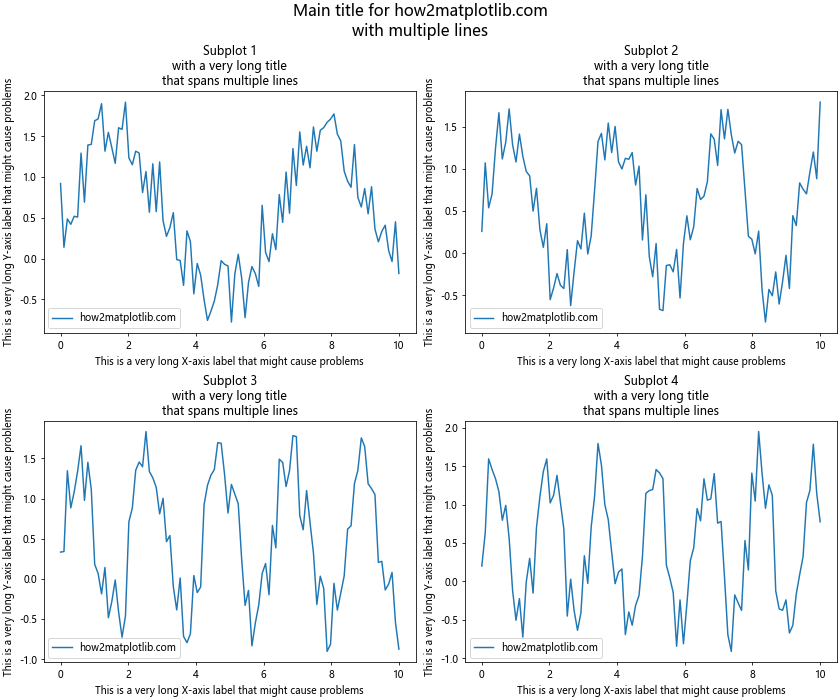
在这个例子中,我们为每个子图添加了多行标题和长轴标签。constrained_layout会自动调整布局,以确保所有文本都能完整显示。
12. 处理不同类型的图表
constrained_layout可以处理混合不同类型的图表:
import matplotlib.pyplot as plt
import numpy as np

fig = plt.figure(figsize=(12, 8))
fig.set_constrained_layout(True)

gs = fig.add_gridspec(2, 3)

ax1 = fig.add_subplot(gs[0, 0])
ax2 = fig.add_subplot(gs[0, 1:])
ax3 = fig.add_subplot(gs[1, :2])
ax4 = fig.add_subplot(gs[1, 2])

# 线图
x = np.linspace(0, 10, 100)
ax1.plot(x, np.sin(x), label='how2matplotlib.com')
ax1.set_title('Line Plot')
ax1.legend()

# 散点图
ax2.scatter(np.random.rand(50), np.random.rand(50), label='how2matplotlib.com')
ax2.set_title('Scatter Plot')
ax2.legend()

# 柱状图
ax3.bar(range(5), np.random.rand(5), label='how2matplotlib.com')
ax3.set_title('Bar Plot')
ax3.legend()

# 饼图
ax4.pie([1, 2, 3, 4], labels=['A', 'B', 'C', 'D'], autopct='%1.1f%%')
ax4.set_title('Pie Chart')

plt.show()
Output:
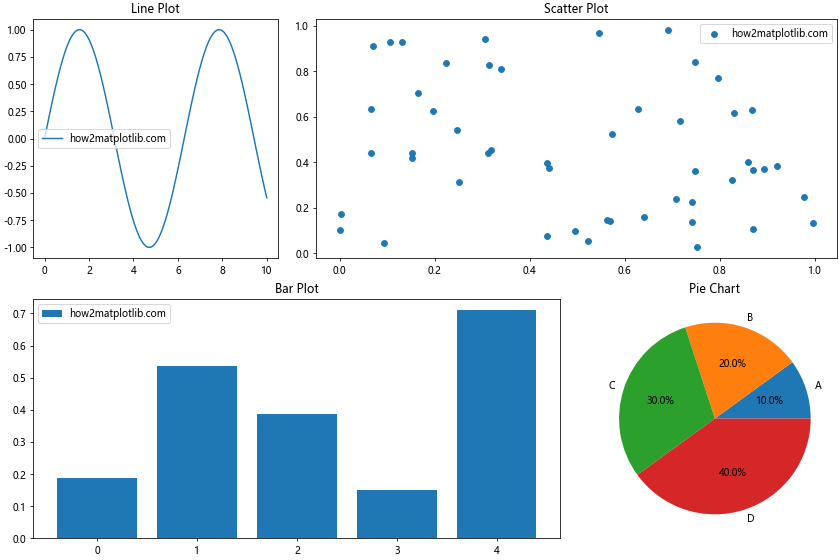
这个例子展示了如何在一个图形中混合使用不同类型的图表,包括线图、散点图、柱状图和饼图。constrained_layout会自动调整每个子图的大小和位置,以创建一个平衡的布局。
13. 处理图例和注释
当图表包含多个图例和注释时,constrained_layout也能很好地处理:
import matplotlib.pyplot as plt
import numpy as np

fig, ax = plt.subplots(figsize=(10, 6))
fig.set_constrained_layout(True)

x = np.linspace(0, 10, 100)
ax.plot(x, np.sin(x), label='Sin - how2matplotlib.com')
ax.plot(x, np.cos(x), label='Cos - how2matplotlib.com')
ax.plot(x, np.tan(x), label='Tan - how2matplotlib.com')

ax.set_title('Trigonometric Functions')
ax.set_xlabel('X-axis')
ax.set_ylabel('Y-axis')

# 添加多个图例
ax.legend(loc='upper left', bbox_to_anchor=(1, 1))
ax.legend(loc='upper left', bbox_to_anchor=(1, 0.5))
ax.legend(loc='upper left', bbox_to_anchor=(1, 0))

# 添加注释
ax.annotate('Peak', xy=(1.5, 1), xytext=(3, 1.5),
            arrowprops=dict(facecolor='black', shrink=0.05))
ax.annotate('Trough', xy=(4.5, -1), xytext=(6, -1.5),
            arrowprops=dict(facecolor='black', shrink=0.05))

plt.show()
Output:
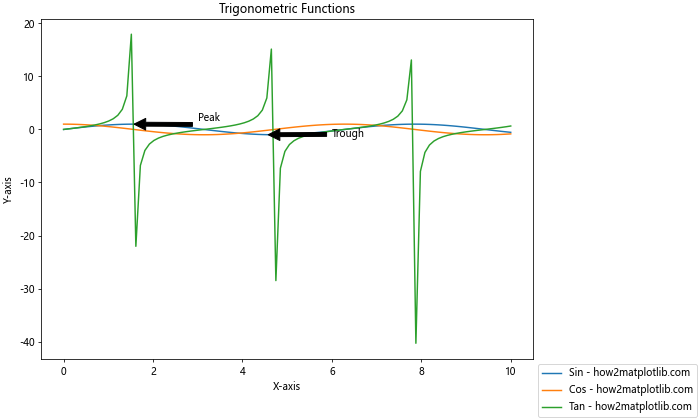
在这个例子中,我们添加了多个图例和注释。constrained_layout会自动调整布局,以确保所有这些额外元素都能正确显示,而不会相互重叠或被截断。
14. 处理共享轴的子图
当创建具有共享轴的子图时,constrained_layout也能很好地工作:
import matplotlib.pyplot as plt
import numpy as np

fig, axs = plt.subplots(2, 2, figsize=(10, 10), sharex=True, sharey=True)
fig.set_constrained_layout(True)

for ax in axs.flat:
    x = np.linspace(0, 10, 100)
    y = np.random.normal(0, 1, 100).cumsum()
    ax.plot(x, y, label='how2matplotlib.com')
    ax.set_title('Shared Axes Plot')
    ax.legend()

fig.suptitle('Plots with Shared Axes', fontsize=16)
fig.text(0.5, 0.04, 'Common X-axis', ha='center')
fig.text(0.04, 0.5, 'Common Y-axis', va='center', rotation='vertical')

plt.show()
Output:
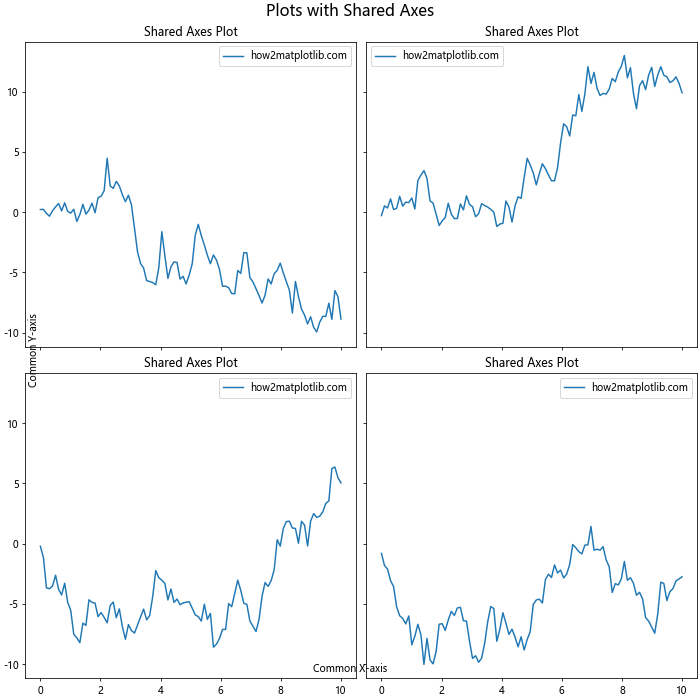
这个例子创建了一个2×2的子图网格,其中所有子图共享X轴和Y轴。constrained_layout会自动调整布局,以确保共享轴的标签不会重叠,同时保持整体布局的平衡。
15. 处理大量子图
即使在处理大量子图时,constrained_layout也能保持良好的性能:
import matplotlib.pyplot as plt
import numpy as np

fig, axs = plt.subplots(5, 5, figsize=(15, 15))
fig.set_constrained_layout(True)

for ax in axs.flat:
    x = np.linspace(0, 10, 100)
    y = np.random.normal(0, 1, 100).cumsum()
    ax.plot(x, y, label='how2matplotlib.com')
    ax.set_title('Subplot')
    ax.legend(fontsize='xx-small')

fig.suptitle('Many Subplots with Constrained Layout', fontsize=16)
plt.show()
Output:
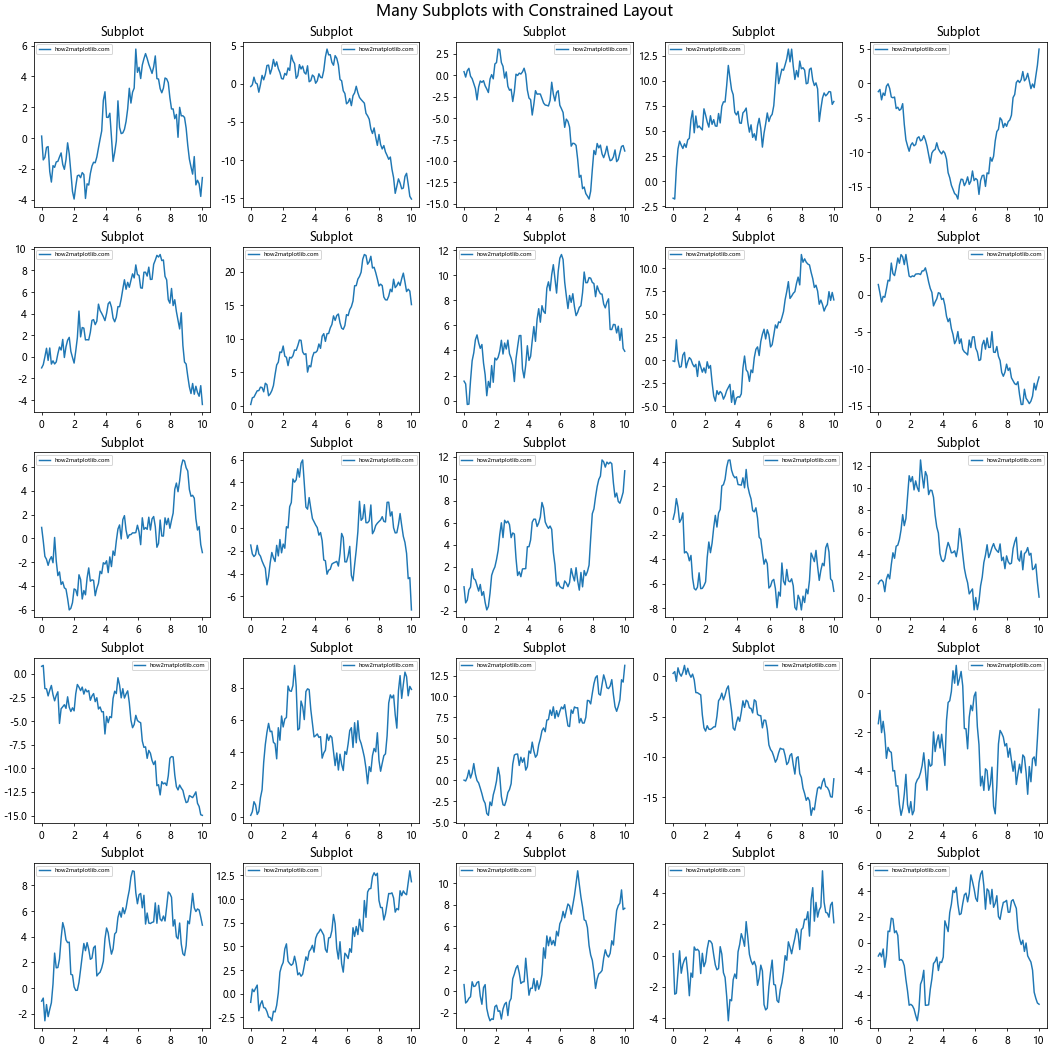
这个例子创建了一个5×5的子图网格,总共25个子图。尽管子图数量很多,constrained_layout仍然能够有效地调整布局,确保每个子图都有足够的空间,并且标签和图例不会重叠。
总结起来,Figure.set_constrained_layout()是Matplotlib中一个非常有用的工具,它可以帮助我们轻松创建复杂的图表布局,而无需进行大量的手动调整。通过自动处理子图之间的间距、标签位置和图例放置,它大大简化了创建专业外观图表的过程。无论是简单的单图还是复杂的多图布局,constrained_layout都能提供一个清晰、美观的结果。在日常的数据可视化工作中,熟练使用这个功能可以显著提高工作效率和图表质量。
 极客教程
极客教程